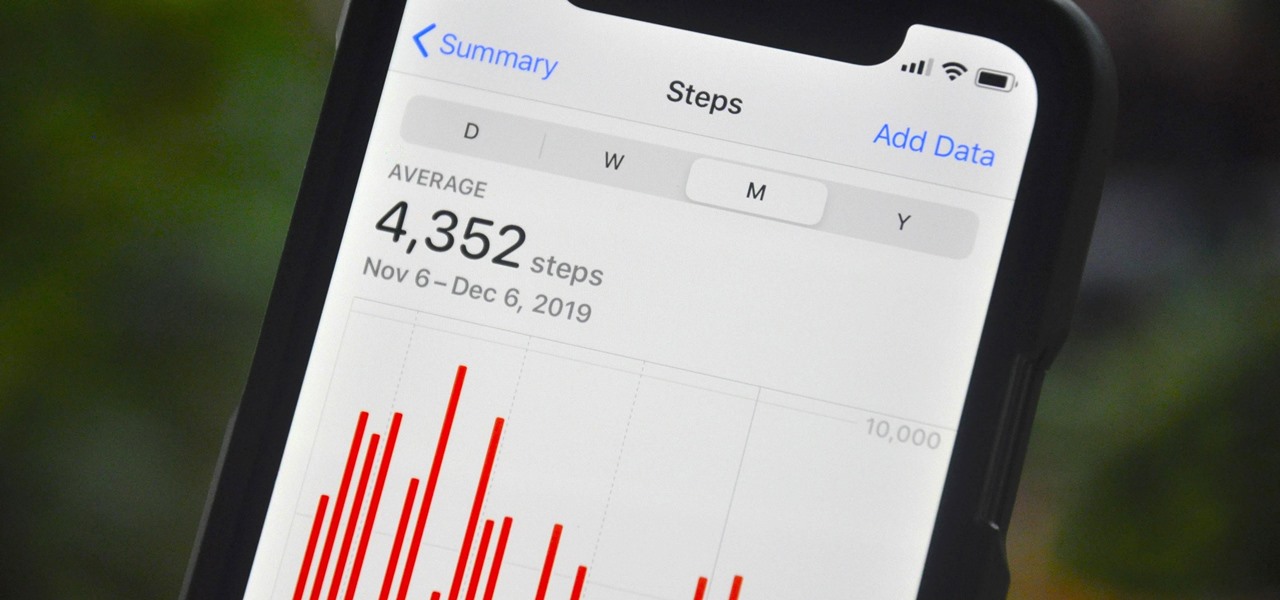
Every iPhone since the 5S has come equipped with a microchip called a motion coprocessor, which collects data from integrated accelerometers, gyroscopes and compasses, and can then transfer that information to fitness apps that track physical activity. Essentially, the chip knows whether you're running, walking, sleeping, or driving — but what if you don't want it to?

In the realm of internet security, it's becoming clear that augmented reality is not immune to the increasing wave data breaches plaguing users.
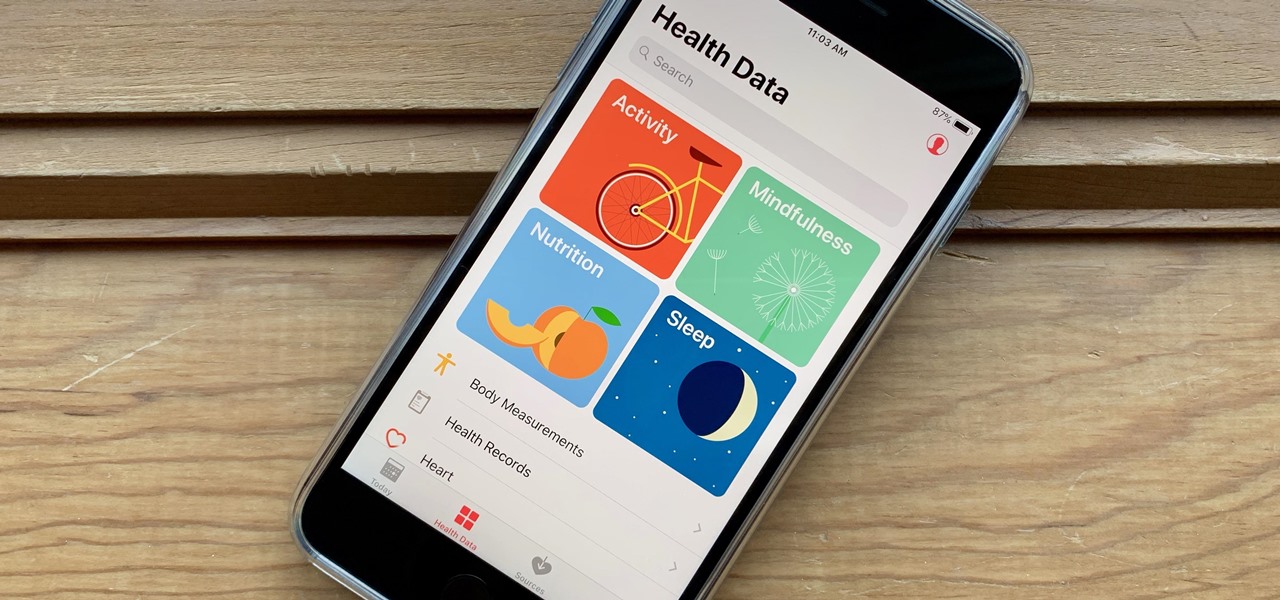
It's not easy staying fit and healthy these days with addicting phones, oversized portions, and long workdays, to name just a few things. To succeed, it takes work, commitment, and an understanding of your mind and body — and your iPhone can help you with some of that. While Apple pushed its Screen Time tool to help curb unhealthy smartphone habits, its "Health" app can help with everything else.
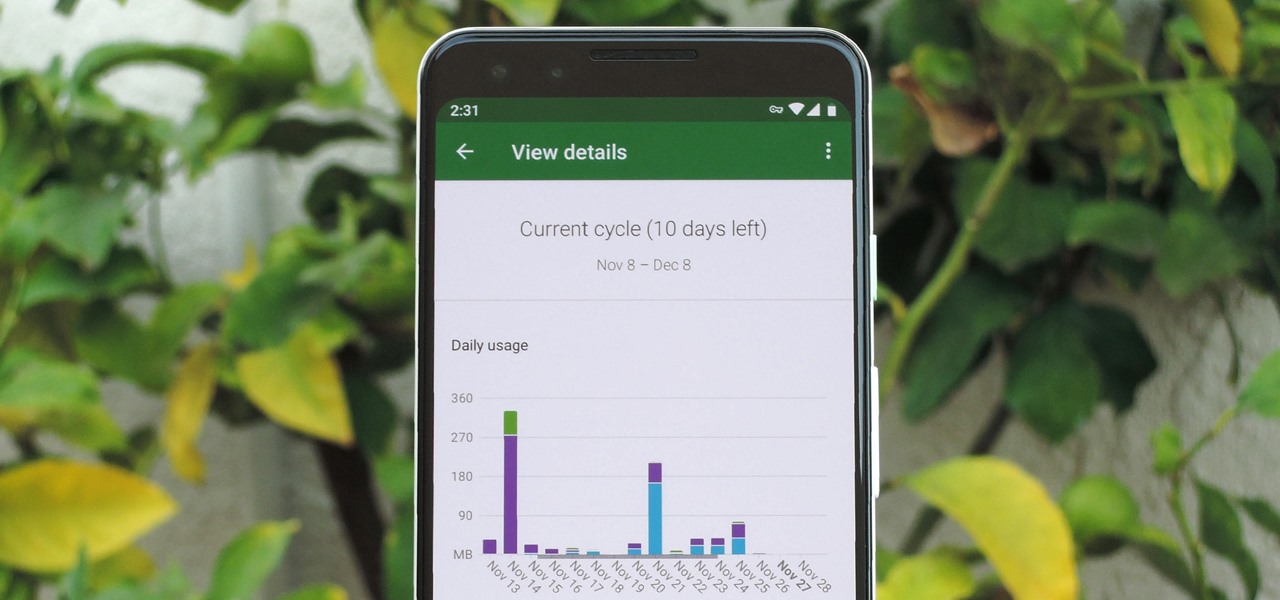
In case you hadn't heard, Google is now a legit cell service provider. Google Fi has its pluses and minuses, but the biggest upside is in the pricing. Depending on how much data you typically use, there's a good chance you could save a lot of money without sacrificing coverage by switching to Fi.

With the iPhone XS, XS Max, and XR, Apple introduced dual-SIM capabilities to iOS, made possible by eSIM technology. If you recently picked up one of these three new iPhones and need to utilize your eSIM while traveling abroad, you might want to take a look at the data plans offered by GigSky.
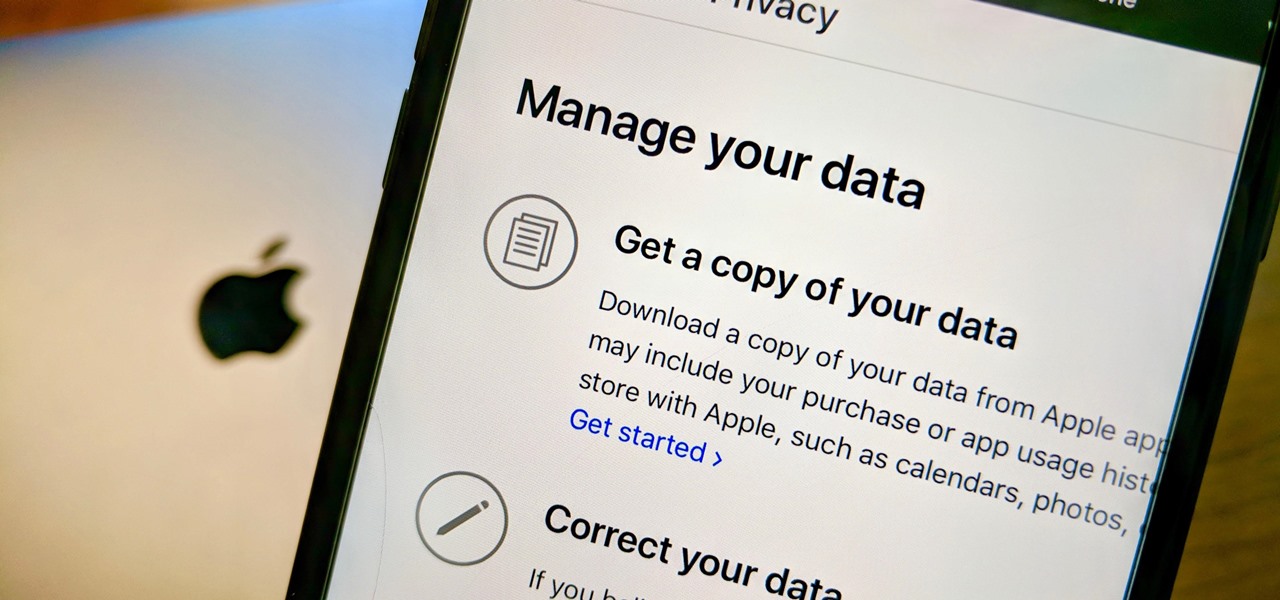
Personal data is a hot topic right now, and for good reason. Never before has the public been so on edge about how companies use their information. Services like Facebook and Google now allow you to download all of the data each has on file. Soon, you'll be able to see exactly the same for Apple as well.

Another AR cloud savior has emerged this week in Fantasmo, a startup that wants to turn anyone with a smartphone into a cartographer for spatial maps.

Most of the free apps you'll find on the Play Store have ads. These ads are personalized — in other words, they're for products and services Google believes you might be interested in. The way Google knows about your interests is by collecting data from your smartphone, including your location and app usage. While personalized ads have their advantages, the collection of data is unsettling.

So much information exists online that it's easy to get lost in data while researching. Understanding the bigger picture can take a lot of time and energy, but narrowing the question to one that's easy to answer is the first step of any investigation. That's why analysts use open-source intelligence (OSINT) tools like Maltego — to help refine raw data into a complete understanding of a situation.

While augmented reality is a means for presenting news to their audiences to some media outlets, Bloomberg is interested in how the technology can improve the way journalists work.

It seems almost every carrier now has an unlimited data plan, and free Wi-Fi is now available in more places than ever before. If you want to be connected, it has never been easier — but that still doesn't mean that everyone can stream as much as they please.

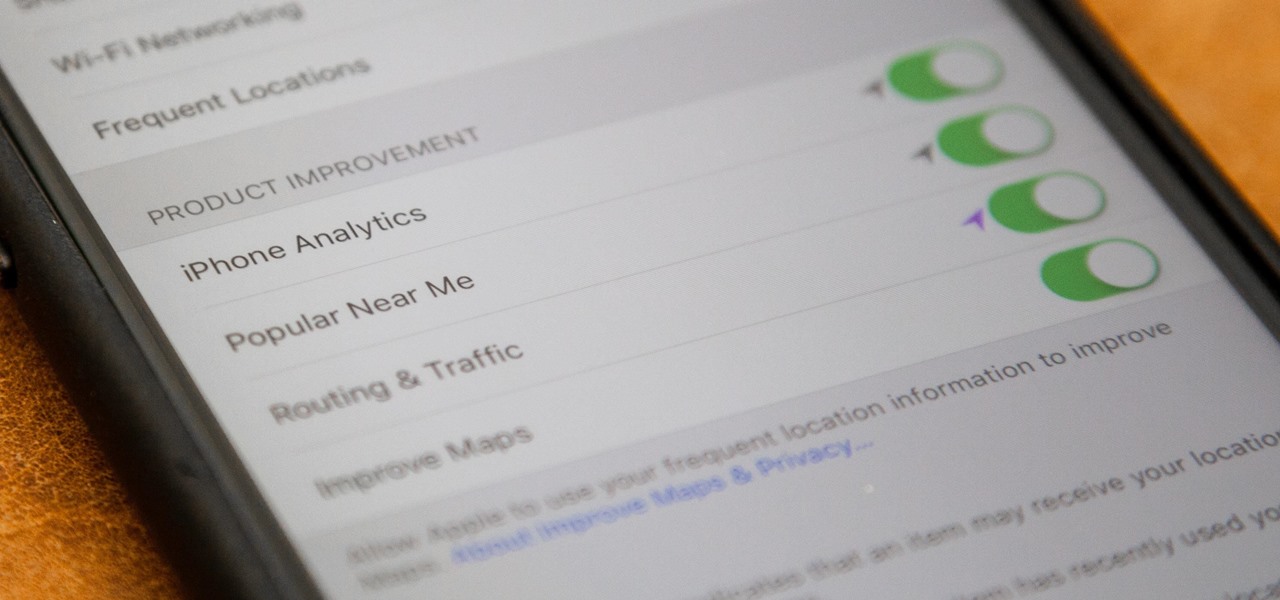
If you just installed the iOS 11 beta on your iPhone, you're automatically sending your location data to Apple — even if you don't want to. Luckily, there's an easy way to prevent Apple from seeing this data if you don't want them to.

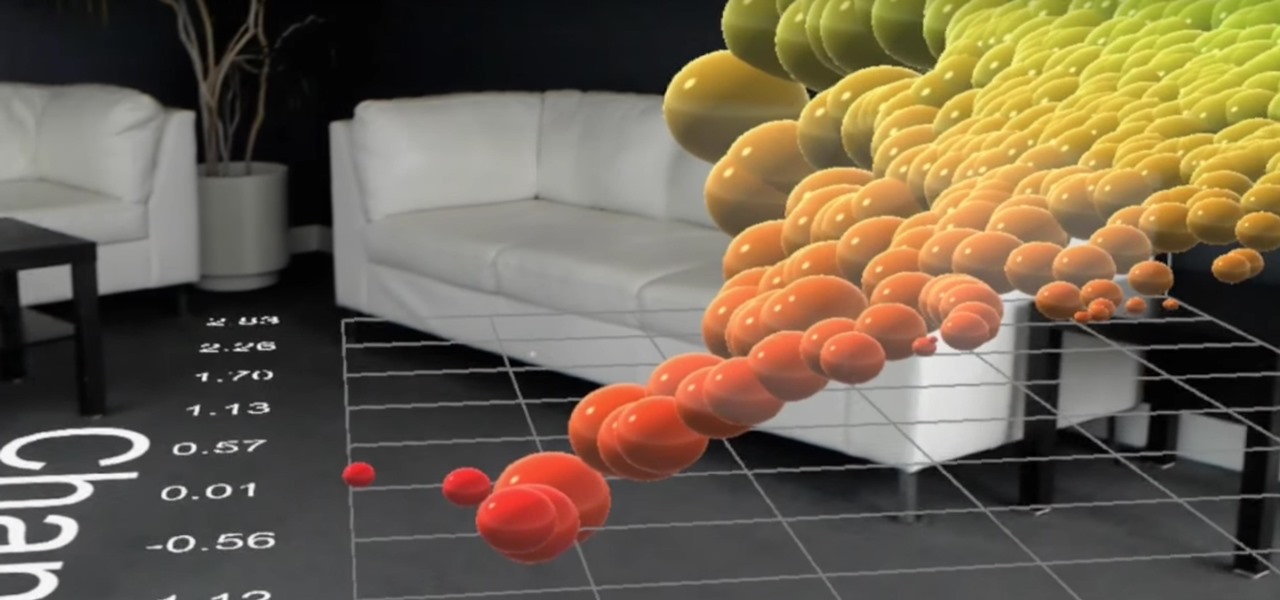
HoloLens developer Michael Peters of In-Vizible has released quite a few videos since receiving his HoloLens last year. Many of his experiments are odd and funny, but some include serious potential approaches to data visualization. In the videos embedded below, you'll specifically see stock market information beautifully rendered in different ways to help understand the data.

Everyone loves sharing pictures and quick video clips with Snapchat, but while the service itself is tons of fun, the Android app is one of the worst on the market. For one, Snapchat takes terrible photos even on high-end Android phones. And to make matters worse, the app is a notorious data-sucking battery drainer.

Our future technology has a lot of amazing possibilities, and few have more promise than augmented and mixed reality headsets. But these advancements come with several concerns over privacy, and if we don't understand them, we may lose control of our own data without even knowing.

If you tend to go over your data allotment each month, or are constantly afraid you will, Verizon Wireless is giving you chance to relax a little bit with up to 2 GB free data for two months.

I'm lucky enough to have internet access on my laptop practically everywhere I go because of my mobile hotspot plan. All I have to do is enable the personal hotspot feature from my iPhone and I can surf the web on any Wi-Fi enabled device. But of course, there's a catch.

Whether you are sending your phone in for repairs or finally selling it to upgrade to a new flagship, you are going to need to make sure all of your personal data is removed from your device.

Recently, a group of Duke University students got together to tackle an age-old problem with mobile devices. You see, mobile data coverage isn't exactly ubiquitous, and many folks have restrictive mobile data plans, which means internet connectivity is not always an option.

As the protectors of all things good, the Federal Communications Commission is usually busy behind the scenes pissing off Slim Shady, giving out fines for indecent nipple exposure at certain halftime events, and warning the NSA about losing any "confidential" phone information they steal from us.

In this video Henry shows you how to finish all the exterior trim on the shed. This video includes lot of tips to make the finish carpentry in this video easy and accurate.

Blowguns can be really fun and accurate if they're made well. The darts hurt even without 'upgrades' so I really don't recommend adding needles to the points.

Free stuff is pretty cool. Free internet is even cooler—and free internet that is actually free is the coolest. If you would rather avoid sitting in a Starbucks and having to listen to hipsters discuss the proper length of cropped jeans, then this should be of interest.

Tons of iPhone 5 users with Verizon Wireless hit the message boards last week complaining about their phones sucking down massive amounts of cellular data when they were actually using a Wi-Fi connection. Of course, that means Verizon customers could have been getting charged for cellular data they weren't actually using.

This video tutorial is in the Education category which will show you how to calculate standard deviation with TI graphing calculator. First you got to enter the data in to the calculator. Go to stat and click on enter. This will edit a list. Now you type in these numbers: 50, 20, 33, 40 and 55. Then press stat and click on enter. This will bring up the 1-var stats page. Press the "2nd" button and L1, because all our data is in L1. Click on enter and you will get all the data that you will nee...

BitLocker. What is it? And what can it do for you? Well, it's a handy new feature built-in to Windows 7, and it can help protect all of your data from loss, theft, or hackers. It's the easiest way to make sure your documents and files are safe from the devil's hands.

In this tutorial, we learn how to make your first graph in Microsoft Excel. First, open a new graph and enter in your data. Click and drag down from the original date you enter to have the other dates automatically entered in. Enter the rest of your information, then highlight all the data. Go to the menu and click "insert", then "chart". Now, go through the chart wizard to select what kind of chart you want to make. When you are finished entering all your preferences, change your values so t...

If you use Microsoft Excel on a regular basis, odds are you work with numbers. Put those numbers to work. Statistical analysis allows you to find patterns, trends and probabilities within your data. In this MS Excel tutorial from everyone's favorite Excel guru, YouTube's ExcelsFun, the 20th installment in his "Excel Statistics" series of free video lessons, you'll learn how to take raw quantitative (numerical) data and figure out how to group it into classes so that you can have categories an...

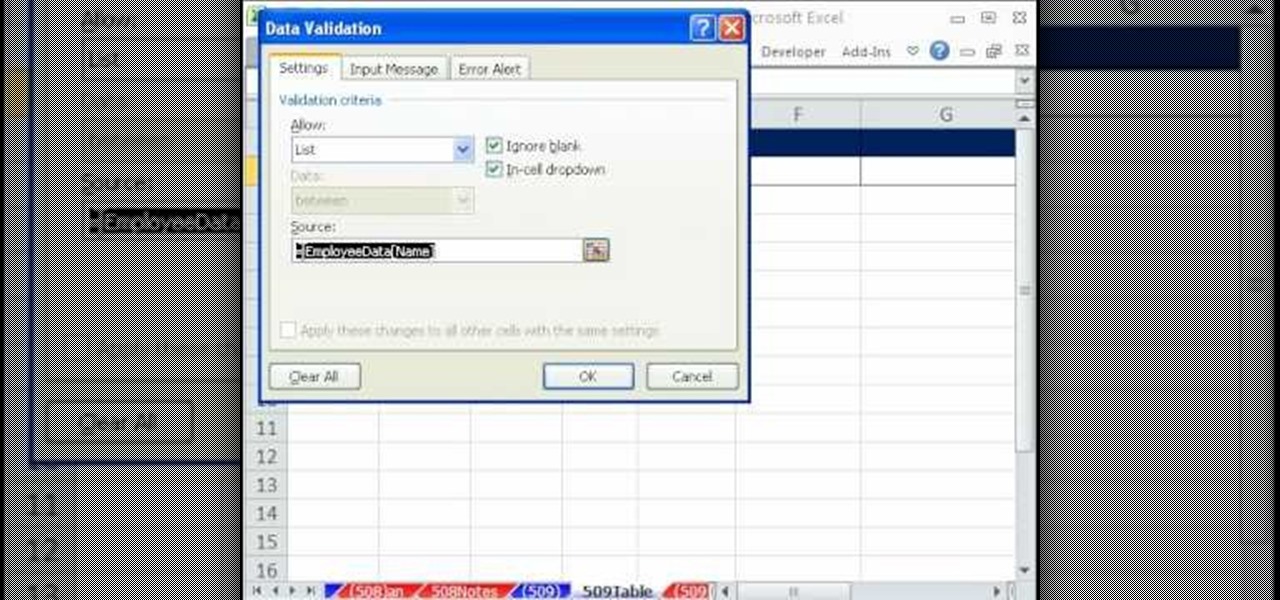
In this video tutorial, viewers will learn how to create a table for the VLOOKUP function in Excel. Create a dynamic table for the VLOOKUP function as well as a dynamic lookup area so that as you add new data or columns to the Lookup table. Create dynamic ranges using the Excel Table feature and Table Formula Nomenclature for the Data Validation drop-down list, the VLOOKUP table and the MATCH table. See an IF function formula that creates new labels as new columns are added to the lookup tabl...

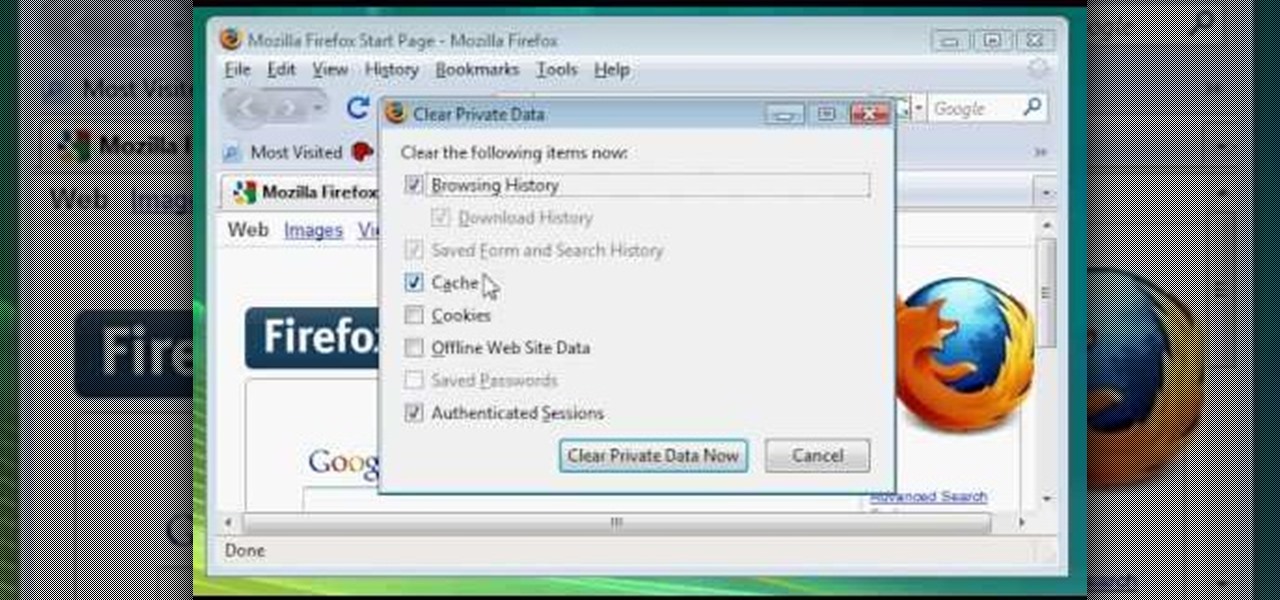
Here Danny Beales shows you how to quickly clear your Firefox cache and cookies. To clear your Firefox cache, do the following: Go to Tools Clear Private Data Select which data you would like to have cleared, and click on Clear Private Data. Your cookies and/or cache has been cleared. Remember to do this from time to time, because it will help speed up your browser's performance as well as keep harmful cookies from tracking your browsing.

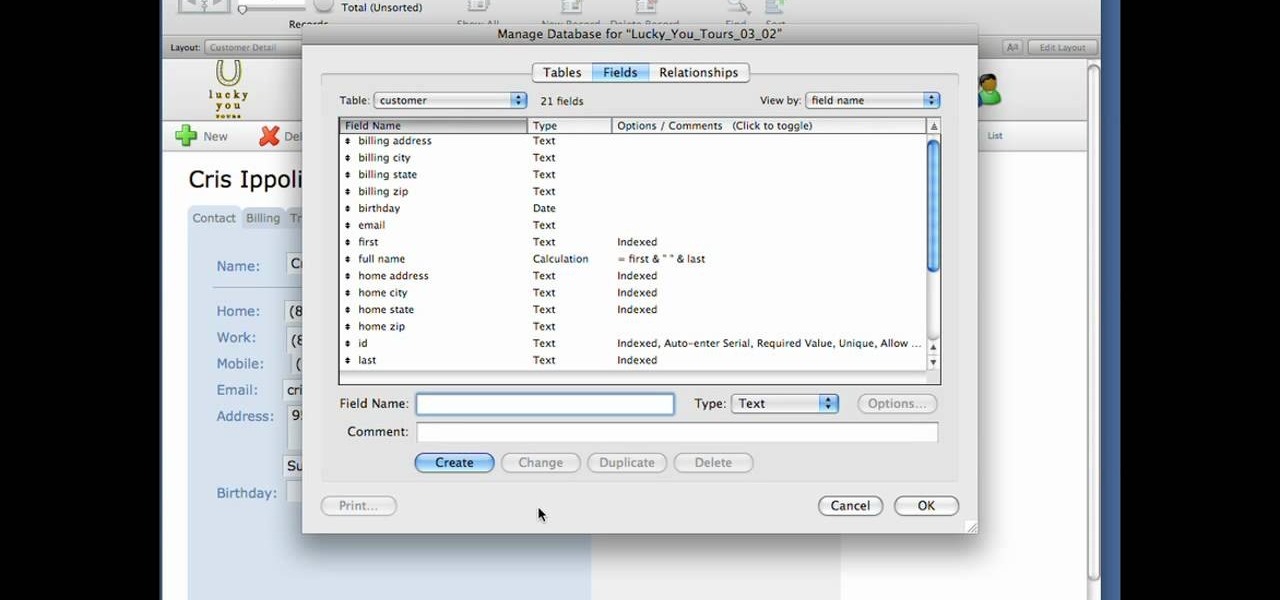
If your into data based business,then this one's for you. Text field's are very much important while making a data based solution in FileMaker Pro 10.You can go to file menu>manage>database and there is the field's tab. Text field is used for storing text and no other such use. Text field's can hold up to 2GB of information. It can help to store raw data and formatting information, i.e., color,point size as well as type face.

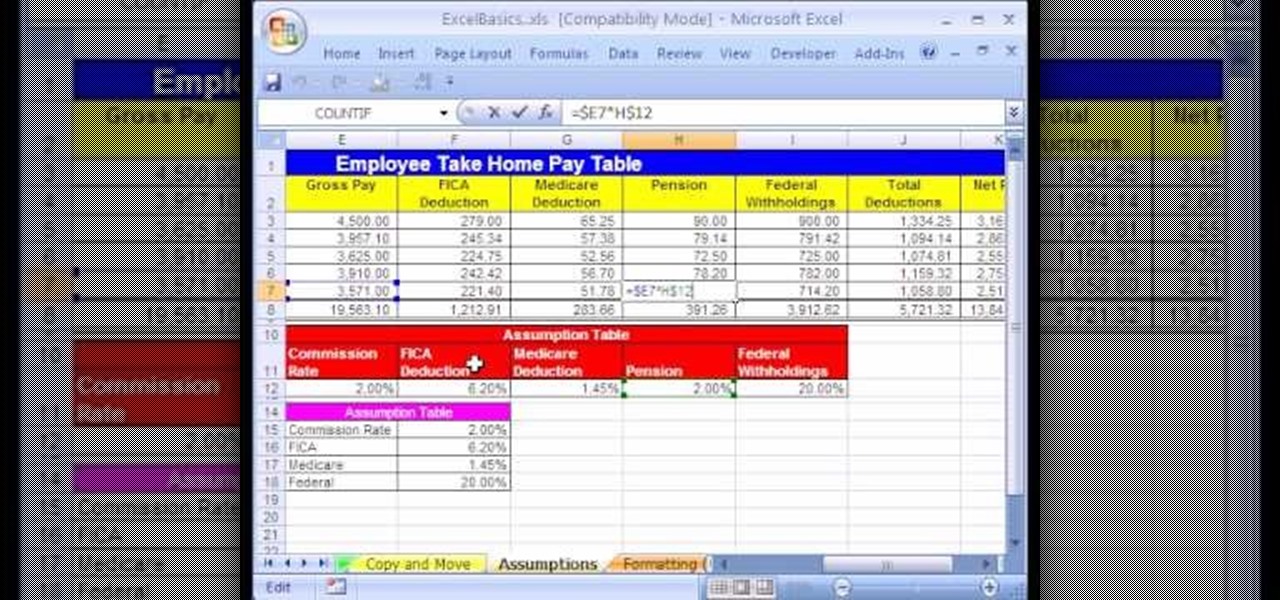
In this Excel basic video the instructor shows how to setup a spreadsheet and use cell references. Cell references are used in Excel to refer to other cells in a formula. When a formula contains data based on the cell reference the formula auto generates the result each time the value in the cell changes as the formula contains only the reference to the cell and not the actual data present in it. In this video the tutor goes on and shows how to write a few basic formulas using cell references...

Want to get more from the raw data you're entering into your Excel worksheets? Now you can create two distinct pivot tables in Excel comparing, for example, monthly and quarterly sales data. Not familiar with the pivot table? Pivot tables summarize spreadsheet input by counting, sorting and totaling data within a list and providing at-a-glance computations within the same sheet. Become an expert on the subject within 5 minutes and 24 seconds by following easy to understand instructions narrat...

MotionTraining gives an overview for using Microsoft Excel for beginners in this video. This video gives a rundown and overview of the basics of this spreadsheet program: from typing in the columns and rows, adding dollar signs to data, and how to make basic calculations. MotionTraining will show how to make text stand out with bold and italics, adding colors to your data, and how to make a grid appear during the printing process. Creating various charts of the data in the spreadsheet is also...

In this video tutorial, Chris Pels will show how to share data in between JavaScript and server-side code by using a hidden field in an ASP.NET page. Next, learn how to use the RegisterHiddenField method in server-side code to programmatically create a hidden field on the client. In addition, see how to programmatically create a HiddenField server control for sharing data on an ASP.NET page. Finally, use the RegisterArrayDeclaration method to create a container in server code for storing mult...

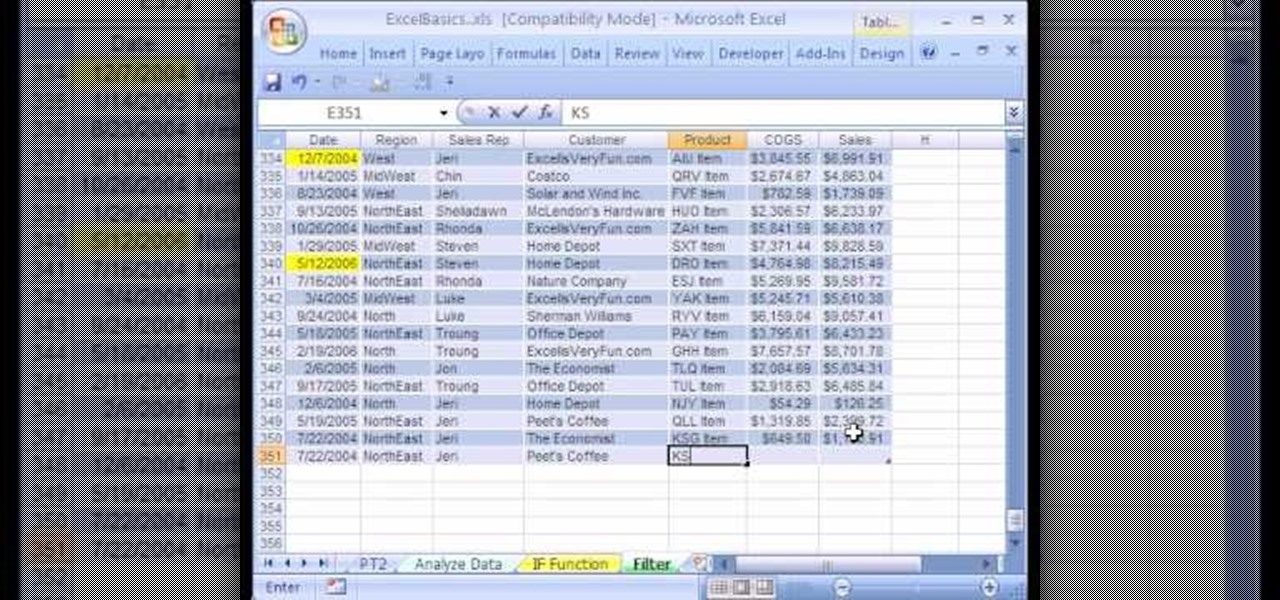
We're on sheet, tab, filter. We want to talk about filter, but we also want to talk about an Excel table or list. It is simply a data set with field names at the top, records in rows, no blanks anywhere and no other data sets touching this data set. When we convert to a table, it does a lot of amazing things. The new keyboard shortcut is "Ctrl T". If data is set up correctly, it will work. Click Ok. You can build a function based on a column of data, i.e. "Alt =" which is the shortcut for sum...

In this tutorial series Mike Lively shows how to convert Wordpress into the Adobe Flex 3 application Flexpress.

Data makes the world go round. It has gotten to the point that it's considered the most valuable resource, perhaps even more important than oil. Businesses use data to collect critical information about their users and improve their services; governments utilize it to improve things like public transportation; doctors analyze data to find more ways to save lives.

Data analytics is crucial to the operations of every modern business. This trend is going to continue: in three years, 71% of global enterprises predict a rapid increase in data analytics. Experienced professionals that can project manage data initiatives are in high demand.

We know our Null Byte readers would like to see some iPhone-hacking scenarios on the site soon, but until we get some of those up, we understand that some of you actually use an iPhone as your primary phone. If that's you, and you would like an easier way to get information from point A (your iPhone) to point B (your computer) and vice versa, there's an all-in-one tool that can help.


