Data makes the world go round. It has gotten to the point that it's considered the most valuable resource, perhaps even more important than oil. Businesses use data to collect critical information about their users and improve their services; governments utilize it to improve things like public transportation; doctors analyze data to find more ways to save lives.

You don't need to work in the accounting department of a Fortune 500 company to use and appreciate Microsoft Excel. Although primarily associated with a wide variety of functions pertaining to accounting and finance, Excel is actually an incredibly powerful and multifaceted platform that can be found at the heart of many large-scale analytics environments.

The rumor that the iPhone 8 will ship with 3D camera system is not a new one, but a new analysis by Morgan Stanley's Charlie Chan lends credibility to the speculation. Now, it appears more likely than ever that Apple's next iPhone will ship with 3D capabilities, increasing potential for AR and VR integration in the future.

YouTube and the National Football League have announced a partnership that should greatly improve the online experience for gridiron fans. In a posting on their official blog, YouTube outlines a deal that will bring NFL video clips to their immensely popular site while bumping official NFL pages up to the top of relevant Google search results.

Analysis of photographs and social connections can be a huge component of social engineering. Understanding who a person is, as well as who they know, can establish links within a company. This information could be used by hackers to execute elaborate social engineering attacks.

Welcome back, my aspiring hackers and those who want to catch my aspiring hackers! As most of you know, this series on digital forensics is inspired by the motivation to keep all of you all out of custody. The more you know about the techniques used by law enforcement and forensic investigators, the better you can evade them.

A couple weeks ago, GM's Cruise Automation released a remarkable self-driving video from the streets of San Fransisco that Driverless analyzed in detail. And now they've just released a new one giving more insight into their growing mastery of the complex roads in San Francisco, specifically, the Potrero Hill and Mission Dolores neighborhoods.

The mention of Zika can strike fear in the hearts of pregnant women. With infections increasing around the world, including in the US, researchers are fighting the clock to figure out how the virus can have such horrific effects in some people.

Most users don't realize how much valuable data is in their network traffic. With a few simple tools, an attacker can quickly pick out cookies, passwords, and DNS queries from a macOS device as it covertly streams the victim's network traffic to the attacker's system. Here, we will cover two methods for analyzing packets flowing from a Mac.

As was mentioned by the great OTW last week, TOR, aka The Onion Router, has had its integrity attacked by the NSA. In an attempt to reduce the anonymity granted by the service, the NSA has opened a great many nodes of their own. The purpose is presumably to trace the origin of a communication by compromising some entrance and exit nodes. Once both are compromised, it is much easier to correlate traffic with a particular individual.

It's always a big deal when the company that makes Android releases a new phone. Google's Pixel series has made a name for itself in three short years behind its camera prowess, but now it's time to start competing with the major players. That said, Google should like how their Pixel 4 and 4 XL stack up against the iPhones and Galaxies of the world.

Regression functions are a vital part of statistical analysis of populations, and if you're involved in business, science, or nearly any academic field you should understand how it works. This series of videos will show you how standard regression functions, ANOVA, ordinary least squares, and everything else you need to know.

Whether you're new to Adobe After Effects or a seasoned digital film professional after a general overview of CS5's most vital new features, you're sure to be well served by this official video tutorial from the folks at Adobe TV. In it, you'll learn how to turn spoken dialogue into searchable text either by synchronizing content with your Adobe Story script, or by using reference scripts that are optimized for your content. Also see how to accelerate editing by marking in and out points in t...

Learn how to prevent fallying prey to cmmon careless errors when doing fiscal analysis in MS Excel. Whether you're new to Microsoft's popular digital spreadsheet application or a seasoned business professional just looking to better acquaint yourself with the Excel 2010 workflow, you're sure to be well served by this video tutorial. For more information, including step-by-step instructions, take a look.

Unlock the "Closer Analysis: Hidden Intel" trophy in Call of Duty: Black Ops! This achievement is won by finding the hidden intelligence documents in Missions 1, 2 & 4.

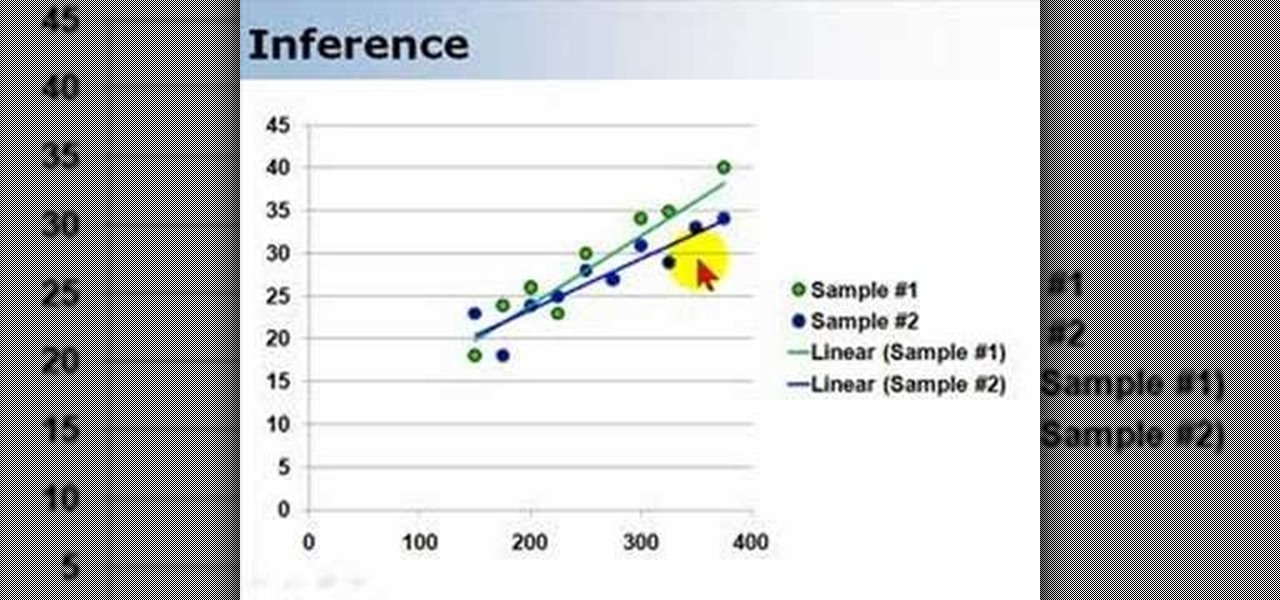
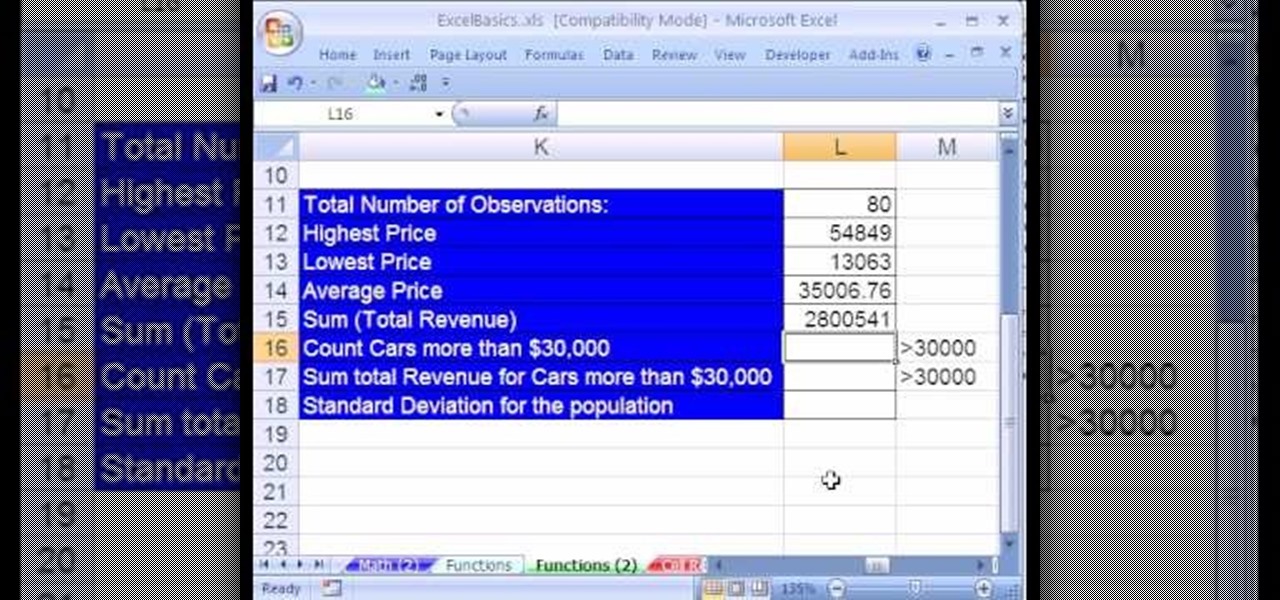
Whether you're interested in learning Microsoft Excel from the bottom up or just looking to pick up a few tips and tricks, you've come to the right place. In this tutorial from everyone's favorite digital spreadsheet guru, ExcelIsFun, the nth installment in his "Highline Excel Class" series of free video Excel lessons, you'll learn how to do basic statistical analysis in Excel. Specifically, this video covers the following topics:

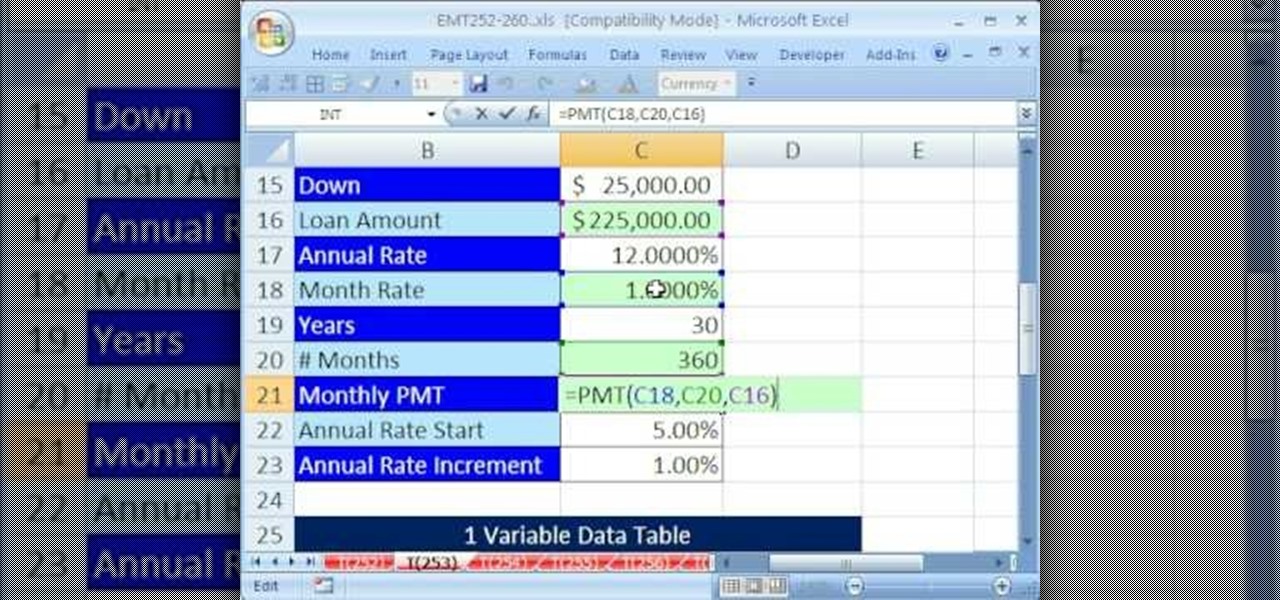
New to Microsoft Excel? Looking for a tip? How about a tip so mind-blowingly useful as to qualify as a magic trick? You're in luck. In this MS Excel tutorial from ExcelIsFun, the 253rd installment in their series of digital spreadsheet magic tricks, you'll learn how to use a data table for what-if analysis. You'll also learn about the PMT and see the formula equivalent to a data table.

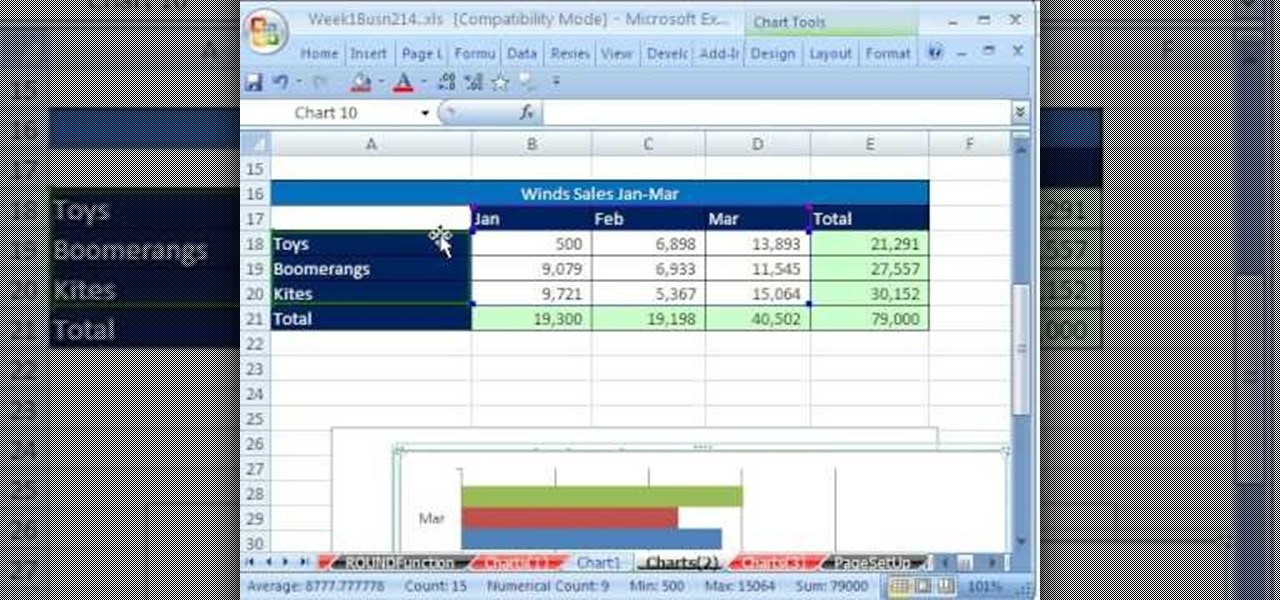
Whether you're interested in learning Microsoft Excel from the bottom up or just looking to pick up a few tips and tricks, you're in the right place. In this tutorial from everyone's favorite digital spreadsheet guru, ExcelIsFun, the 5th installment in his "Highline Excel Class" series of free video Excel lessons, you'll learn how to create seven types of charts — X-Y scatter diagrams, pie charts, column charts, bar charts, stacked bar charts, line charts, and column and line chart combined. ...

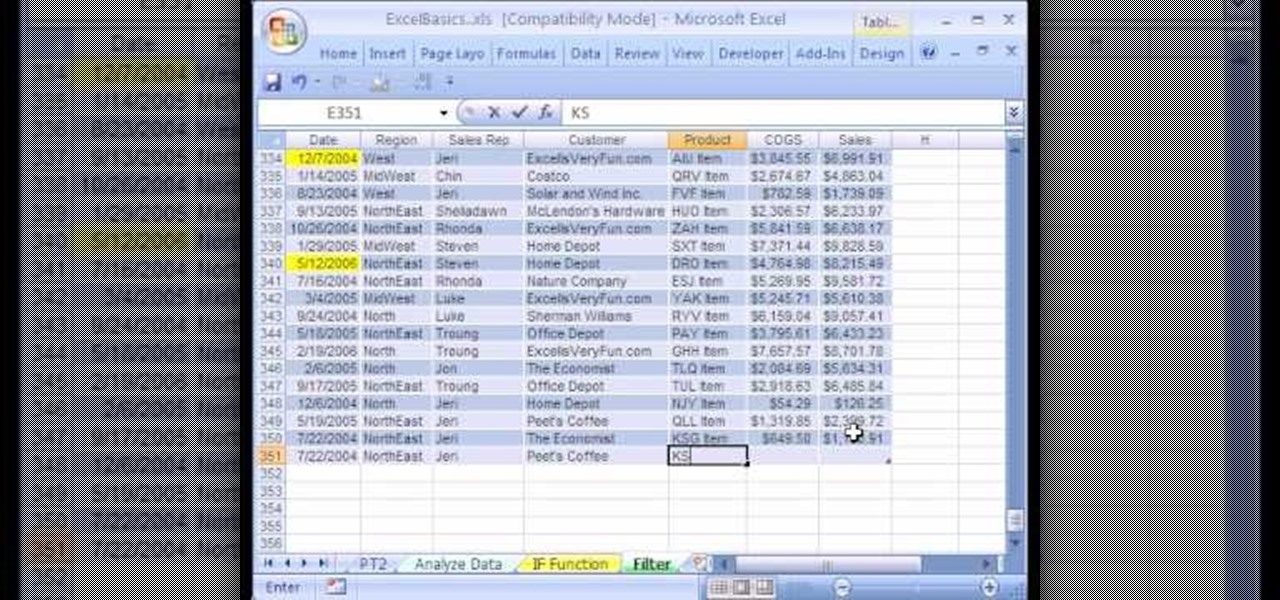
We're on sheet, tab, filter. We want to talk about filter, but we also want to talk about an Excel table or list. It is simply a data set with field names at the top, records in rows, no blanks anywhere and no other data sets touching this data set. When we convert to a table, it does a lot of amazing things. The new keyboard shortcut is "Ctrl T". If data is set up correctly, it will work. Click Ok. You can build a function based on a column of data, i.e. "Alt =" which is the shortcut for sum...

Create a table with sales data with this video.

Analyzing a play can help actors, directors, or scholars to understand everything about a given play. Learn how to write a play analysis in this free theater video from a college professor.

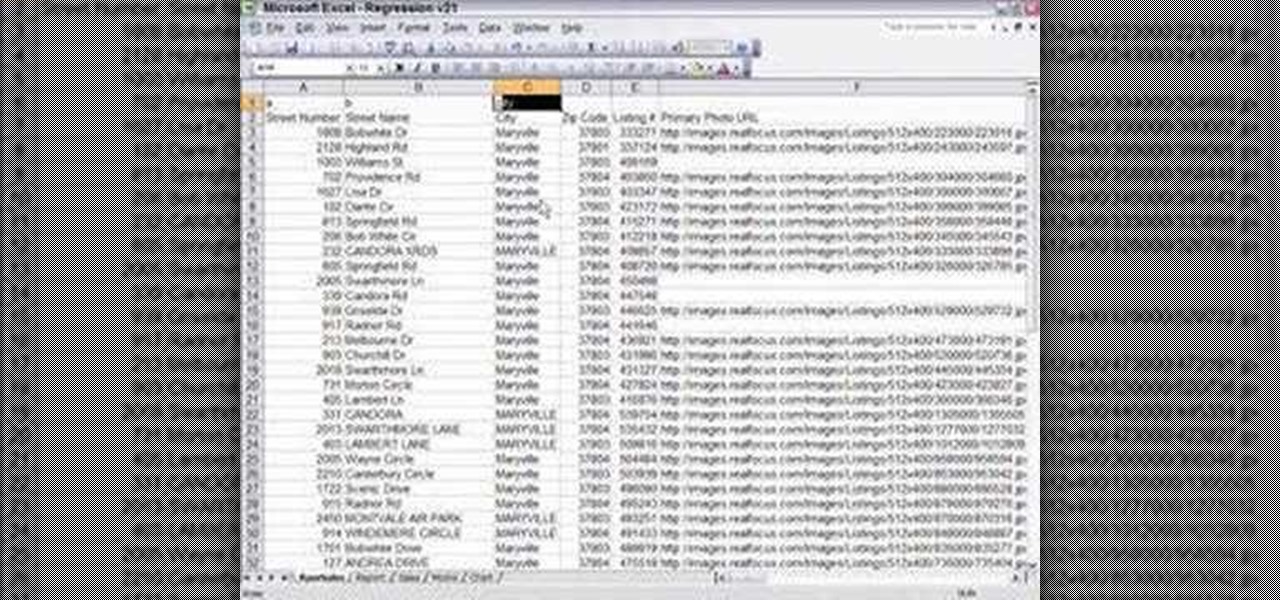
Are you in real estate? Take a look at this instructional video and learn how to run your excel spreadsheet over a regression analysis module. An appraiser who's appraising a house decides to run a multiple regression analysis as an addition to the direct sales comparison approach. The spreadsheet used in this tutorial was written in excel, but could be rewritten in another format. The spreadsheet was exported from an MLS. Once the excel sheet is downloaded, the appraiser will open up the reg...

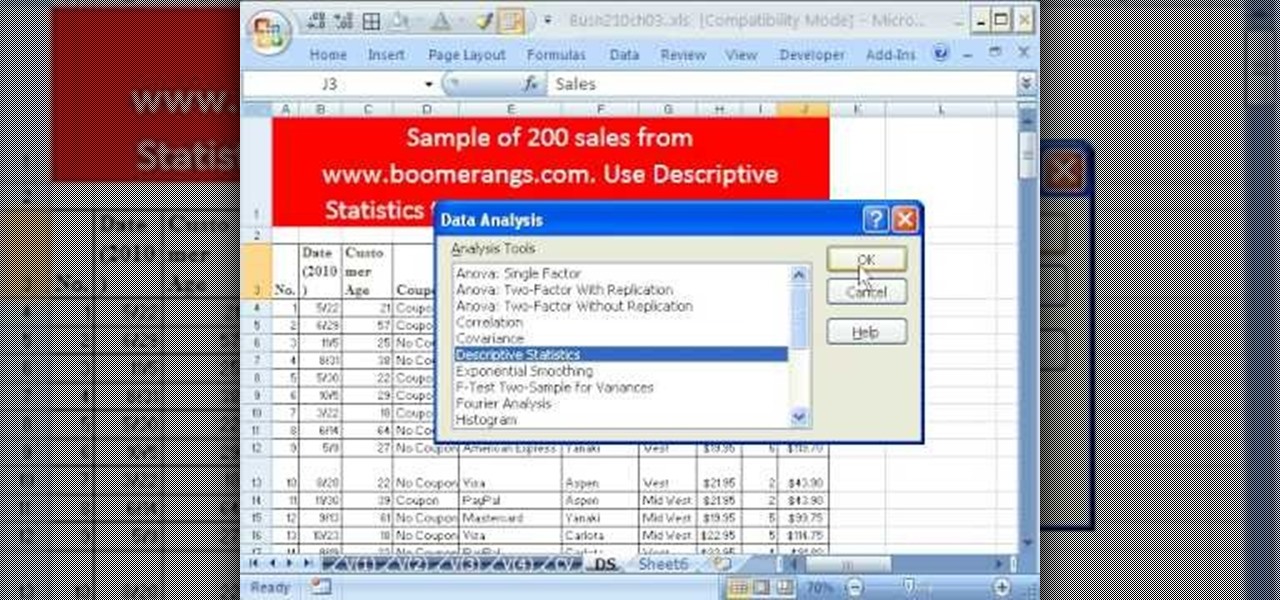
If you use Microsoft Excel on a regular basis, odds are you work with numbers. Put those numbers to work. Statistical analysis allows you to find patterns, trends and probabilities within your data. In this MS Excel tutorial from everyone's favorite Excel guru, YouTube's ExcelsFun, the 43rd installment in his "Excel Statistics" series of free video lessons, you'll learn how to use the Excel Data Analysis add-in descriptive statistics tool.

If you use Microsoft Excel on a regular basis, odds are you work with numbers. Put those numbers to work. Statistical analysis allows you to find patterns, trends and probabilities within your data. In this MS Excel tutorial from everyone's favorite Excel guru, YouTube's ExcelsFun, the 13th installment in his "Excel Statistics" series of free video lessons, you'll learn how to install the Excel 2007 Data Analysis add-in.

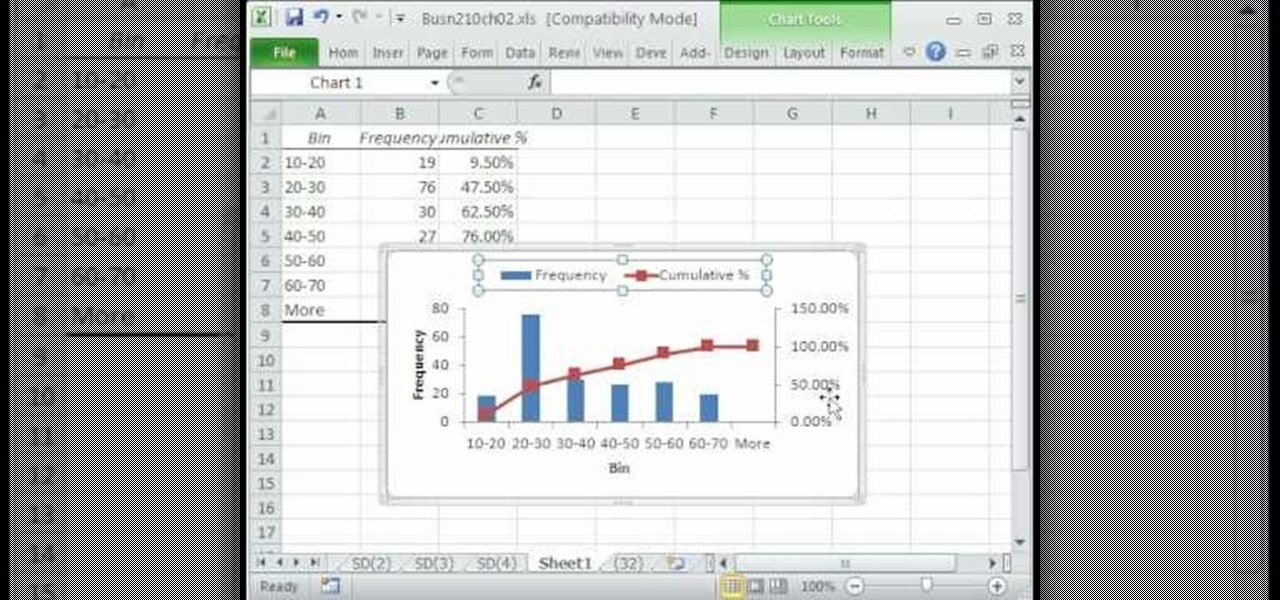
A histogram is a summary graph showing a count of data points that fall in various ranges. Histograms are used in statistics and other forms of mathematics. In this video, learn how to create your own histogram using data analysis on the computer. This tutorial will show you how to create a frequency distribution, a cumulative frequency distribution, a histogram chart and an ogive chart with the data analysis add-in.

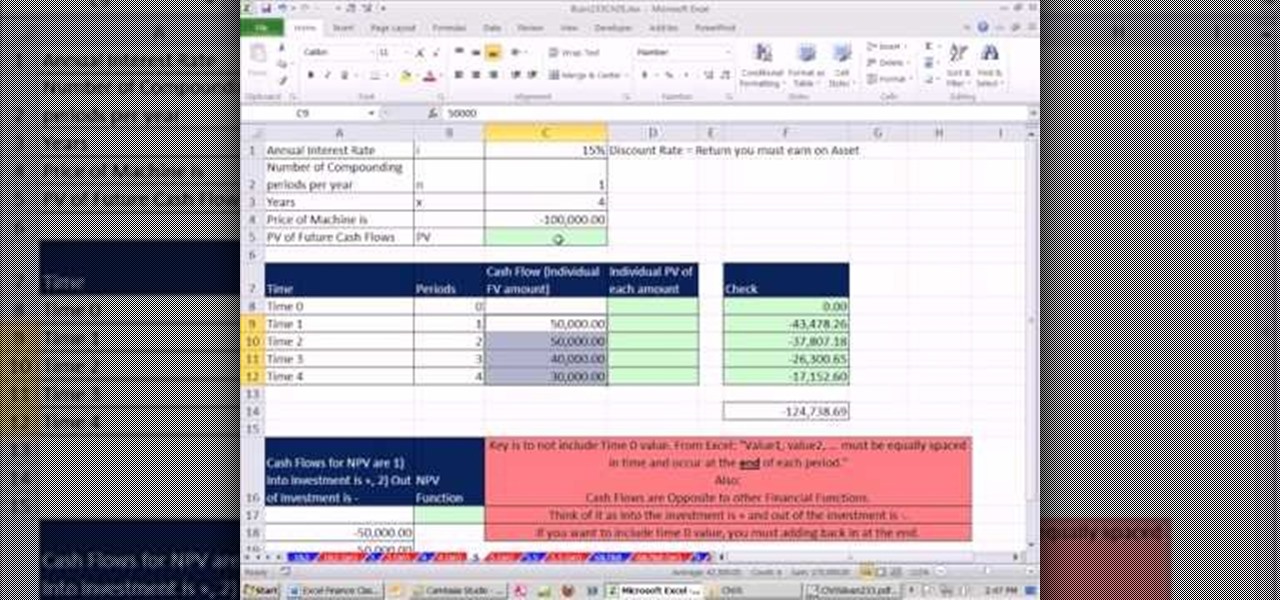
As you might guess, one of the domains in which Microsoft Excel really excels is finance math. Brush up on the stuff for your next or current job with this how-to. In this tutorial from everyone's favorite digital spreadsheet guru, YouTube's ExcelIsFun, part of his "Excel Finance Class" series of free video lessons, you'll learn how to use the PV and PMT functions together to do asset valuation using discounted cash flow analysis.

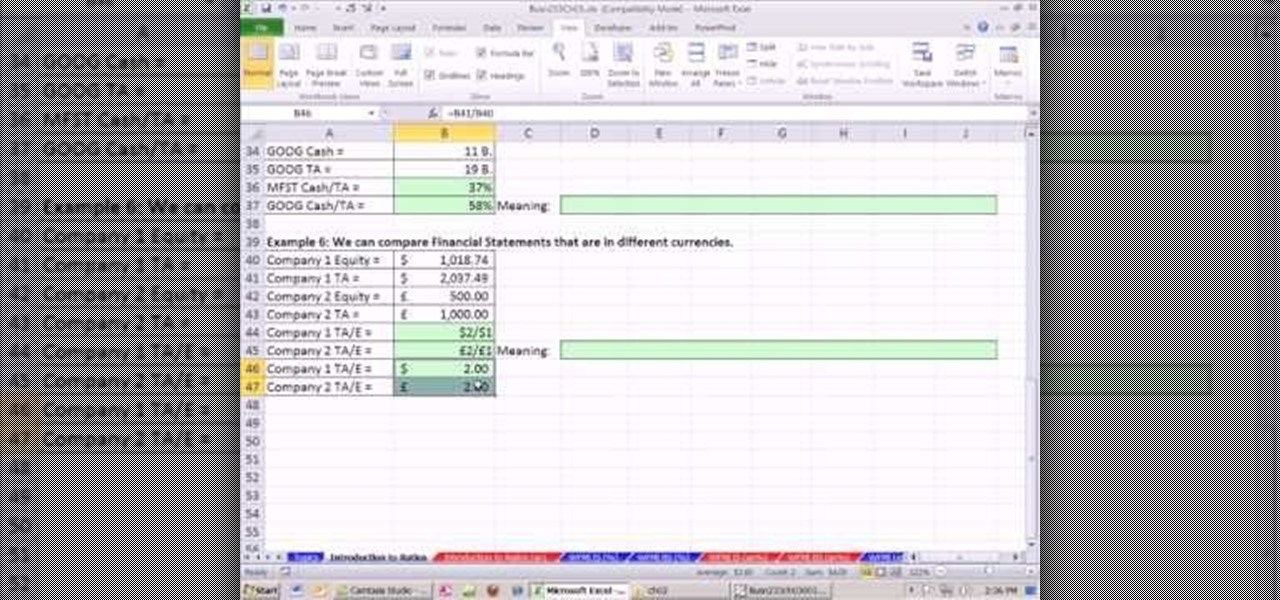
As you might guess, one of the domains in which Microsoft Excel really excels is finance math. Brush up on the stuff for your next or current job with this how-to. In this tutorial from everyone's favorite digital spreadsheet guru, YouTube's ExcelIsFun, the 17th installment in his "Excel Finance Class" series of free video lessons, you'll learn how to perform simple financial ratio analysis.

Interested in using Google's Page Speed performance analysis application? This clip will show you how it's done. It's simple! So simple, in fact, that this home-computing how-to can present a complete, step-by-step overview of the process in just over four minutes. For more information, including complete, step-by-step instructions, take a look.

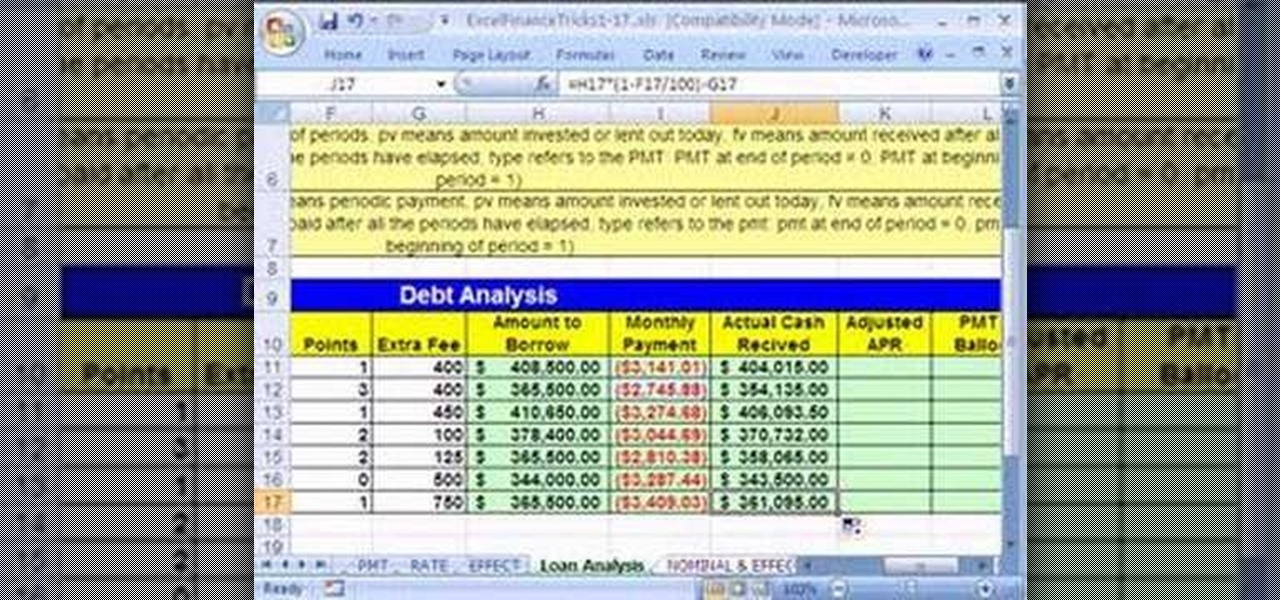
As you might guess, one of the domains in which Microsoft Excel really excels is finance math. Brush up on the stuff for your next or current job with this how-to. In this tutorial from everyone's favorite digital spreadsheet guru, YouTube's ExcelIsFun, the 18th installment in his "Excel Finance Trick" series of free video lessons, you'll learn how to use the PMT and RATE functions for a complete debt/loan analysis.

This chess tutorial from Grandmaster Alexandra Kosteniuk is a perfect example of Retrograde Analysis.

Unlock the "Closer Analysis: Hidden Intel" trophy in Call of Duty: Black Ops! This achievement is won by finding the hidden intelligence documents in Missions 11, 12 & 13.

Unlock the third "Closer Analysis: Hidden Intel" trophy in Call of Duty: Black Ops! This achievement is won by finding the hidden intelligence documents in Missions 14 & 15.

This video is based on a chemistry experiment. This video is going to explain to us how to use gravimetric analysis in order to analyze sulfuric acid. This experiment should not be done for those who do not have a fundamental knowledge of chemical compounds, reactions and chemical safety. He explains first what he is about to do before he does it. Sulfuric acid is acidic and can be toxic if ingested or in contact with the eyes. Take extreme care with this experiment.

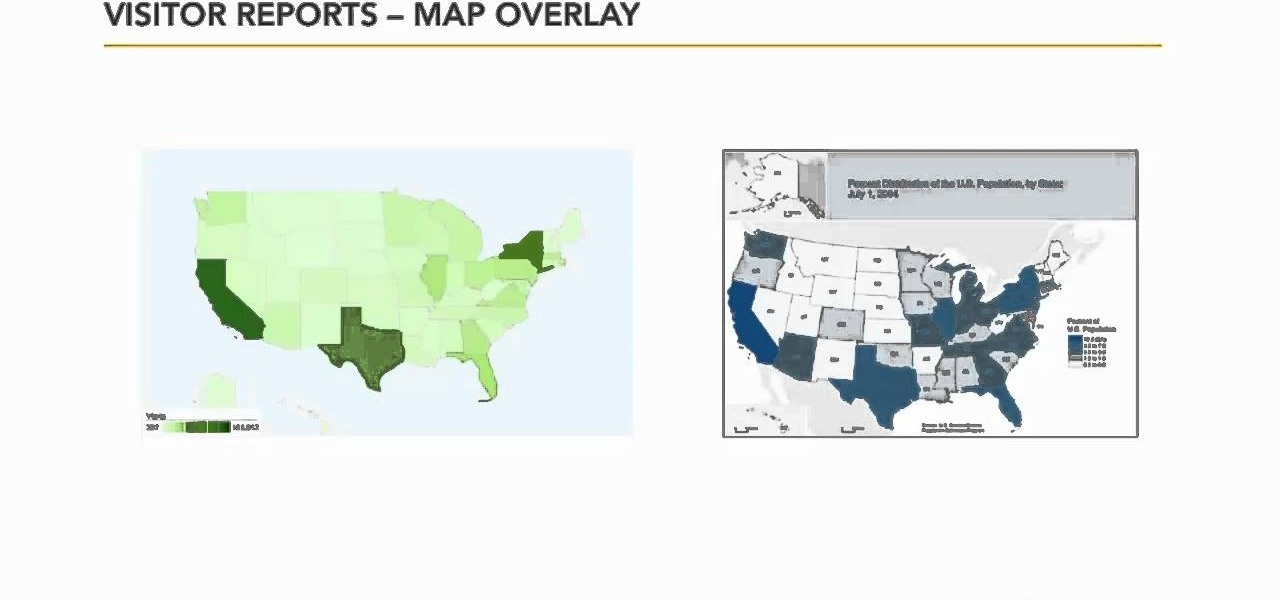
In this video tutorial, we learn how to use the Map Overlay feature when using the Google Analytics web tracking service. Whether you're new to Google's popular web analytics platform or a seasoned pro merely looking to pick up a few new tips and tricks, you're sure to be well served by this free video tutorial from Lynda.

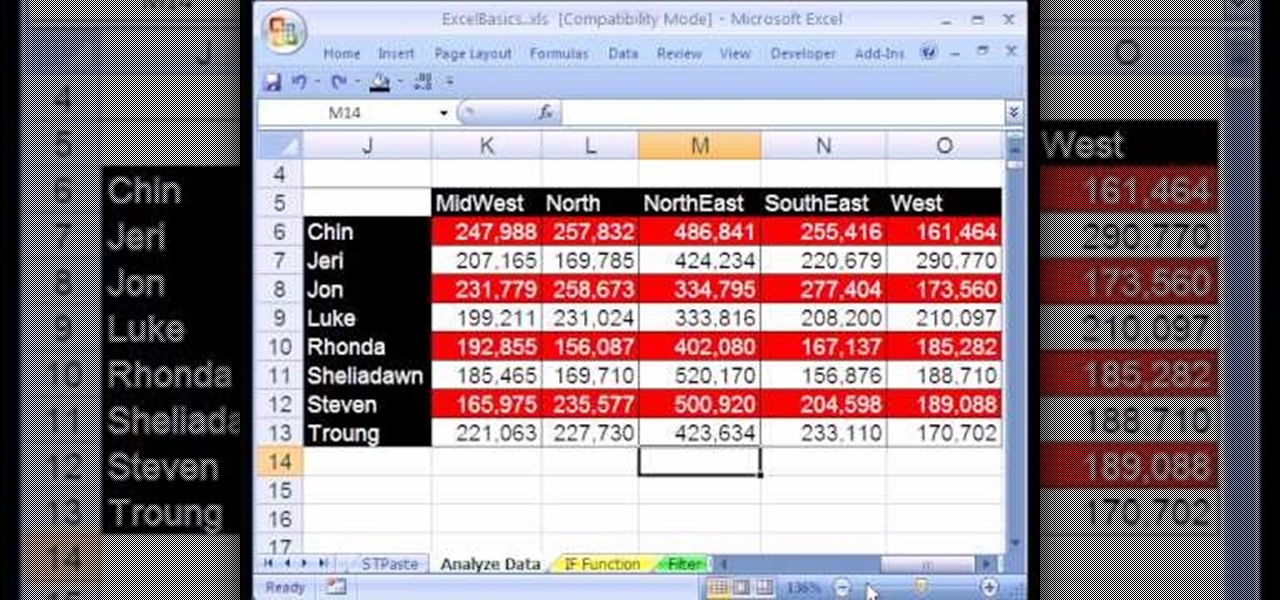
If you're looking to learn how to use Microsoft Excel, a video series from digital spreadsheet guru ExcelIsFun is a great place to start. But which of his many series should you choose? The one titled "Excel Basics," that's which! In this free video MS Excel lesson, the 20th installment in said basics series, you'll learn how to use pivot tables (PivotTables) to analyze and summarize data.

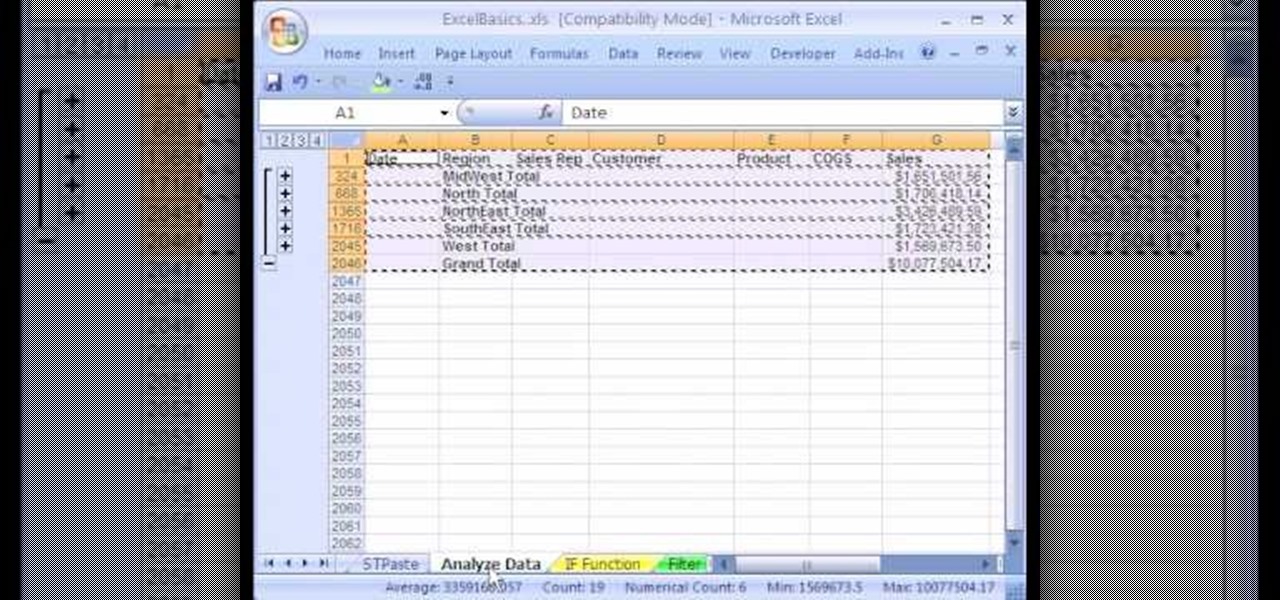
1. The following instruction describes how to generate sub totals in Microsoft Excel Sheet. 2. Take Region as a Primary column and Sales Rep as a Secondary Column. 3. First method to sort: Select a cell in Region and goto Data select A to Z. 4. Second method to sort: Select a cell in Region and Right click and select Sort A to Z 5. Then click a cell in Region and select Data->OutLine->SubTotal 6. In the SubTotal Window select 1.Each Change in: Region 2.Use function:Sum 3.Add subTotal to:Sales...

In this scientific video tutorial, undergraduate students in a forensic chemistry lab demonstrate how to perform gunshot residue analysis (GSR). Learn how to perform gun shot residue analysis (GSR)! Just like in CSI.

Dr. Keith Johnson shows how to correctly sample a large round bale for forage analysis Learn how to determine the nutritional content of the livestock feed to make sure that the dietetic needs of the farm animals being fed are being met.
Dimensional analysis is the process of analyzing units to decide which conversion factors to use. You can use this in real life if you want to figure your gas mileage. Here is a link to a website to help you Dimensional Analysis definitions | Quizlet.


