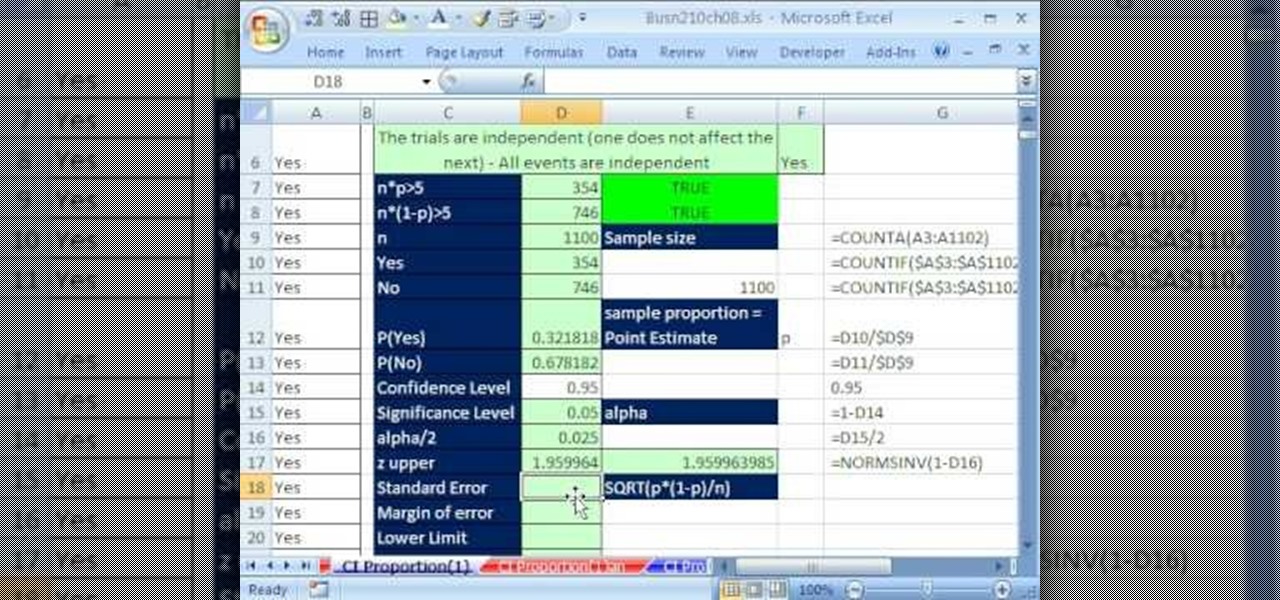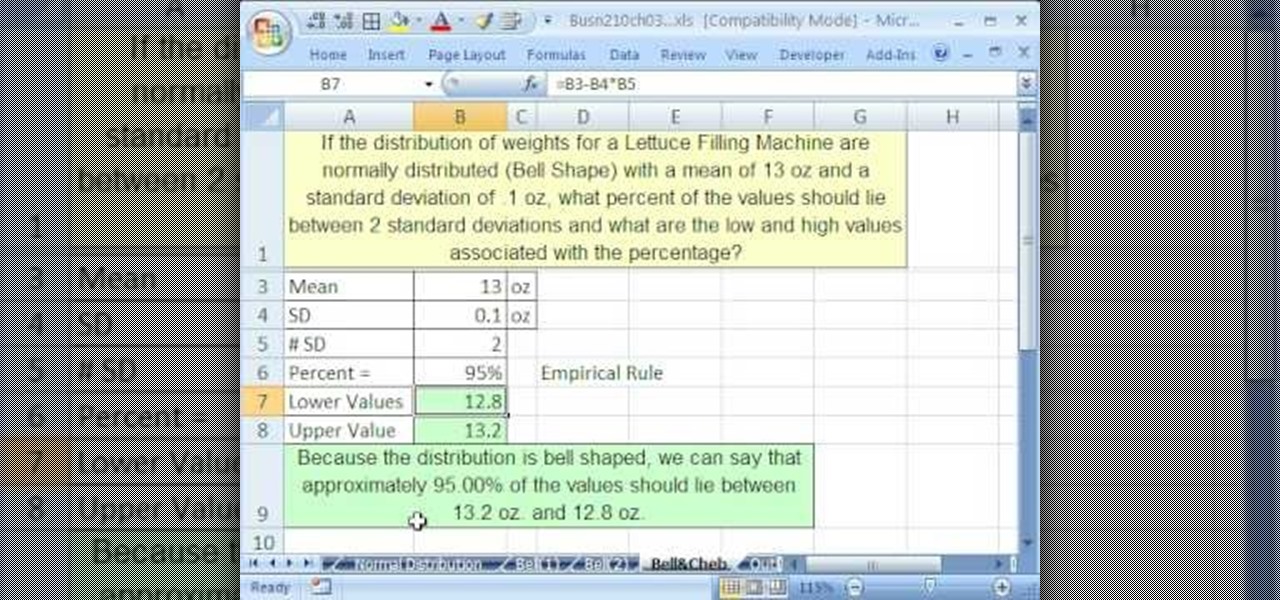
If you use Microsoft Excel on a regular basis, odds are you work with numbers. Put those numbers to work. Statistical analysis allows you to find patterns, trends and probabilities within your data. In this MS Excel tutorial from everyone's favorite Excel guru, YouTube's ExcelsFun, the 48th installment in his "Excel Statistics" series of free video lessons, you'll see comparison of Chebyshev's Theorem and the Empirical Rule (bell curve) and learn when to apply which.
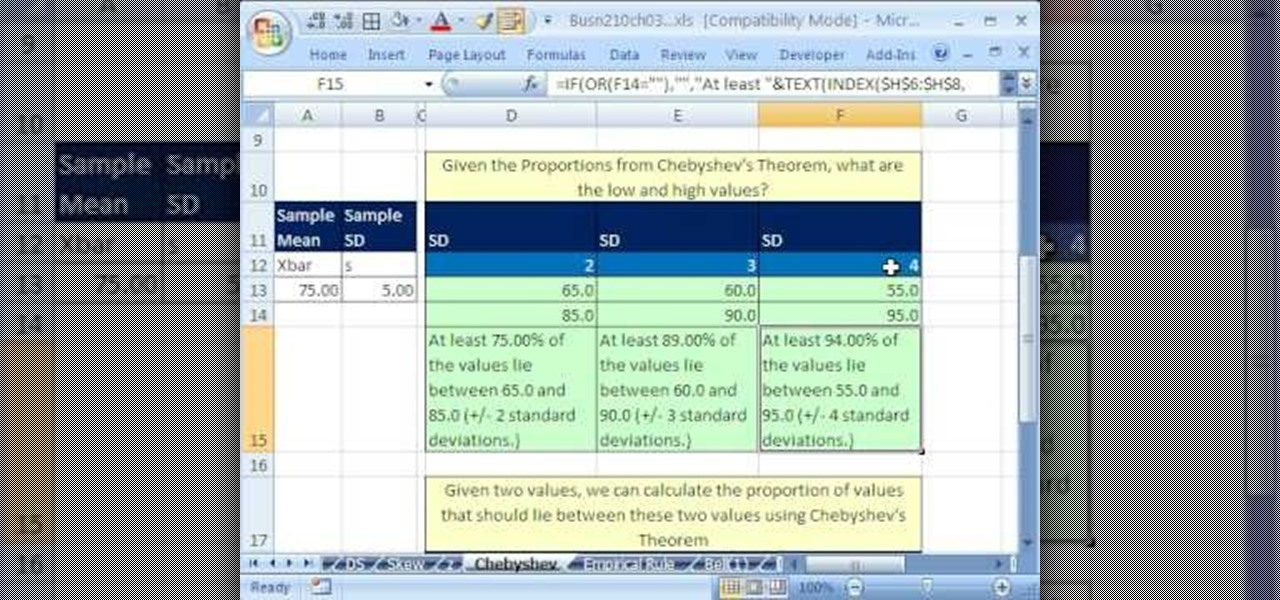
If you use Microsoft Excel on a regular basis, odds are you work with numbers. Put those numbers to work. Statistical analysis allows you to find patterns, trends and probabilities within your data. In this MS Excel tutorial from everyone's favorite Excel guru, YouTube's ExcelsFun, the 46th installment in his "Excel Statistics" series of free video lessons, you'll learn about Chebyshev's Theorem and how to apply it in three different ways.
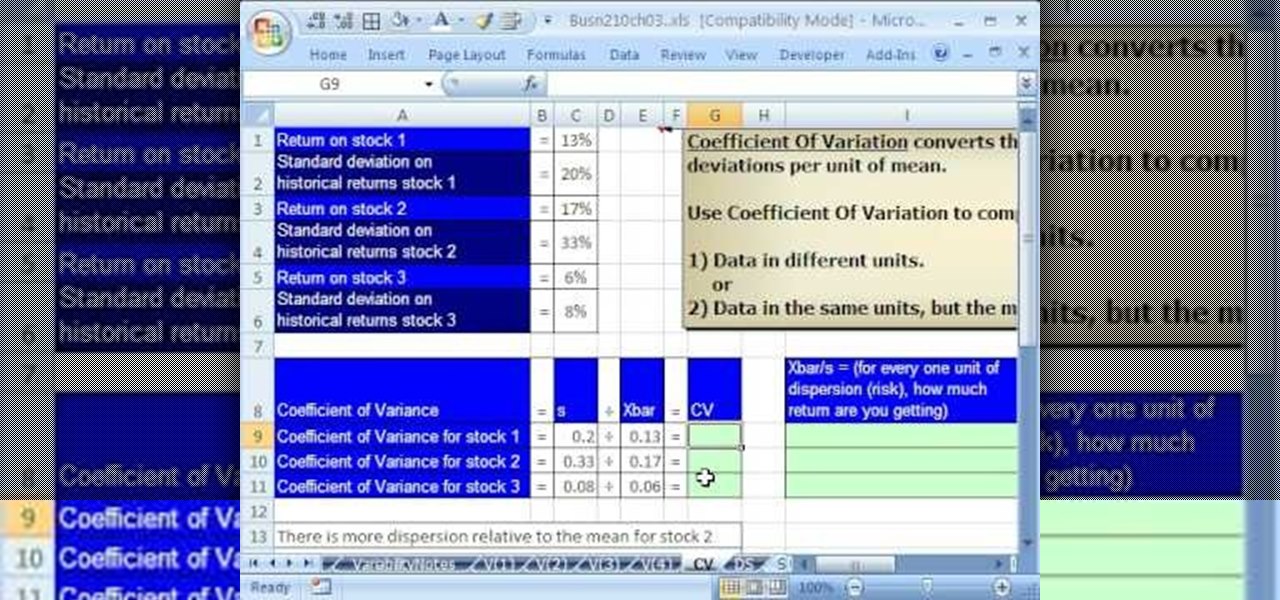
If you use Microsoft Excel on a regular basis, odds are you work with numbers. Put those numbers to work. Statistical analysis allows you to find patterns, trends and probabilities within your data. In this MS Excel tutorial from everyone's favorite Excel guru, YouTube's ExcelsFun, the 42nd installment in his "Excel Statistics" series of free video lessons, you'll learn how to calculate the coefficient of variation.
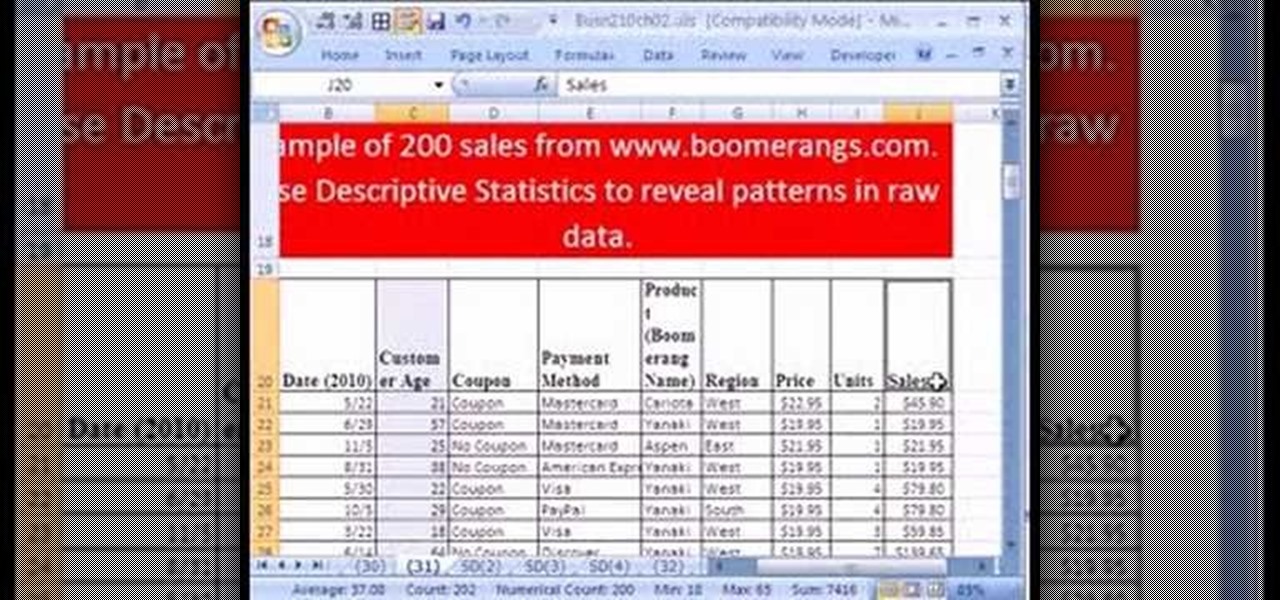
If you use Microsoft Excel on a regular basis, odds are you work with numbers. Put those numbers to work. Statistical analysis allows you to find patterns, trends and probabilities within your data. In this MS Excel tutorial from everyone's favorite Excel guru, YouTube's ExcelsFun, the 30th installment in his "Excel Statistics" series of free video lessons, you'll learn how to create a scatter diagram for 2 quantitative variables.
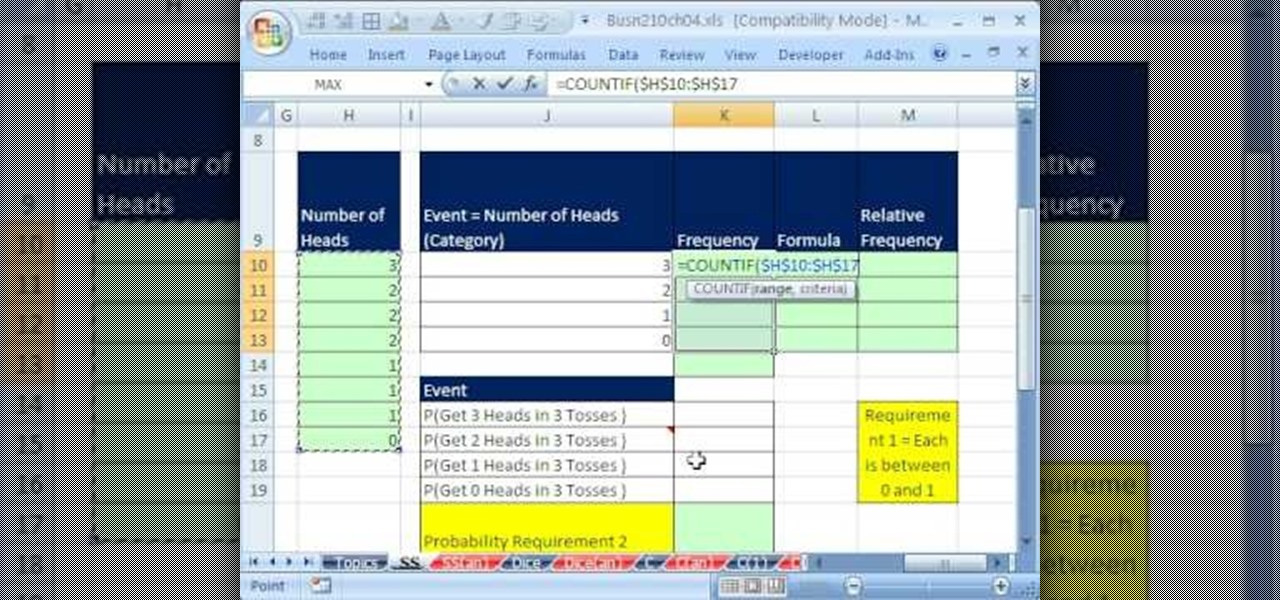
If you use Microsoft Excel on a regular basis, odds are you work with numbers. Put those numbers to work. Statistical analysis allows you to find patterns, trends and probabilities within your data. In this MS Excel tutorial from everyone's favorite Excel guru, YouTube's ExcelsFun, the 51st installment in his "Excel Statistics" series of free video lessons, you'll learn how to understand, work with and find simple probabilities in Microsoft Office Excel.
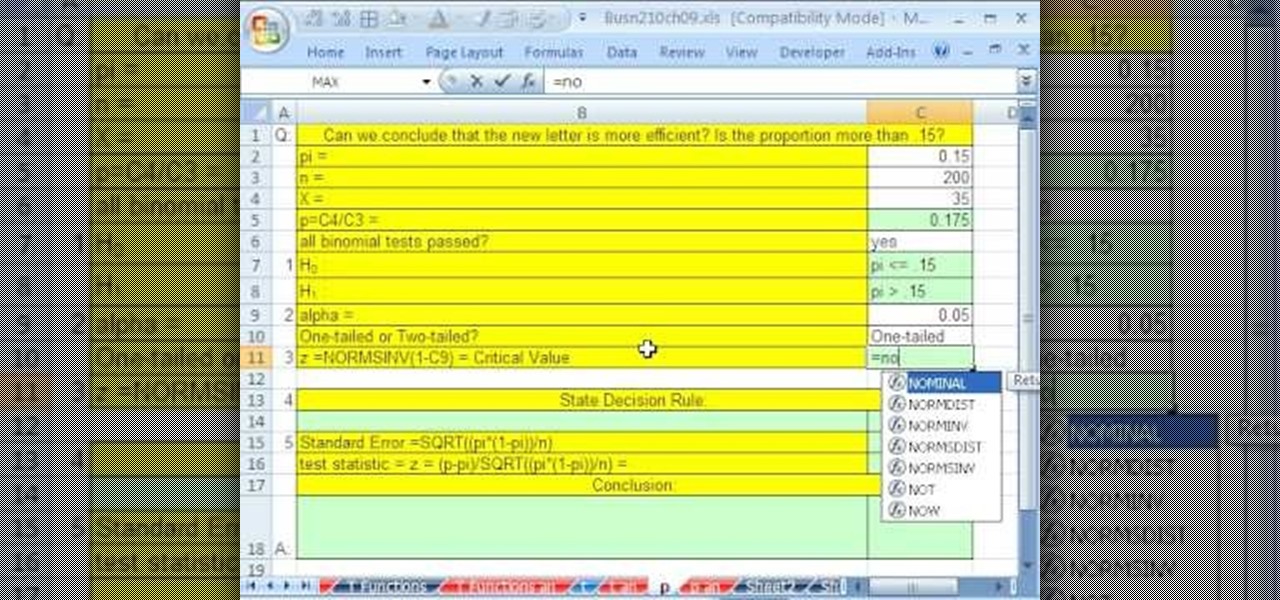
If you use Microsoft Excel on a regular basis, odds are you work with numbers. Put those numbers to work. Statistical analysis allows you to find patterns, trends and probabilities within your data. In this MS Excel tutorial from everyone's favorite Excel guru, YouTube's ExcelsFun, the 93rd installment in his "Excel Statistics" series of free video lessons, you'll learn how to use the NORMSINV and NORMSDIST functions to complete a hypothesis test about a population proportion.

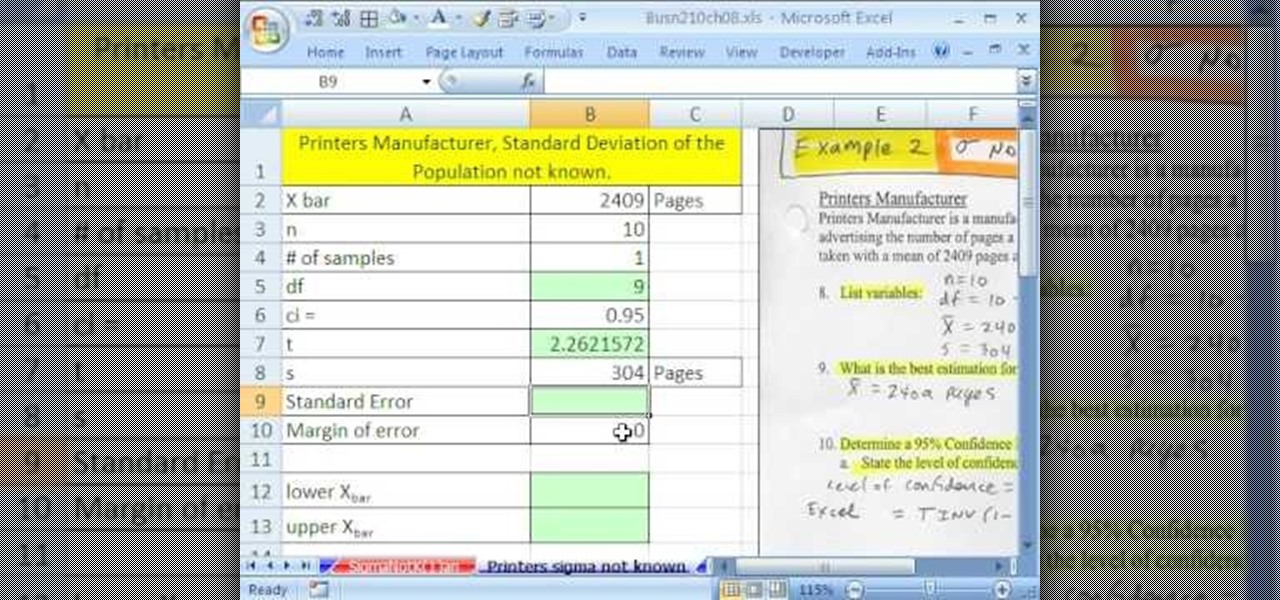
If you use Microsoft Excel on a regular basis, odds are you work with numbers. Put those numbers to work. Statistical analysis allows you to find patterns, trends and probabilities within your data. In this MS Excel tutorial from everyone's favorite Excel guru, YouTube's ExcelsFun, the 83rd installment in his "Excel Statistics" series of free video lessons, you'll learn how to construct confidence intervals when the sigma (population standard deviation) in NOT known using the TINV function.

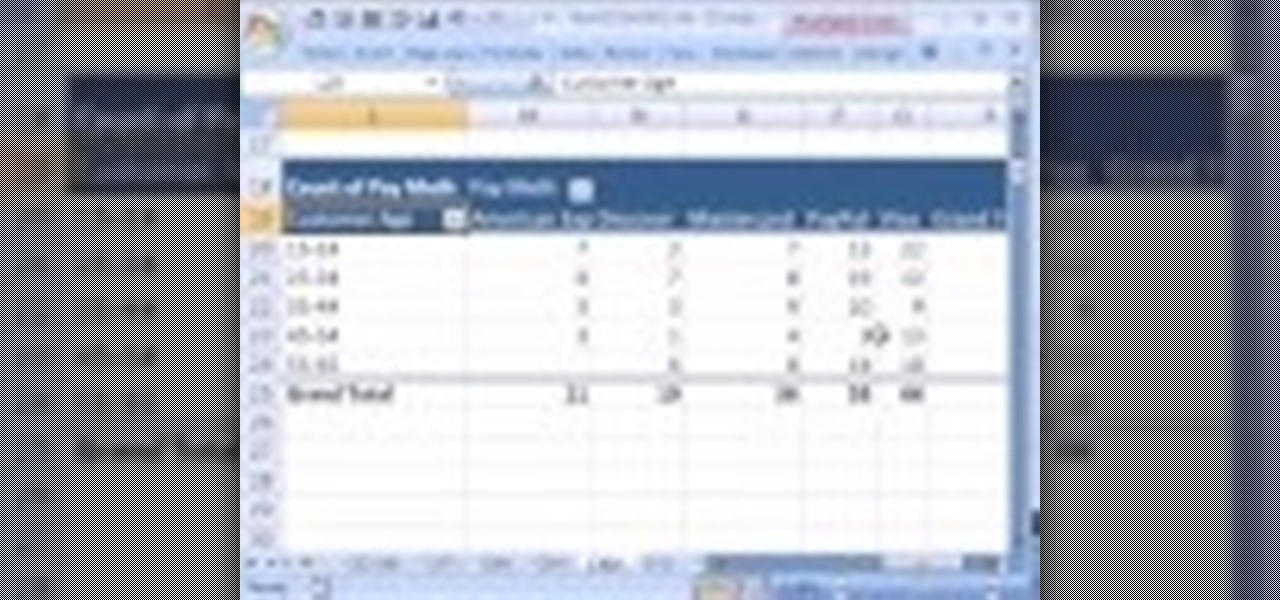
If you use Microsoft Excel on a regular basis, odds are you work with numbers. Put those numbers to work. Statistical analysis allows you to find patterns, trends and probabilities within your data. In this MS Excel tutorial from everyone's favorite Excel guru, YouTube's ExcelsFun, the 29th installment in his "Excel Statistics" series of free video lessons, you'll learn how to create quantitative data cross tabulation using a pivot table (PivotTable).

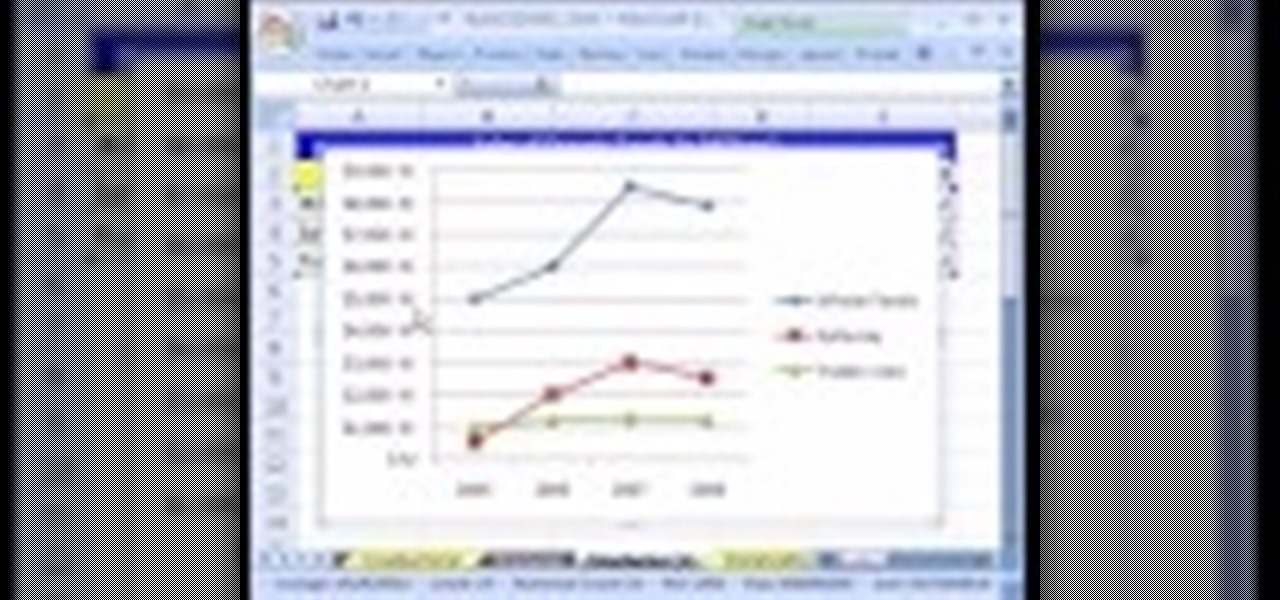
If you use Microsoft Excel on a regular basis, odds are you work with numbers. Put those numbers to work. Statistical analysis allows you to find patterns, trends and probabilities within your data. In this MS Excel tutorial from everyone's favorite Excel guru, YouTube's ExcelsFun, the 11th installment in his "Excel Statistics" series of free video lessons, you'll learn how to work with, and create charts for, cross-sectional and time-series data.

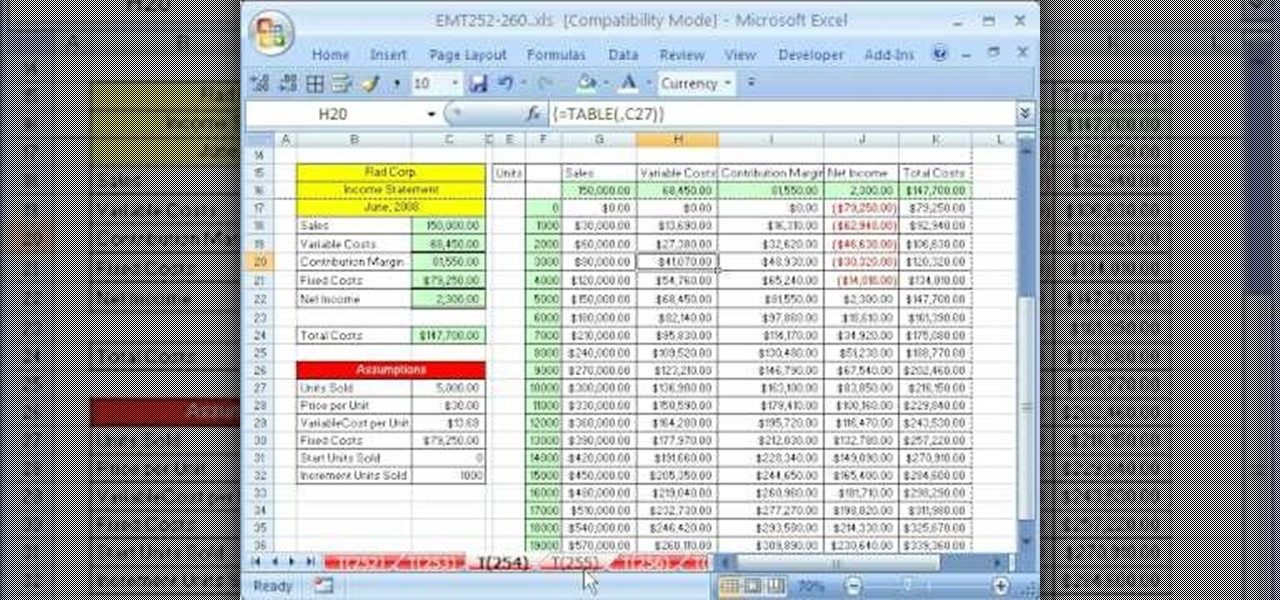
New to Microsoft Excel? Looking for a tip? How about a tip so mind-blowingly useful as to qualify as a magic trick? You're in luck. In this MS Excel tutorial from ExcelIsFun, the 254th installment in their series of digital spreadsheet magic tricks, you'll learn how to do contribution margin income statement analysis across various units using a one-variable data table.

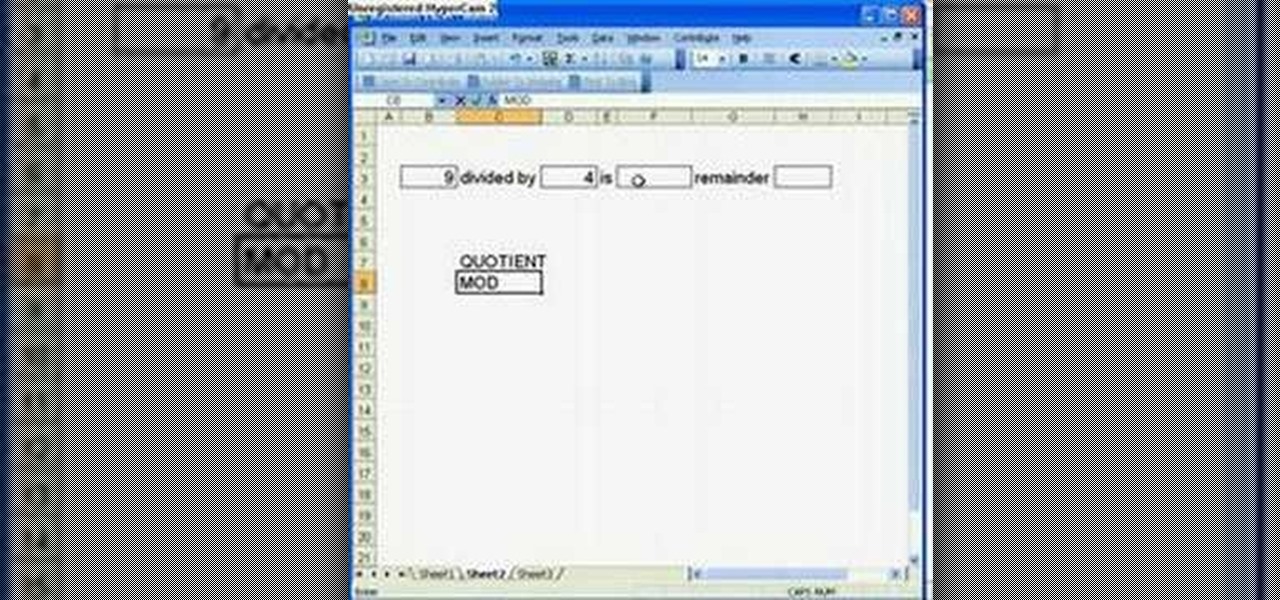
Microsoft Office Excel 2007 spreadsheet manager is a powerful tool that enables information workers to format spreadsheets, as well as analyze and share information to make more informed decisions. In this MS Excel video tutorial, you'll learn about the QUOTIENT and MOD functions. Note that, in urder to use these functions, you'll need to install the analysis ToolPak. For more information, watch this Excel how-to.

In the world of business, etiquette and manners are important to giving and receiving respect. Brush up on your business etiquette, including meals and introductions, in this free video series.

Video walkthrough guide for the Business Takeover missions in Grand Theft Auto (GTA): Vice City Stories for Playstation Portable (PSP) from gtamissions.com.

This video is a step-by-step analysis of each of the moves of the first bo kata, shu shi no kon, including what attack you are blocking and striking point on the opponent. A great way to learn these moves.

This video shows you how to perform timbei kata and gives an analysis (bunkai) of the timbei and rochin.

This video breaks down the kata, or form, utilizing the kama, the okinawan sickle. The second video gives an analysis (bunkai) of the kata. An excellent series that makes it easy to learn from.

San-cho zai is kata with three sai. This two part video shows you how to perform san-cho zai and then gives a more detailed explaination or analysis (called bunkai).

This video gives an analysis of second bo kata, cho un no kon and shows you how it is executed.

This video gives an analysis of strikes and blocks from the more advanced hojo-undo (but still the basics prior to a kata).

Few things are more important than being well-versed in data analytics and interpretation when it comes to succeeding in today's increasingly data-driven world. As a data scientist, these skills are the key to a high-paying career. For hackers, there's no better way to defeat the enemy than to become the enemy.

Need to make a homemade business card for you new company. Maybe you're about to take freelancing to the next level, a more professional level. Well, Word 2008 for Mac allows you to make your very own, personal business cards, and they give you tons of pre-formatted templates to choose from. You just have to supply the ink and paper. The Microsoft Office for Mac team shows you just how to find and use business card templates in this how-to video.

Facebook is a great tool for businesses. Watch these videos to learn how to maximize the effectiveness of your business' Facebook page. Reach out to your customers with social media and networking with the methods demonstrated in these how to videos.

An executive summary is one of the most important parts of your business career, because it's the first thing investors will look at. Placed at the beginning of a business plan, the executive summary is the hook that lures investors into wanting to learn more about your business. See how to write one in the best way possible.

In this video tutorial, viewers learn how to write their own business plan. This video provides several options for viewers to decide from to write a business plan. Users may choose to purchase a business plan software for $50-$65, take a business plan course for $75-$500 or hire a consultant for $1000,-$5000. Business course plans are usually located at college campuses. It is not recommended to hire a consultant as it is very expensive and you will ne the one giving the consultant the infor...

There's nothing better than being your own boss some say. If you are ready for the risks and the work, take your passion to the next level and start your own business. Learn how to start your own business with help from this video.

Women's business clothes should be professional but also stylish. Learn how to create a women's work wardrobe with tips from a fashion stylist in this free women's clothing video series.

The rumor that the iPhone 8 will ship with 3D camera system is not a new one, but a new analysis by Morgan Stanley's Charlie Chan lends credibility to the speculation. Now, it appears more likely than ever that Apple's next iPhone will ship with 3D capabilities, increasing potential for AR and VR integration in the future.

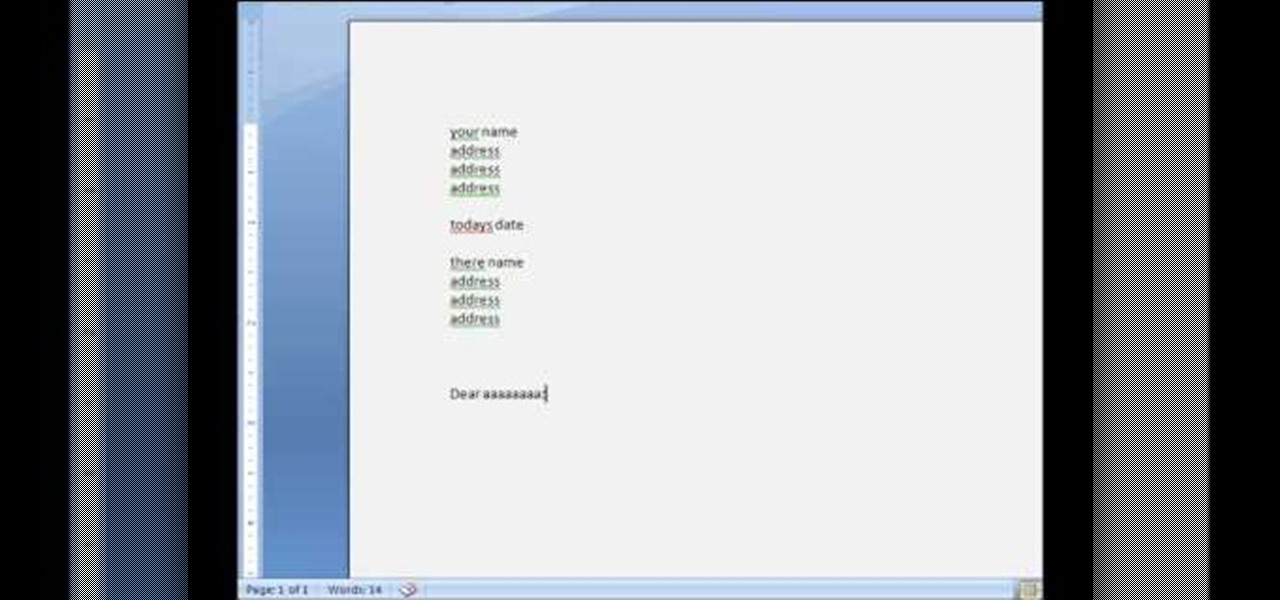
Type professional letters quickly and easily in Microsoft Word 2007

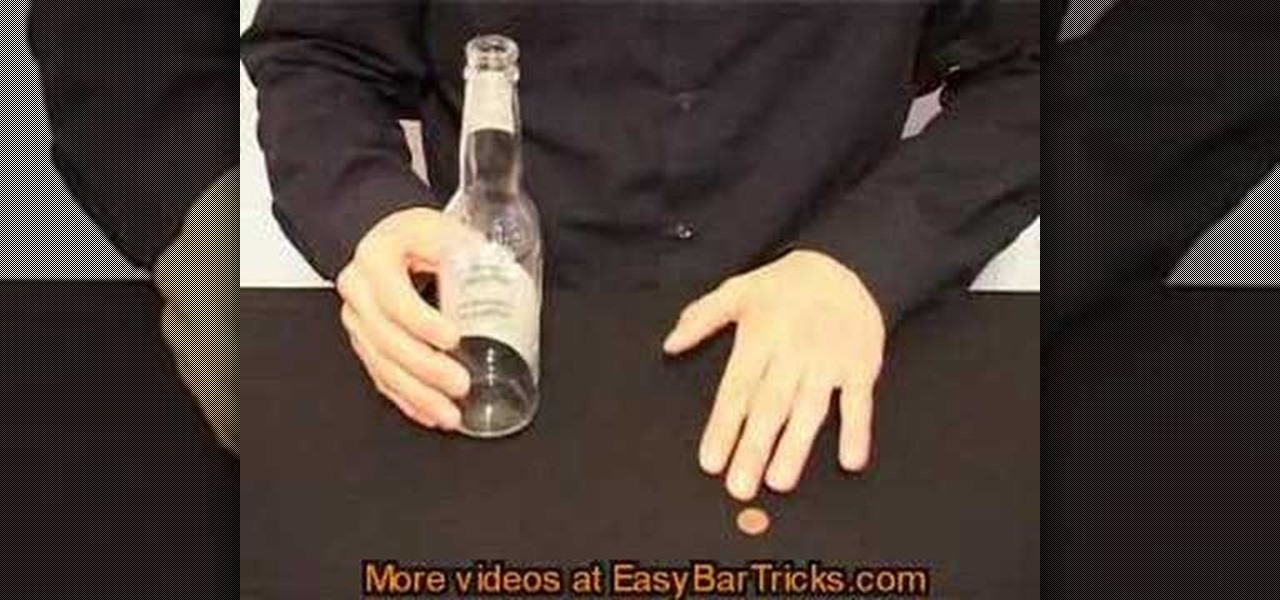
Bar tricks, gotta love em. This is an easy trick that's hard for someone to win unless they know the secret. Place a small coin on a business card and the business card on a bottle. Now remove the business so that the coin falls into the bottle. business card trick. Unless you know this business card trick it is very hard to figure out. Make a bet and you can win with this business card trick.

When customers come to your place of business, you want them to feel welcome and comfortable. In this video tutorial, Dave of Growing Wisdom discusses design principles to keep in mind when you're redoing the entryway to your business. For more and better information, and to get started redoing the entrance to your own business establishment, watch this landscaper's guide.

As you might guess, one of the domains in which Microsoft Excel really excels is business math. Brush up on the stuff for your next or current job with this how-to. In this tutorial from everyone's favorite digital spreadsheet guru, YouTube's ExcelIsFun, the 30th installment in his "Excel Business Math" series of free video lessons, you'll learn how to solve business math word problems that involve rate of change (increase or decrease).

Onshore, or on a boat, have you ever wondered what swims below in the dark water? Using standard equipment and a new process, marine scientists can now get a good look at what is swimming by—just by analyzing the water.

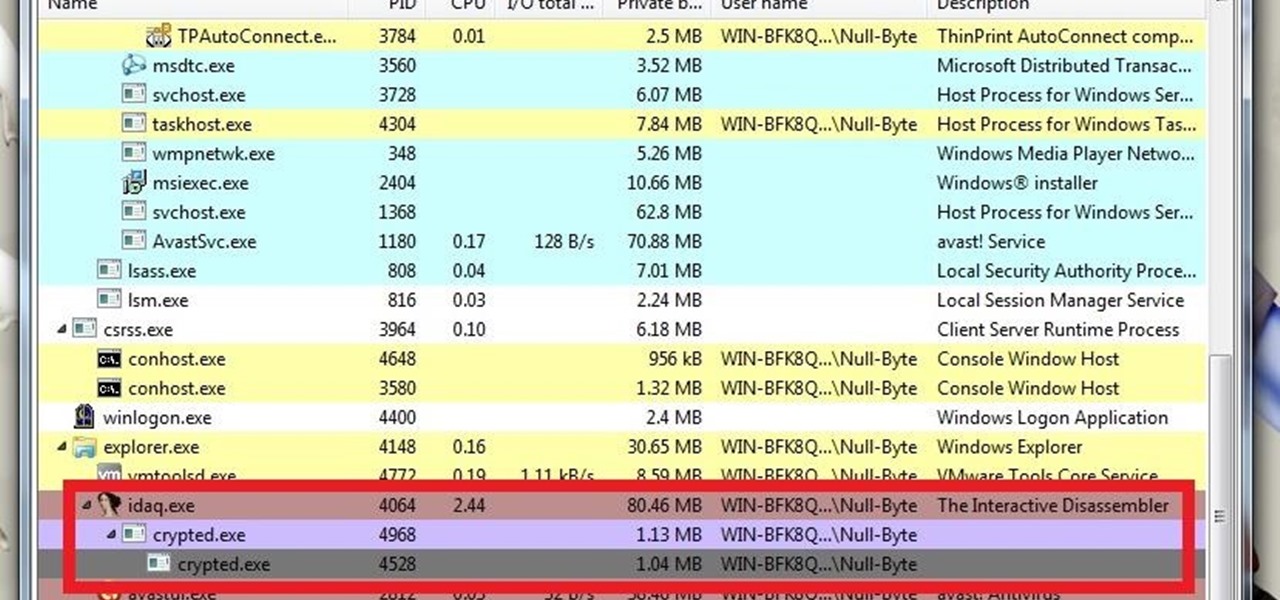
What's up guys? Welcome to a sort of general walkthrough on how one might approach a reversing and analysis on a crypted malware. This is by no means a universal technique so don't assume that this will occur in every scenario, it's more of a demonstration than anything really.

Welcome back, my budding hackers! One of the most basic skills the forensic investigator must master is the acquisition of data in a forensically sound manner. If data is not captured in a forensically sound manner, it may not be admissible in court. In my Kali Forensics series, I showed you how to acquire a forensically sound, bit-by-bit image of a storage device such as a hard drive or flash drive, but now let's dive into live memory.

If you use Microsoft Excel on a regular basis, odds are you work with numbers. Put those numbers to work. Statistical analysis allows you to find patterns, trends and probabilities within your data. In this MS Excel tutorial from everyone's favorite Excel guru, YouTube's ExcelsFun, the 92nd installment in his "Excel Statistics" series of free video lessons, you'll learn how to use the TINV and TDIST functions to test a hypothesis.

If you use Microsoft Excel on a regular basis, odds are you work with numbers. Put those numbers to work. Statistical analysis allows you to find patterns, trends and probabilities within your data. In this MS Excel tutorial from everyone's favorite Excel guru, YouTube's ExcelsFun, the 85th installment in his "Excel Statistics" series of free video lessons, you'll learn how to construct confidence intervals for proportions using NORMSINV function and other formulas.

An intensive analysis of the "blue third," a quarter-tone that lies somewhere between the major and minor third and is a key constituent of the blues scale that all harmonica players must master. With Satan & Adam harpist Adam Gussow.

Business casual is a popular style for men in modern business environments, but it's very difficult to pin down. How casual can I go? How businessy is too businessy? Watch this video to learn how business casual works and how you can rock it yourself.

VPN's are an invaluable set up for small business', and larger business', when it comes to keeping your information secure with remote employee's. This video details all of the info that you need to know about setting up and maintaining a great VPN!

Do you own a small business, but find yourself unable to understand the intricacies of your financial statements? You are not alone. This video features a small business coach explaining some of the intricacies of financial statements. The tips provided here should help you better understand your financial statements and use the information gleaned therein to improve the profitability of your business.


