

How To: Perform timbei kata
This video shows you how to perform timbei kata and gives an analysis (bunkai) of the timbei and rochin.

This video shows you how to perform timbei kata and gives an analysis (bunkai) of the timbei and rochin.

This video breaks down the kata, or form, utilizing the kama, the okinawan sickle. The second video gives an analysis (bunkai) of the kata. An excellent series that makes it easy to learn from.

San-cho zai is kata with three sai. This two part video shows you how to perform san-cho zai and then gives a more detailed explaination or analysis (called bunkai).

This video gives an analysis of second bo kata, cho un no kon and shows you how it is executed.

This video gives an analysis of strikes and blocks from the more advanced hojo-undo (but still the basics prior to a kata).
In this Tutorial I will show you how you can use the frequency of letters to decrypt the famous Caesar cipher. I hope it is easy to understand and helpful for getting in touch with basic cryptanalysis. If you find any mistakes or have questions feel free to ask me. Finally I ask you to give me feedback which I will take into account for the next part.

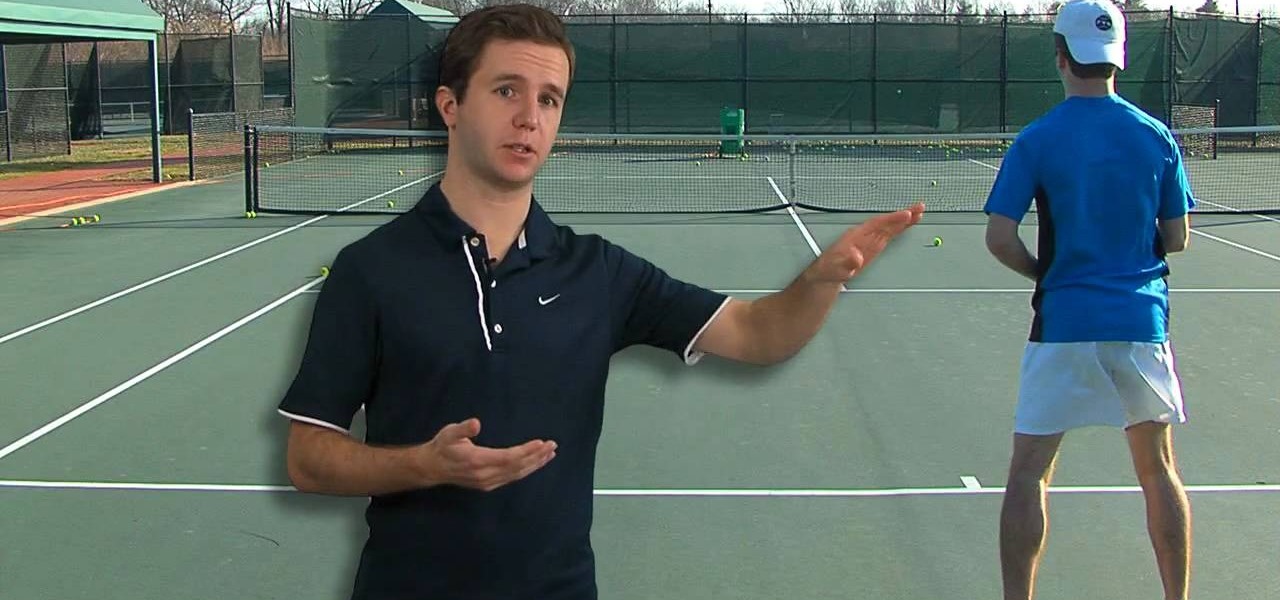
Welcome to a tennis lesson from FuzzyYellowBalls, the the best place to learn how to play tennis online. Our free video tennis lessons teach you how to play the game in a new way that combines technical analysis, visual learning, and step-by-step progressions.

The next phase of the holographic display is upon us, and Looking Glass is aggressively making sure that it's at the tip of the spear when it comes to leading that charge.

The recent announcement of a $480 million US Army contract awarded to Microsoft over Magic Leap for supplying 100,000 augmented reality headsets shows just a how lucrative the enterprise (and government) sector can be for AR.

The rumor that the iPhone 8 will ship with 3D camera system is not a new one, but a new analysis by Morgan Stanley's Charlie Chan lends credibility to the speculation. Now, it appears more likely than ever that Apple's next iPhone will ship with 3D capabilities, increasing potential for AR and VR integration in the future.

Data makes the world go round. It has gotten to the point that it's considered the most valuable resource, perhaps even more important than oil. Businesses use data to collect critical information about their users and improve their services; governments utilize it to improve things like public transportation; doctors analyze data to find more ways to save lives.

Onshore, or on a boat, have you ever wondered what swims below in the dark water? Using standard equipment and a new process, marine scientists can now get a good look at what is swimming by—just by analyzing the water.
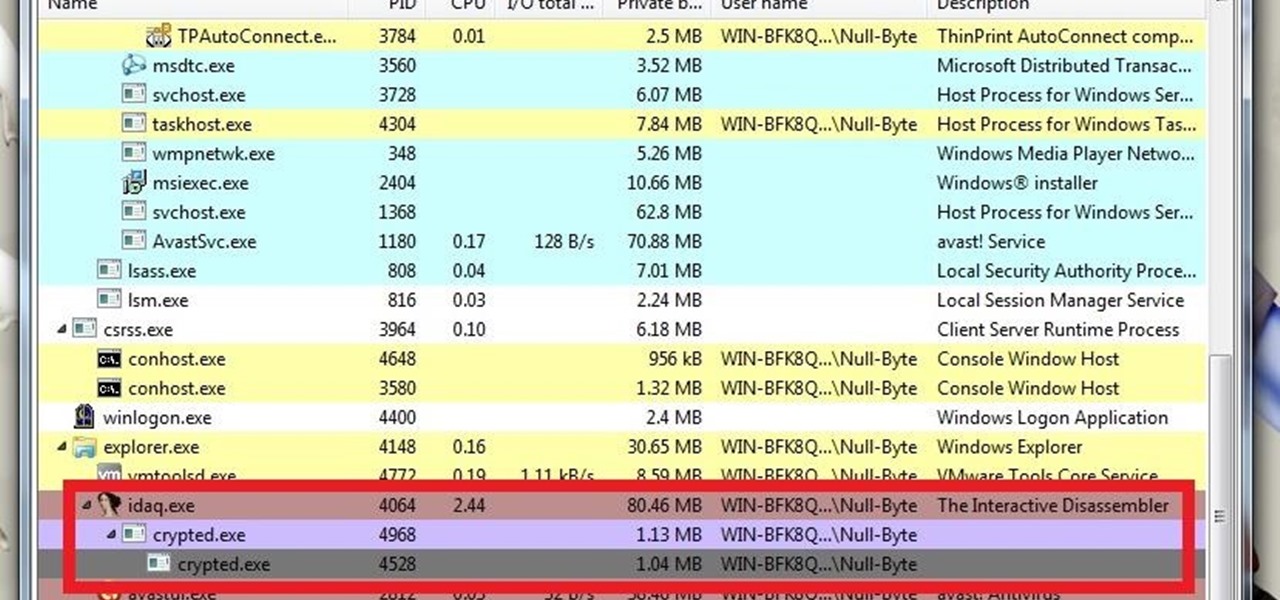
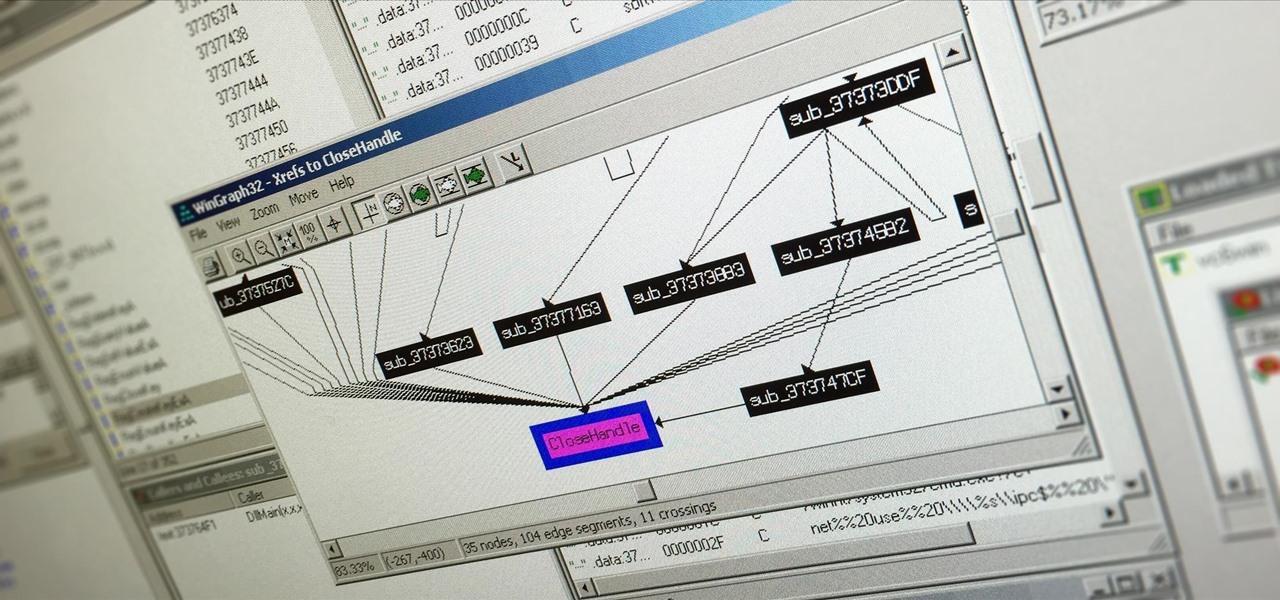
What's up guys? Welcome to a sort of general walkthrough on how one might approach a reversing and analysis on a crypted malware. This is by no means a universal technique so don't assume that this will occur in every scenario, it's more of a demonstration than anything really.

If you use Microsoft Excel on a regular basis, odds are you work with numbers. Put those numbers to work. Statistical analysis allows you to find patterns, trends and probabilities within your data. In this MS Excel tutorial from everyone's favorite Excel guru, YouTube's ExcelsFun, the 92nd installment in his "Excel Statistics" series of free video lessons, you'll learn how to use the TINV and TDIST functions to test a hypothesis.

If you use Microsoft Excel on a regular basis, odds are you work with numbers. Put those numbers to work. Statistical analysis allows you to find patterns, trends and probabilities within your data. In this MS Excel tutorial from everyone's favorite Excel guru, YouTube's ExcelsFun, the 85th installment in his "Excel Statistics" series of free video lessons, you'll learn how to construct confidence intervals for proportions using NORMSINV function and other formulas.

If you use Microsoft Excel on a regular basis, odds are you work with numbers. Put those numbers to work. Statistical analysis allows you to find patterns, trends and probabilities within your data. In this MS Excel tutorial from everyone's favorite Excel guru, YouTube's ExcelsFun, the 24th installment in his "Excel Statistics" series of free video lessons, you'll learn how to create quantitative data frequency distributions with pivot tables. See how to create the correct unambiguous labels ...

If you use Microsoft Excel on a regular basis, odds are you work with numbers. Put those numbers to work. Statistical analysis allows you to find patterns, trends and probabilities within your data. In this MS Excel tutorial from everyone's favorite Excel guru, YouTube's ExcelsFun, the 12th installment in his "Excel Statistics" series of free video lessons, you'll learn how to use Advanced Filter 'Unique Records Only" to extract a list of unique items from a data base, and then use the COUNTI...

Welcome to a tennis lesson from FuzzyYellowBalls, the the best place to learn how to play tennis online. Our free video tennis lessons teach you how to play the game in a new way that combines technical analysis, visual learning, and step-by-step progressions.

Welcome to a tennis lesson from FuzzyYellowBalls, the the best place to learn how to play tennis online. Our free video tennis lessons teach you how to play the game in a new way that combines technical analysis, visual learning, and step-by-step progressions.

Welcome to a tennis lesson from FuzzyYellowBalls, the the best place to learn how to play tennis online. Our free video tennis lessons teach you how to play the game in a new way that combines technical analysis, visual learning, and step-by-step progressions.

Welcome to a tennis lesson from FuzzyYellowBalls, the the best place to learn how to play tennis online. Our free video tennis lessons teach you how to play the game in a new way that combines technical analysis, visual learning, and step-by-step progressions.

Welcome to a tennis lesson from FuzzyYellowBalls, the the best place to learn how to play tennis online. Our free video tennis lessons teach you how to play the game in a new way that combines technical analysis, visual learning, and step-by-step progressions.

Welcome to a tennis lesson from FuzzyYellowBalls, the the best place to learn how to play tennis online. Our free video tennis lessons teach you how to play the game in a new way that combines technical analysis, visual learning, and step-by-step progressions.

Welcome to a tennis lesson from FuzzyYellowBalls, the the best place to learn how to play tennis online. Our free video tennis lessons teach you how to play the game in a new way that combines technical analysis, visual learning, and step-by-step progressions.

Welcome to a tennis lesson from FuzzyYellowBalls, the the best place to learn how to play tennis online. Our free video tennis lessons teach you how to play the game in a new way that combines technical analysis, visual learning, and step-by-step progressions.

Welcome to a tennis lesson from FuzzyYellowBalls, the the best place to learn how to play tennis online. Our free video tennis lessons teach you how to play the game in a new way that combines technical analysis, visual learning, and step-by-step progressions.
Welcome to a tennis lesson from FuzzyYellowBalls, the the best place to learn how to play tennis online. Our free video tennis lessons teach you how to play the game in a new way that combines technical analysis, visual learning, and step-by-step progressions.

Welcome to a tennis lesson from FuzzyYellowBalls, the the best place to learn how to play tennis online. Our free video tennis lessons teach you how to play the game in a new way that combines technical analysis, visual learning, and step-by-step progressions.

Learn how to employ proper tennis footwork. This video demonstrates the tennis footwork split step.

In this Forehand Fundamentals video, we talked about how you need to take your racket back to complete your preparation. This video goes into more detail about the backswing and discusses the wide variety of backswings you see on the pro tennis tour.

An intensive analysis of the "blue third," a quarter-tone that lies somewhere between the major and minor third and is a key constituent of the blues scale that all harmonica players must master. With Satan & Adam harpist Adam Gussow.

It will likely take a few more years before smartglasses are ready for primetime as component makers achieve the innovations necessary for consumer-centric device designs. Nevertheless, two technology companies are making steps in that direction as Qualcomm is rumored to be working on a chip dedicated to AR & VR headsets, while DigiLens has reduced the size of its waveguide displays for motorcycle helmets.
Welcome back, my greenhorn hackers! Digital forensics and hacking are complementary disciplines. The better you are at digital forensics, the better hacker you are, and the better hacker you are, the better you are digital forensics. Unfortunately, few people in either profession cross these discipline lines.

New to Excel? Looking for a tip? How about a tip so mind-blowingly useful as to qualify as a magic trick? You're in luck. In this Excel tutorial from ExcelIsFun, the 237th installment in their series of digital spreadsheet magic tricks, you'll learn how to
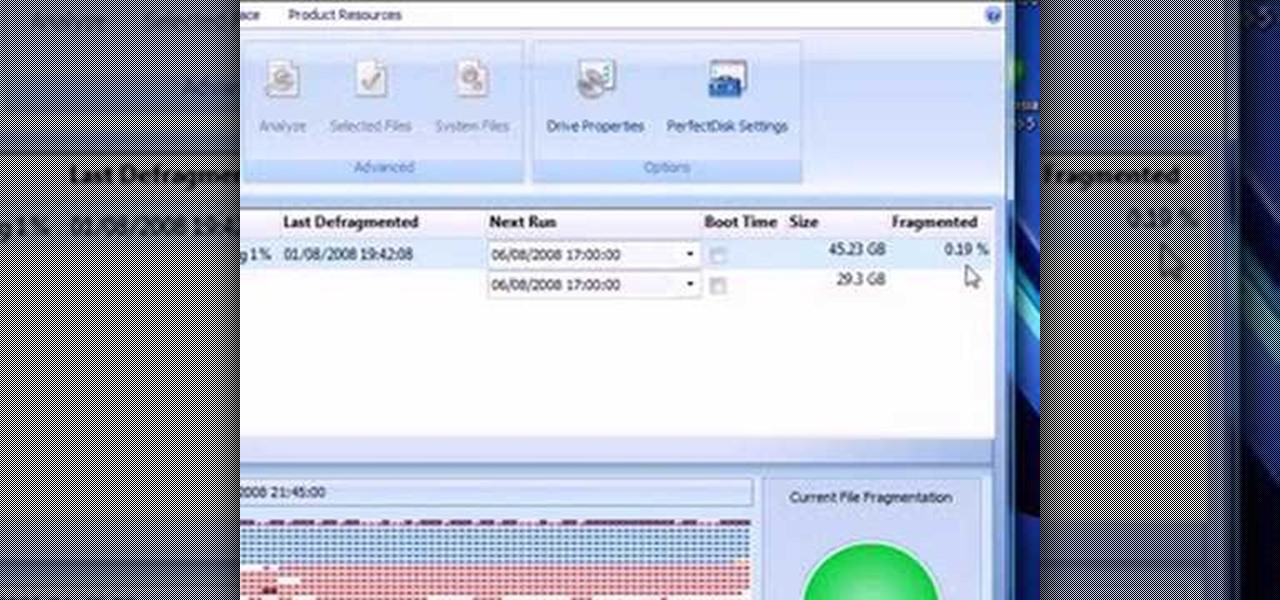
This video presents how to defragment and shrink a Windows Vista partition using Perfect Disk 2008 Professional program.First you need to download and install software application named Perfect Disk 2008.Type Perfect Disk 2008 into Google search engine, choose first link from the list.On the Raxco software home page choose Free Evaluation option from the list to the right.Download and install Perfect Disk 2008 Professional.Once it is installed, run the application. From Menu choose Analyze op...

This week, Snapchat parent Snap came closer to fulfilling its smartglasses destiny by adding new 3D content capabilities to its third-generation Spectacles. At the same time, the now defunct Meta Company continued its fall from grace, as a judge ruled in favor of the plaintiff in the patent infringement case against the Meta 1 and Meta 2 headsets.
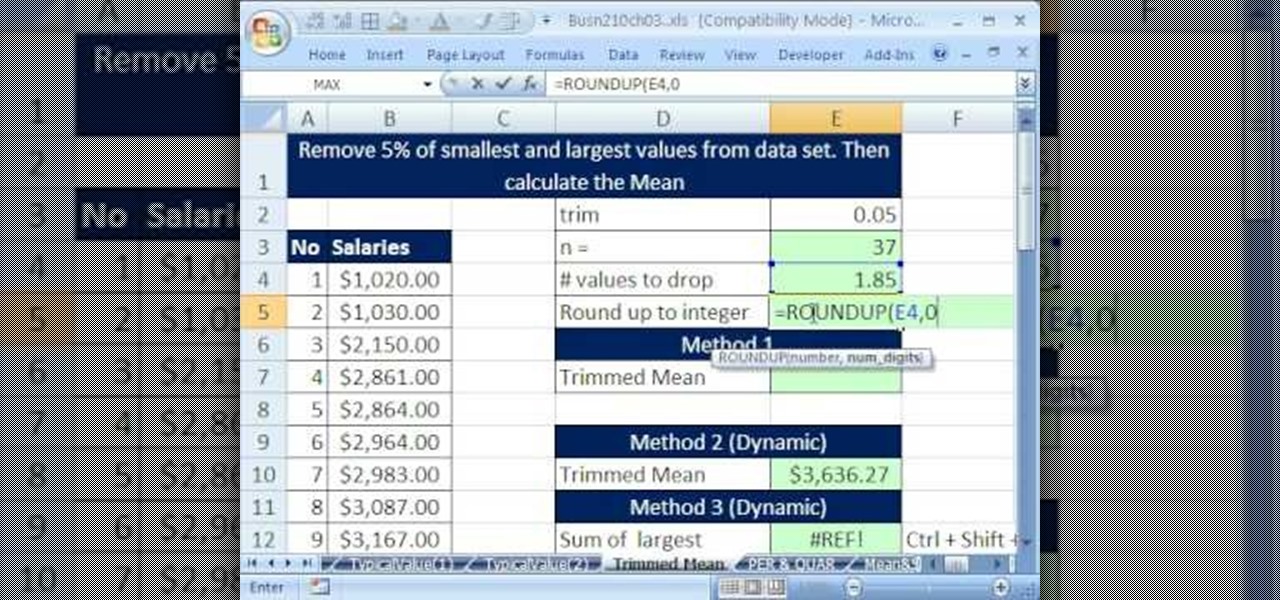
If you use Microsoft Excel on a regular basis, odds are you work with numbers. Put those numbers to work. Statistical analysis allows you to find patterns, trends and probabilities within your data. In this MS Excel tutorial from everyone's favorite Excel guru, YouTube's ExcelsFun, the 36th installment in his "Excel Statistics" series of free video lessons, you'll learn how to calculate a trimmed mean, which is used when there are extreme values in the data set that might skew the mean.

If you use Microsoft Excel on a regular basis, odds are you work with numbers. Put those numbers to work. Statistical analysis allows you to find patterns, trends and probabilities within your data. In this MS Excel tutorial from everyone's favorite Excel guru, YouTube's ExcelsFun, the 39th installment in his "Excel Statistics" series of free video lessons, you'll learn about variability (or dispersion or spread). Create an X-Y Scatter Diagram chart showing data points and the mean.
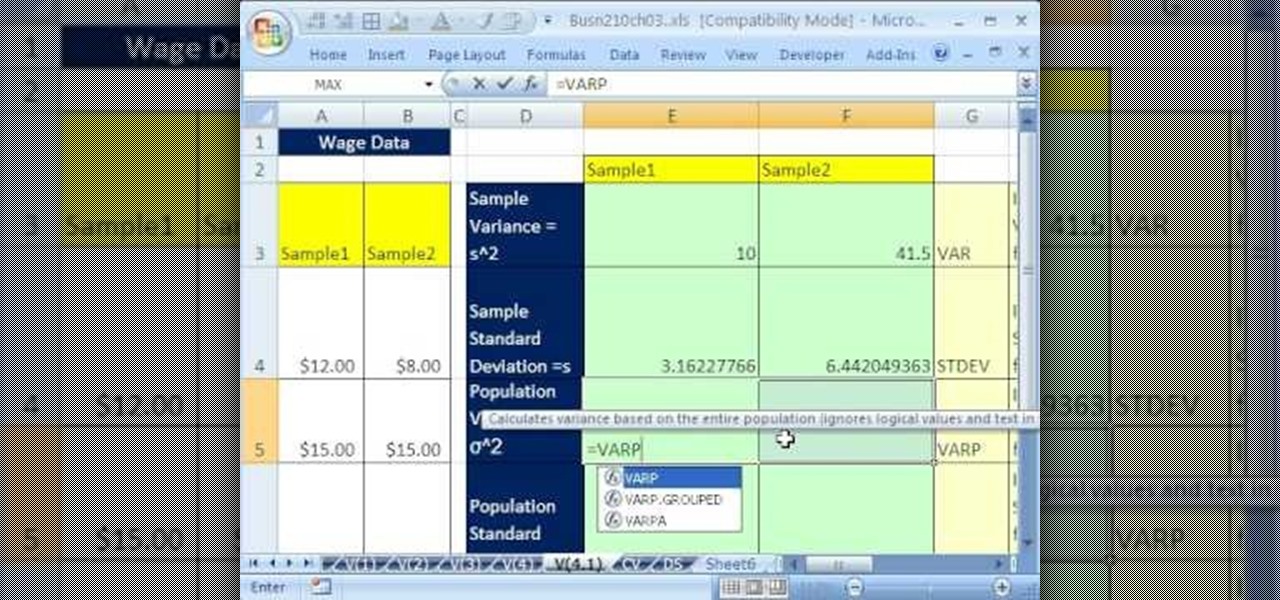
If you use Microsoft Excel on a regular basis, odds are you work with numbers. Put those numbers to work. Statistical analysis allows you to find patterns, trends and probabilities within your data. In this MS Excel tutorial from everyone's favorite Excel guru, YouTube's ExcelsFun, the 41st installment in his "Excel Statistics" series of free video lessons, you'll learn how to calculate deviations, variance and standard deviation for a sample and a population using Excel tables and the VAR, S...

If you use Microsoft Excel on a regular basis, odds are you work with numbers. Put those numbers to work. Statistical analysis allows you to find patterns, trends and probabilities within your data. In this MS Excel tutorial from everyone's favorite Excel guru, YouTube's ExcelsFun, the 32nd installment in his "Excel Statistics" series of free video lessons, you'll learn how to group when the quantitative data are whole numbers, integers or discrete data and how to group when the quantitative ...