Looking for a primer on how to create and work with names in Microsoft Office Excel? You've come to the right place. In this free video tutorial from everyone's favorite MS Excel guru, YouTube's ExcelIsFun, the 10th installment in his series of Excel name tricks, you'll learn how to store lookup tables in memory using a named array.
Looking for a primer on how to create and work with names in Microsoft Office Excel? You've come to the right place. In this free video tutorial from everyone's favorite MS Excel guru, YouTube's ExcelIsFun, the 8th installment in his series of Excel name tricks, you'll learn how to name cell ranges with relative cell references instead of the default absolute cell references.

If you use Microsoft Excel on a regular basis, odds are you work with numbers. Put those numbers to work. Statistical analysis allows you to find patterns, trends and probabilities within your data. In this MS Excel tutorial from everyone's favorite Excel guru, YouTube's ExcelsFun, the 86th installment in his "Excel Statistics" series of free video lessons, you'll learn how to construct confidence intervals for proportions using NORMSINV function and other formulas.

If you use Microsoft Excel on a regular basis, odds are you work with numbers. Put those numbers to work. Statistical analysis allows you to find patterns, trends and probabilities within your data. In this MS Excel tutorial from everyone's favorite Excel guru, YouTube's ExcelsFun, the 87th installment in his "Excel Statistics" series of free video lessons, you'll learn how to calculate sample size (n) for confidence intervals.

If you use Microsoft Excel on a regular basis, odds are you work with numbers. Put those numbers to work. Statistical analysis allows you to find patterns, trends and probabilities within your data. In this MS Excel tutorial from everyone's favorite Excel guru, YouTube's ExcelsFun, the 27th installment in his "Excel Statistics" series of free video lessons, you'll learn how to create a quantitative data dot plot chart using the REPT and COUNTIF functions.

If you use Microsoft Excel on a regular basis, odds are you work with numbers. Put those numbers to work. Statistical analysis allows you to find patterns, trends and probabilities within your data. In this MS Excel tutorial from everyone's favorite Excel guru, YouTube's ExcelsFun, the 26th installment in his "Excel Statistics" series of free video lessons, you'll learn how to create quantitative data cumulative frequency distributions with pivot tables.

If you use Microsoft Excel on a regular basis, odds are you work with numbers. Put those numbers to work. Statistical analysis allows you to find patterns, trends and probabilities within your data. In this MS Excel tutorial from everyone's favorite Excel guru, YouTube's ExcelsFun, the 16th installment in his "Excel Statistics" series of free video lessons, you'll learn how to cross tabulate & do percentage cross tabulation for categorical data using a pivot table (PivotTable).
If you use Microsoft Excel on a regular basis, odds are you work with numbers. Put those numbers to work. Statistical analysis allows you to find patterns, trends and probabilities within your data. In this MS Excel tutorial from everyone's favorite Excel guru, YouTube's ExcelsFun, the 19th installment in his "Excel Statistics" series of free video lessons, you'll learn how to group categories in a frequency distribution with a formula (2 COUNTIF) and the pivot table (PivotTable) grouping fea...
If you use Microsoft Excel on a regular basis, odds are you work with numbers. Put those numbers to work. Statistical analysis allows you to find patterns, trends and probabilities within your data. In this MS Excel tutorial from everyone's favorite Excel guru, YouTube's ExcelsFun, the 17th installment in his "Excel Statistics" series of free video lessons, you'll learn how to cross tabulate & do percentage cross tabulation for categorical data using formulas rather than pivot tables.
If you use Microsoft Excel on a regular basis, odds are you work with numbers. Put those numbers to work. Statistical analysis allows you to find patterns, trends and probabilities within your data. In this MS Excel tutorial from everyone's favorite Excel guru, YouTube's ExcelsFun, the 3rd installment in his "Excel Statistics" series of free video lessons, you'll learn how to use Excel's sorting and pivot tables (PivotTables) data analysis tools.
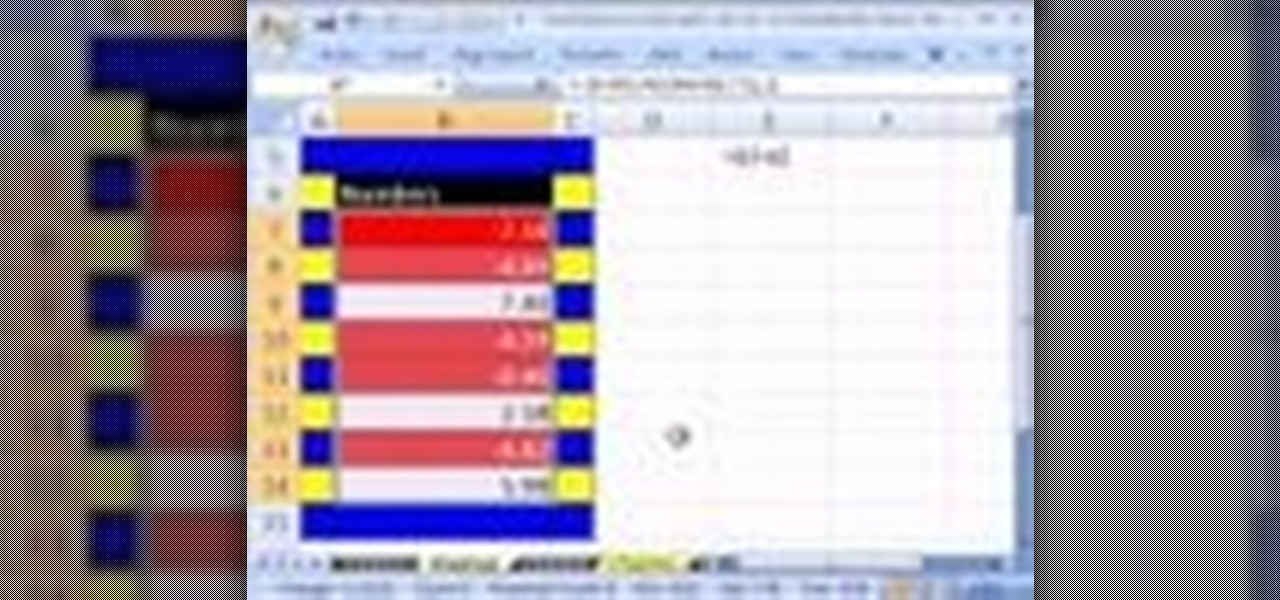
Love Microsoft Excel? This clip contains a tip that just might induce you to. With this free video tutorial from ExcelIsFun, the 4nd installment of his "YouTubers Love Excel 2007" or YTLE2k7 series of free video MS Excel lessons, you'll learn how to use conditional formatting to add red to negative numbers and green to positive numbers using a single True/False formula!
If you use Microsoft Excel on a regular basis, odds are you work with numbers. Put those numbers to work. Statistical analysis allows you to find patterns, trends and probabilities within your data. In this MS Excel tutorial from everyone's favorite Excel guru, YouTube's ExcelsFun, the 35th installment in his "Excel Statistics" series of free video lessons, you'll learn how to calculate weighted and geometric means and see how to use the GEOMEAN function.
If you use Microsoft Excel on a regular basis, odds are you work with numbers. Put those numbers to work. Statistical analysis allows you to find patterns, trends and probabilities within your data. In this MS Excel tutorial from everyone's favorite Excel guru, YouTube's ExcelsFun, the 33rd installment in his "Excel Statistics" series of free video lessons, you'll learn how to use the AVEARGE, MEDIAN, MODE, PERCENTILE, QUARTILE and PERCENTILERANK functions to measure location.
If you use Microsoft Excel on a regular basis, odds are you work with numbers. Put those numbers to work. Statistical analysis allows you to find patterns, trends and probabilities within your data. In this MS Excel tutorial from everyone's favorite Excel guru, YouTube's ExcelsFun, the 4th installment in his "Excel Statistics" series of free video lessons, you'll learn how to create a frequency table and percentage frequency table using a Pivot Table (PivotTable).
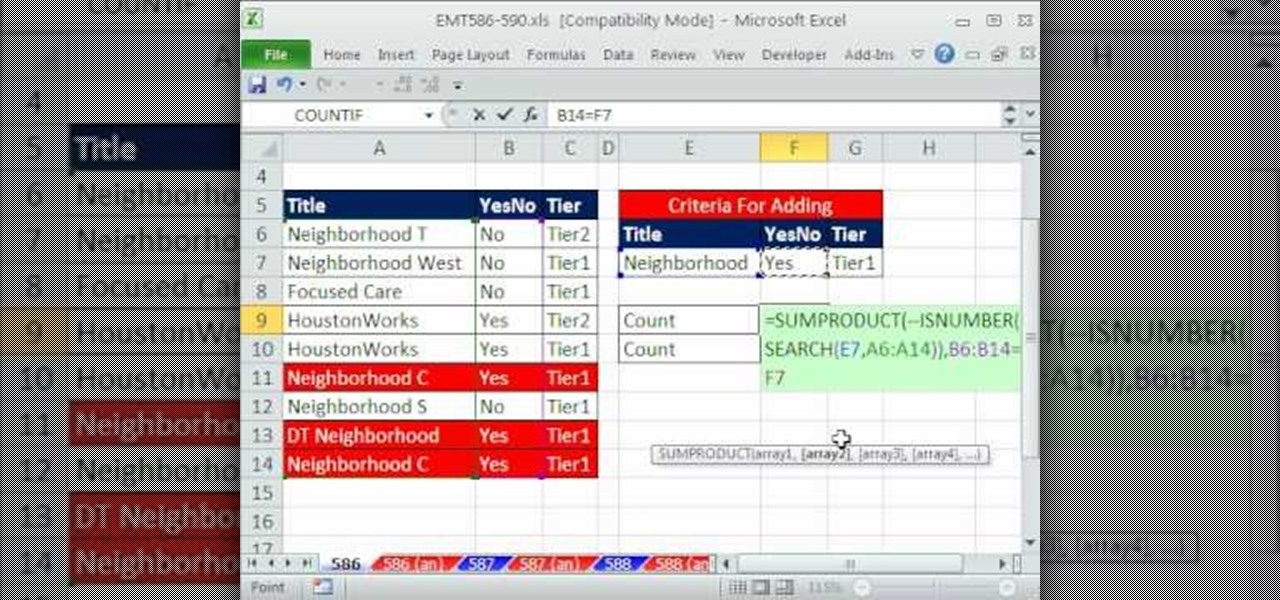
New to Microsoft Excel? Looking for a tip? How about a tip so mind-blowingly useful as to qualify as a magic trick? You're in luck. In this MS Excel tutorial from ExcelIsFun, the 586th installment in their series of digital spreadsheet magic tricks, you'll learn how to enumerate rows that meet 3 using the SEARCH function.
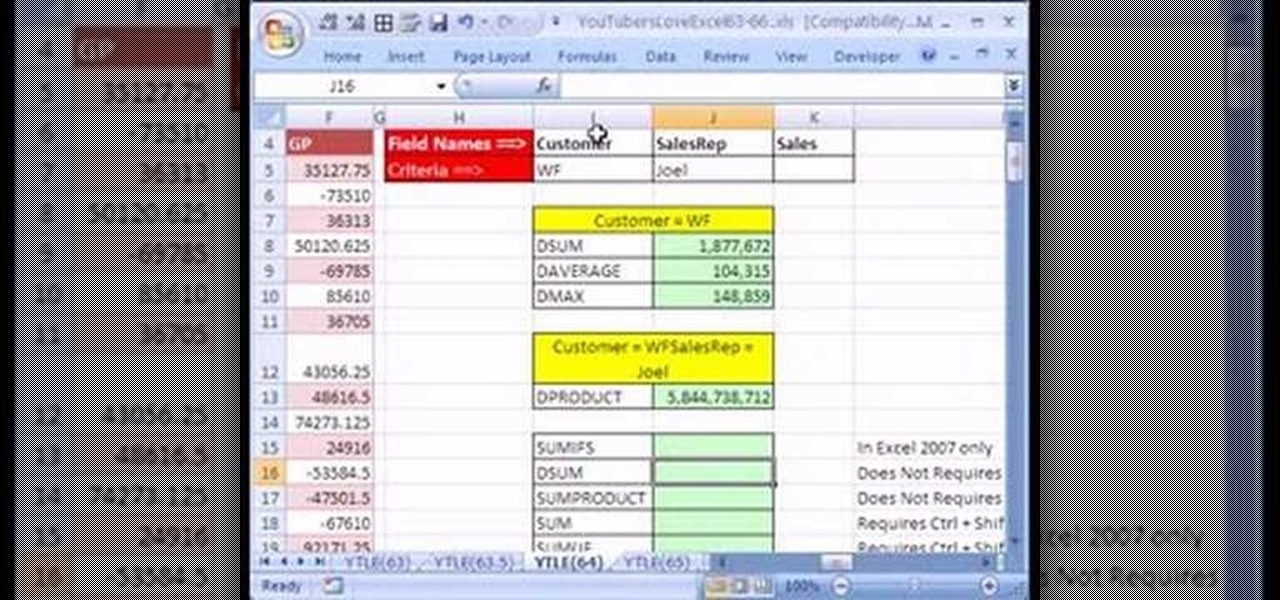
video tutorial from ExcelIsFun, the 64th installment of his "YouTubers Love Excel" or YTLE series of free video MS Excel lessons, you'll learn how to Excel's D (i.e., database) functions such as DSUM, DAVERAGE, and DMAX.
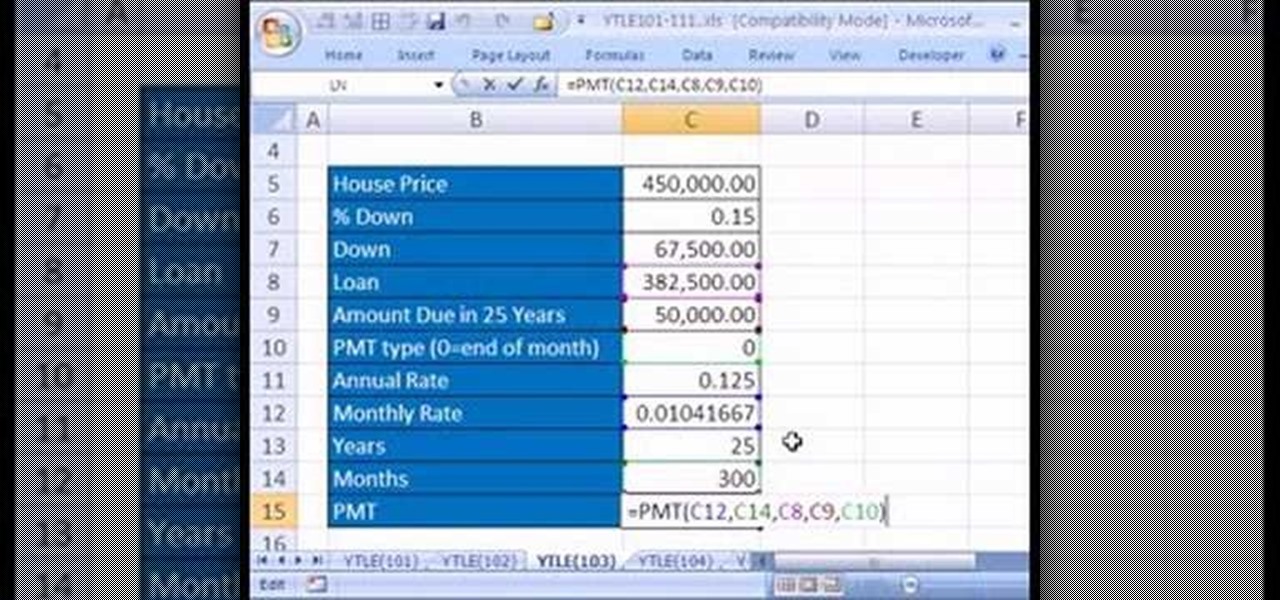
Love Microsoft Excel? This clip contains a tip that just might induce you to. With this free video tutorial from ExcelIsFun, the 103rd installment of his "YouTubers Love Excel" or YTLE series of free video MS Excel lessons, you'll learn how to use Goal Seek to change a formula input number so that the formula is a desired result. Also learn how to use the PMT function.
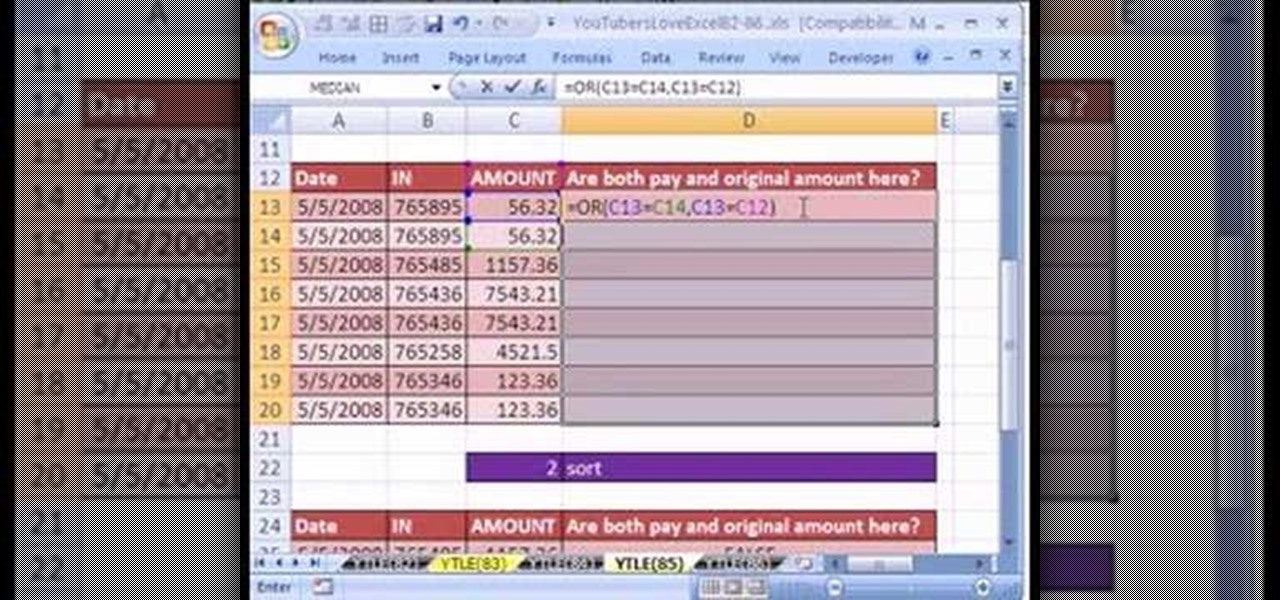
Love Microsoft Excel? This clip contains a tip that just might induce you to. With this free video tutorial from ExcelIsFun, the 85th installment of his "YouTubers Love Excel" or YTLE series of free video MS Excel lessons, you'll learn how to isolate unique records with the OR function.
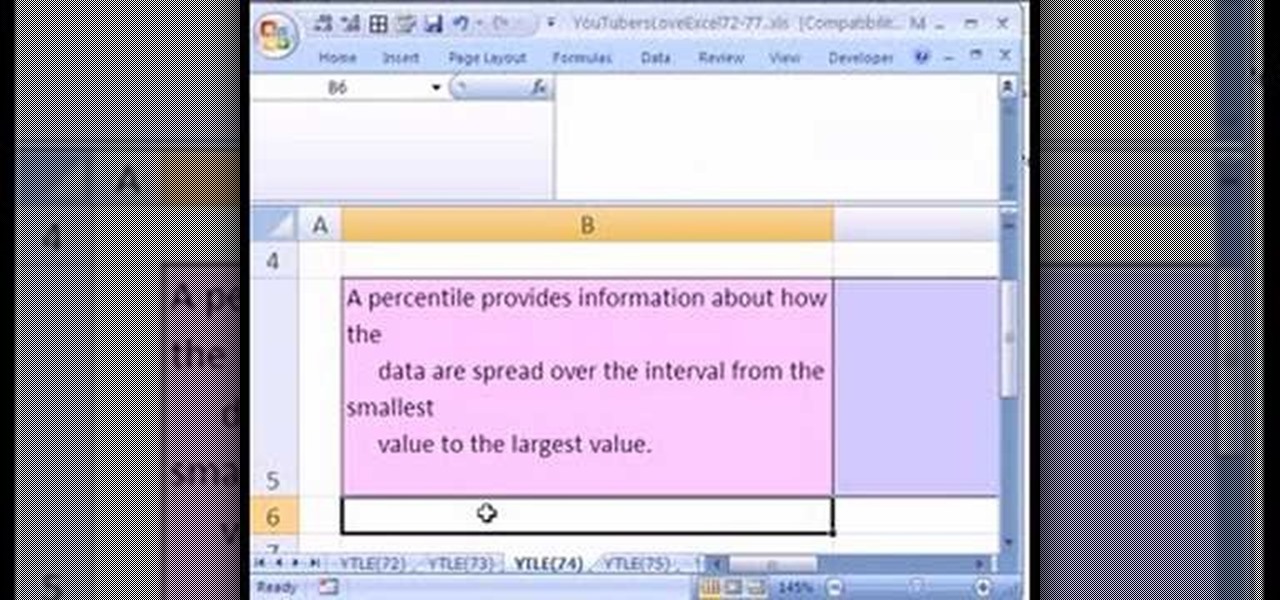
Love Microsoft Excel? This clip contains a tip that just might induce you to. With this free video tutorial from ExcelIsFun, the 74th installment of his "YouTubers Love Excel" or YTLE series of free video MS Excel lessons, you'll learn how to fix bad data with the CLEAN & TRIM functions.
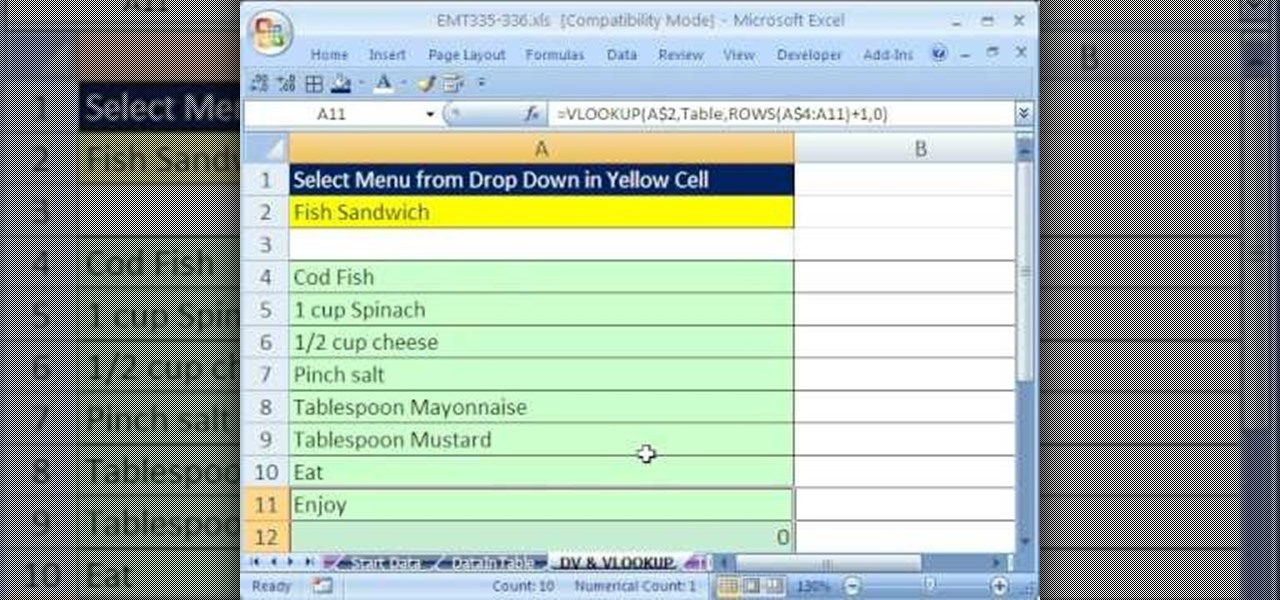
New to Microsoft Excel? Looking for a tip? How about a tip so mind-blowingly useful as to qualify as a magic trick? You're in luck. In this MS Excel tutorial from ExcelIsFun, the 335th installment in their series of digital spreadsheet magic tricks, you'll learn how to increment column numbers for a VLOOKUP lookup table when you are copying the formula down across the rows (down a column).
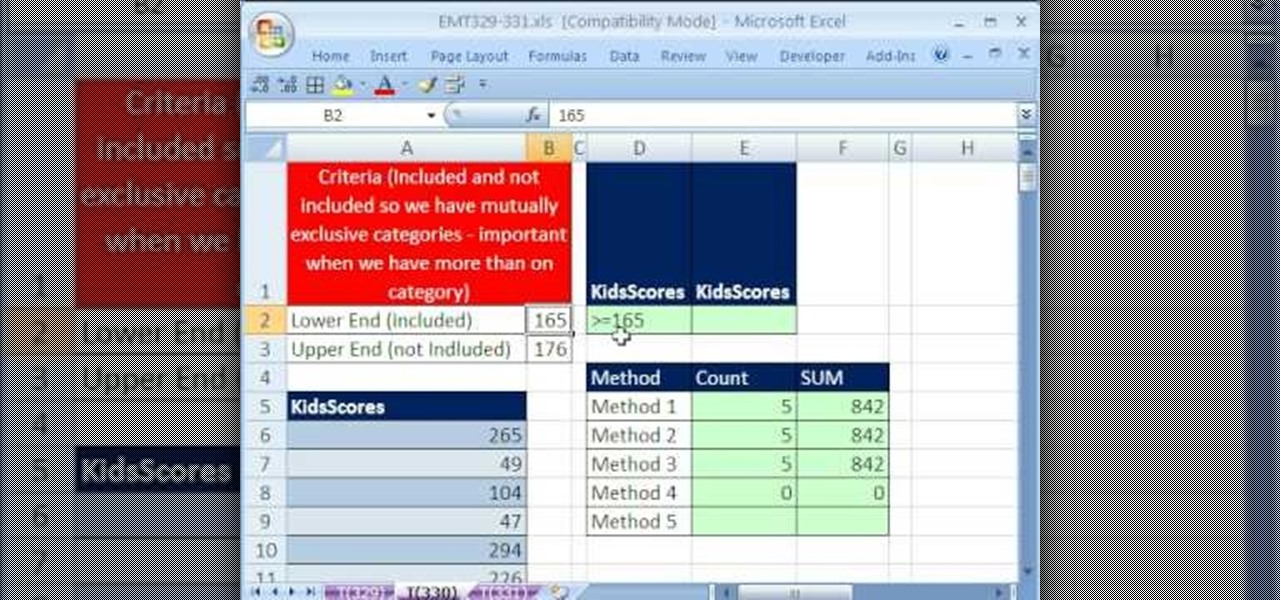
New to Microsoft Excel? Looking for a tip? How about a tip so mind-blowingly useful as to qualify as a magic trick? You're in luck. In this MS Excel tutorial from ExcelIsFun, the 90th installment in their series of digital spreadsheet magic tricks, you'll learn how to use the DSUM and DCOUNT functions to sum or count between an upper and lower limit.
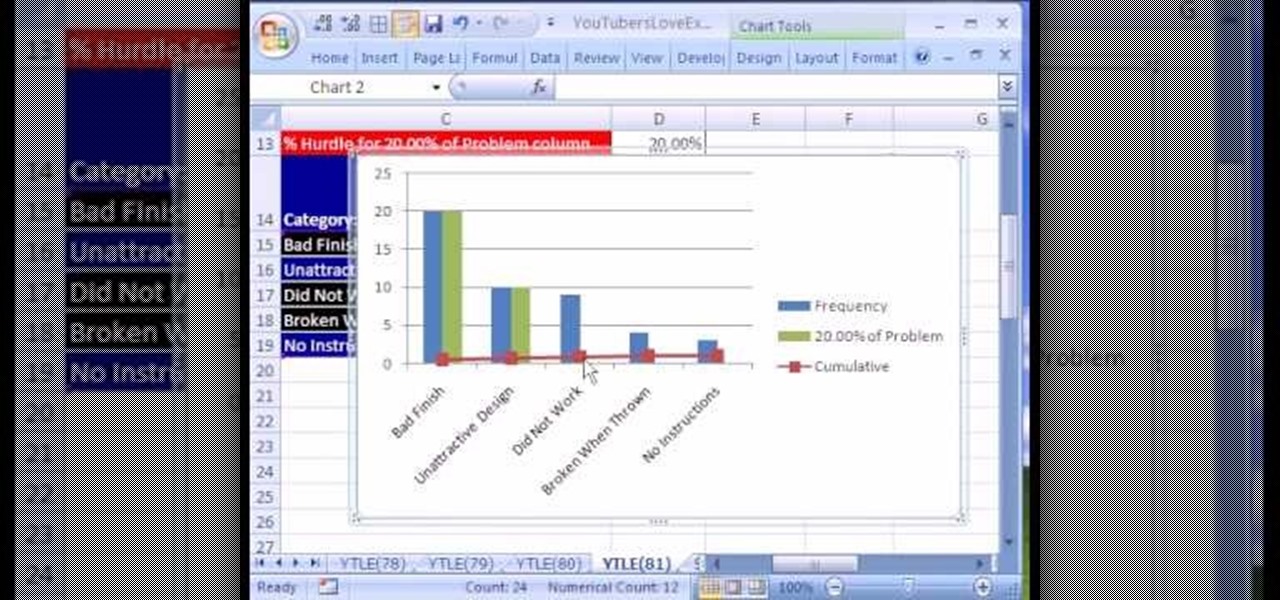
Love Microsoft Excel? This clip contains a tip that just might induce you to. With this free video tutorial from ExcelIsFun, the 81st installment of his "YouTubers Love Excel" or YTLE series of free video MS Excel lessons, you'll learn how to add conditional formatting to a chart by creating a new column of data with a formula.
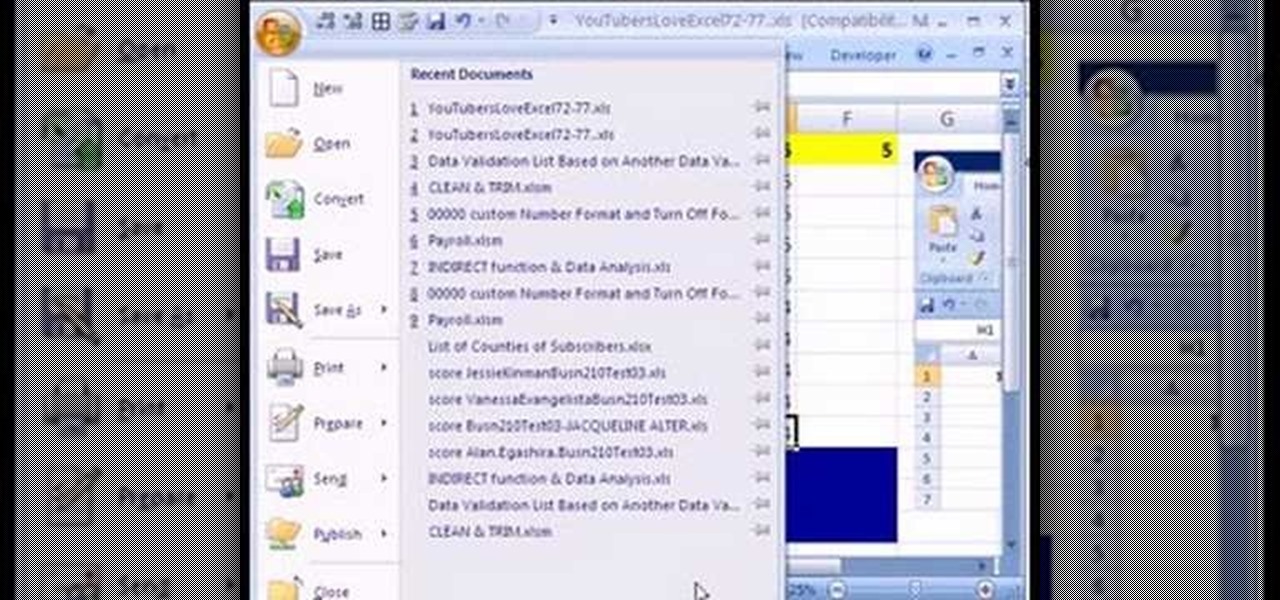
Love Microsoft Excel? This clip contains a tip that just might induce you to. With this free video tutorial from ExcelIsFun, the 72nd installment of his "YouTubers Love Excel" or YTLE series of free video MS Excel lessons, you'll learn how to turn off auto formatting so that column and row formatting or formulas are not automatically created.
Love Microsoft Excel? This clip contains a tip that just might induce you to. With this free video tutorial from ExcelIsFun, the 101st installment of his "YouTubers Love Excel" or YTLE series of free video MS Excel lessons, you'll learn how to use conditional formatting AND custom number formatting to add styling to a cell.
Love Microsoft Excel? This clip contains a tip that just might induce you to. With this free video tutorial from ExcelIsFun, the 87th installment of his "YouTubers Love Excel" or YTLE series of free video MS Excel lessons, you'll learn how to quickly remove rows of a table where the row has a blank in column A.
Love Microsoft Excel? This clip contains a tip that just might induce you to. With this free video tutorial from ExcelIsFun, the 91st installment of his "YouTubers Love Excel" or YTLE series of free video MS Excel lessons, you'll learn how to create an average with multiple criteria using pivot tables (PivotTable). Learn to love digital spreadsheets more perfectly with the tricks outlined in this free Microsoft Office how-to.
Love Microsoft Excel? This clip contains a tip that just might induce you to. With this free video tutorial from ExcelIsFun, the 86th installment of his "YouTubers Love Excel" or YTLE series of free video MS Excel lessons, you'll learn how to create a TRUE/FALSE formula to change the function of pivot table as well as how to filter one.
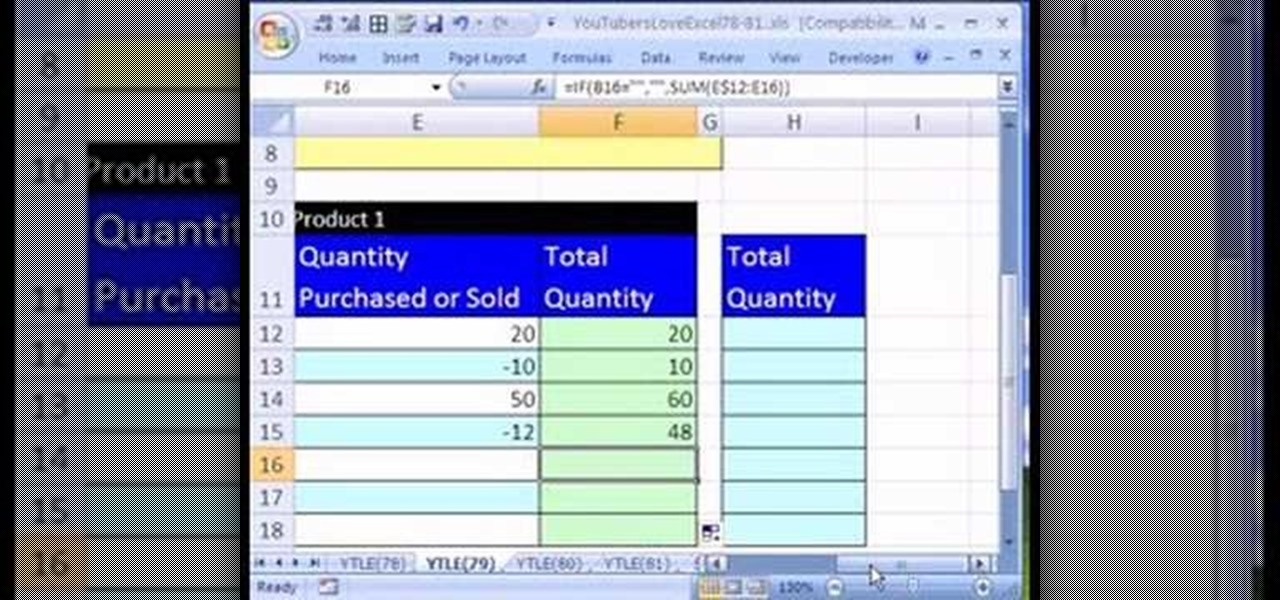
Love Microsoft Excel? This clip contains a tip that just might induce you to. With this free video tutorial from ExcelIsFun, the 79th installment of his "YouTubers Love Excel" or YTLE series of free video MS Excel lessons, you'll learn how to add conditional formatting to an entire table based on the content of a cell outside the table area. Learn to love digital spreadsheets more perfectly with the tricks outlined in this free Microsoft Office how-to.
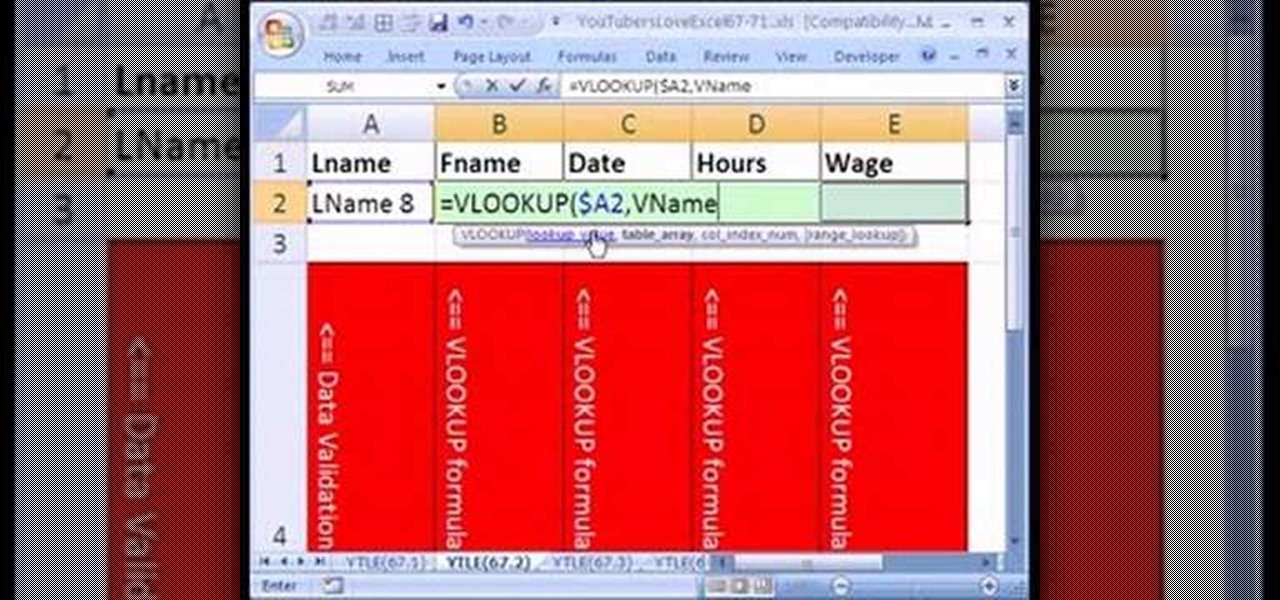
Love Microsoft Excel? This clip contains a tip that just might induce you to. With this free video tutorial from ExcelIsFun, the 66th installment of his "YouTubers Love Excel" or YTLE series of free video MS Excel lessons, you'll learn how to pull data from a table on one worksheet to a second worksheet using the VLOOKUP and DGET functions.
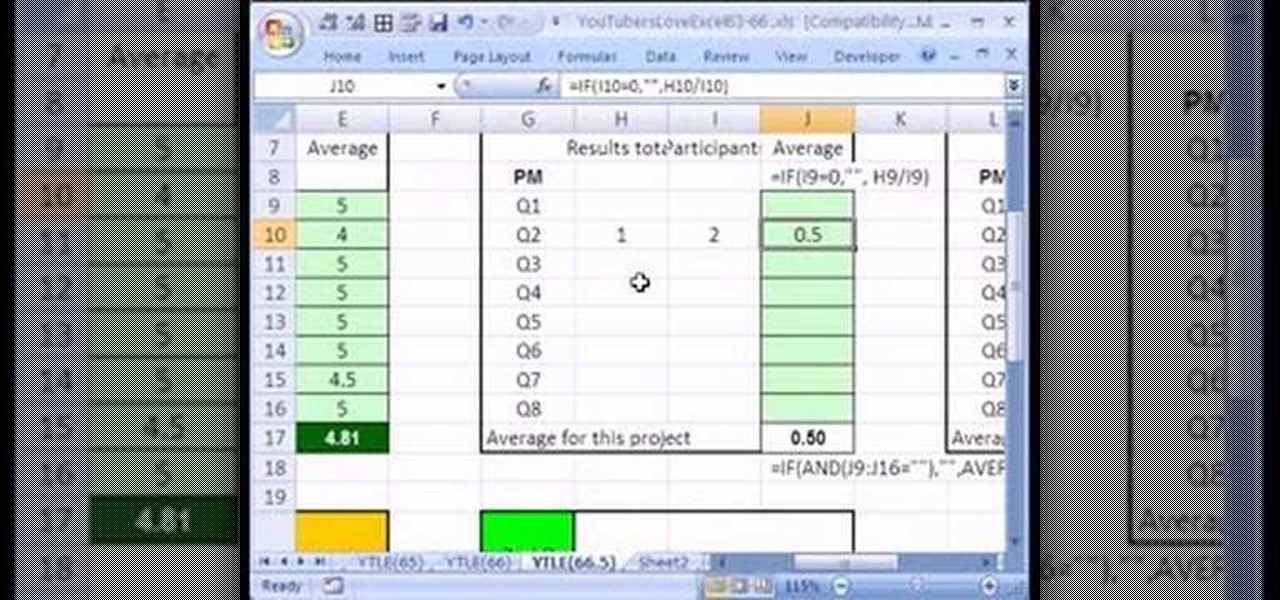
Love Microsoft Excel? This clip contains a tip that just might induce you to. With this free video tutorial from ExcelIsFun, the 66.5th installment of his "YouTubers Love Excel" or YTLE series of free video MS Excel lessons, you'll see 3 different ways to hide formula errors.
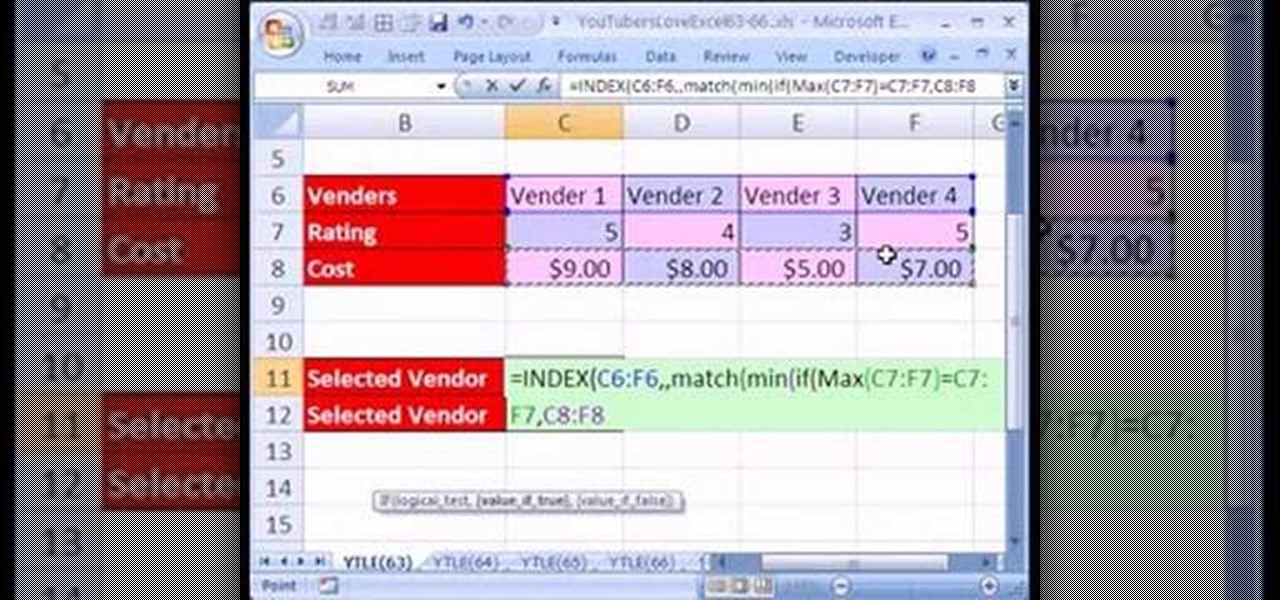
Love Microsoft Excel? This clip contains a tip that just might induce you to. With this free video tutorial from ExcelIsFun, the 63rd installment of his "YouTubers Love Excel" or YTLE series of free video MS Excel lessons, you'll learn how to create an array formula to find the vendor with the maximum rating and the lowest cost Learn to love digital spreadsheets more perfectly with the tricks outlined in this free Microsoft Office how-to.
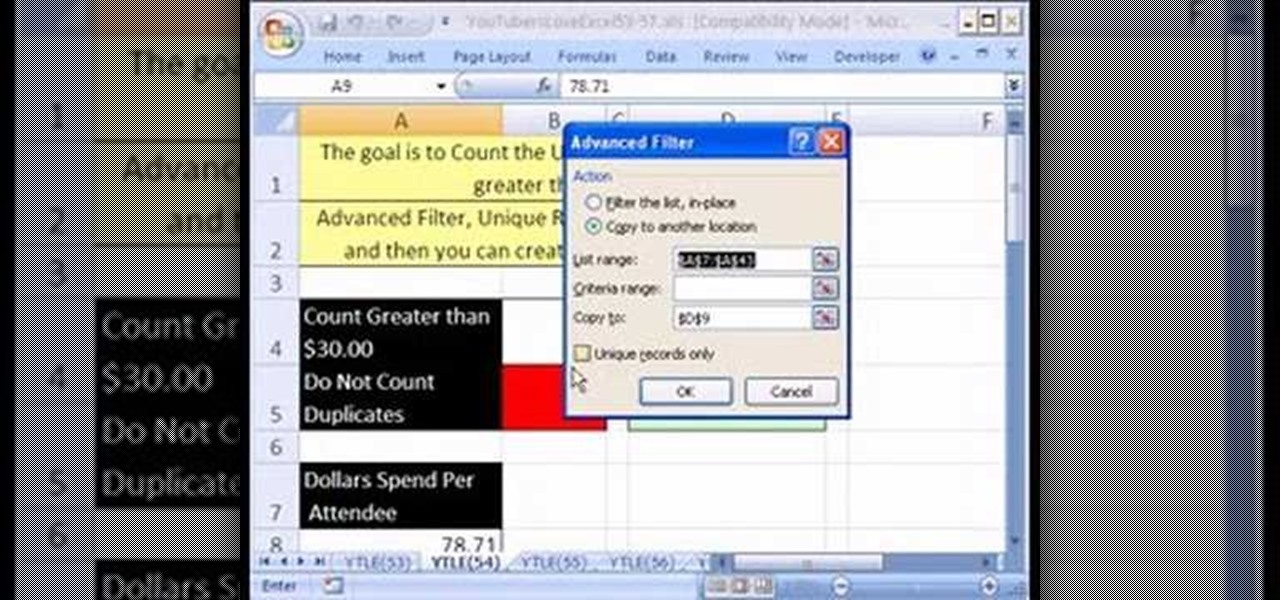
Love Microsoft Excel? This clip contains a tip that just might induce you to. With this free video tutorial from ExcelIsFun, the 54th installment of his "YouTubers Love Excel" or YTLE series of free video MS Excel lessons, you'll learn how to count records exceeding a given hurdle using Excel's advanced filter tool. Learn to love digital spreadsheets more perfectly with the tricks outlined in this free Microsoft Office how-to.
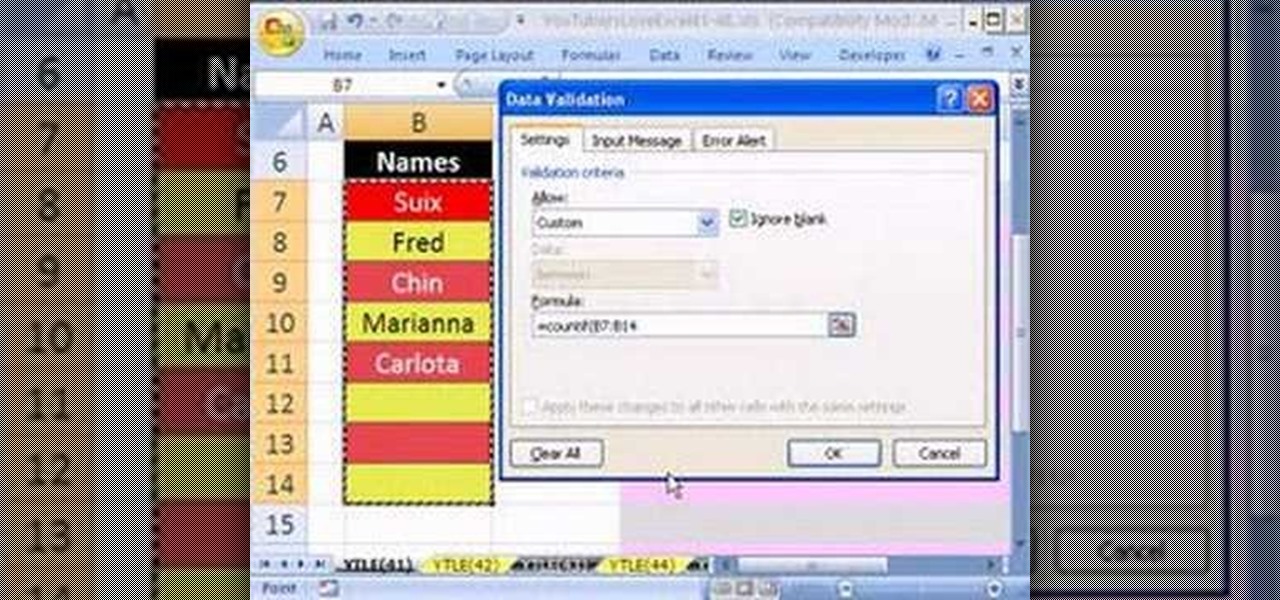
Love Microsoft Excel? This clip contains a tip that just might induce you to. With this free video tutorial from ExcelIsFun, the 41st installment of his "YouTubers Love Excel" or YTLE series of free video MS Excel lessons, you'll learn how to use a true/false formula with the COUNTIF function to prevent duplicate entries in a list. Learn to love digital spreadsheets more perfectly with the tricks outlined in this free Microsoft Office how-to.
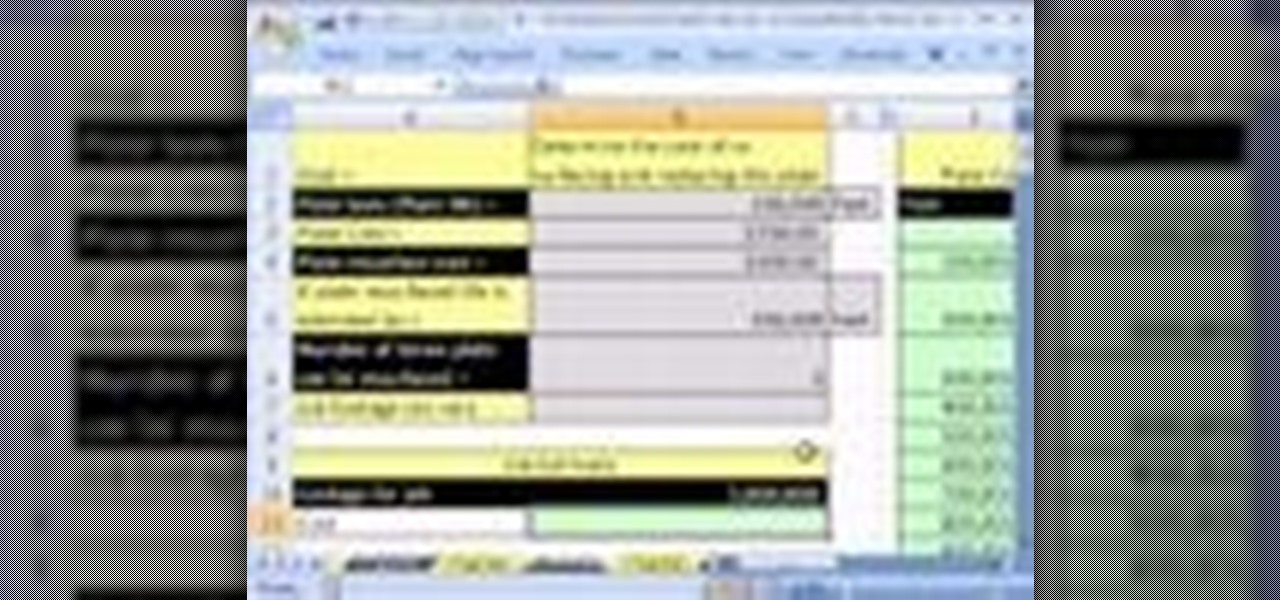
Love Microsoft Excel? This clip contains a tip that just might induce you to. With this free video tutorial from ExcelIsFun, the 47th installment of his "YouTubers Love Excel" or YTLE series of free video MS Excel lessons, you'll learn how to calculate total plate cost for a print shop using the VLOOKUP function. Learn to love digital spreadsheets more perfectly with the tricks outlined in this free Microsoft Office how-to.
From Ramanujan to calculus co-creator Gottfried Leibniz, many of the world's best and brightest mathematical minds have belonged to autodidacts. And, thanks to the Internet, it's easier than ever to follow in their footsteps. With this installment from Internet pedagogical superstar Salman Khan's series of free math tutorials, you'll learn how to perform a geometric proof of the Pythagorean theorem.
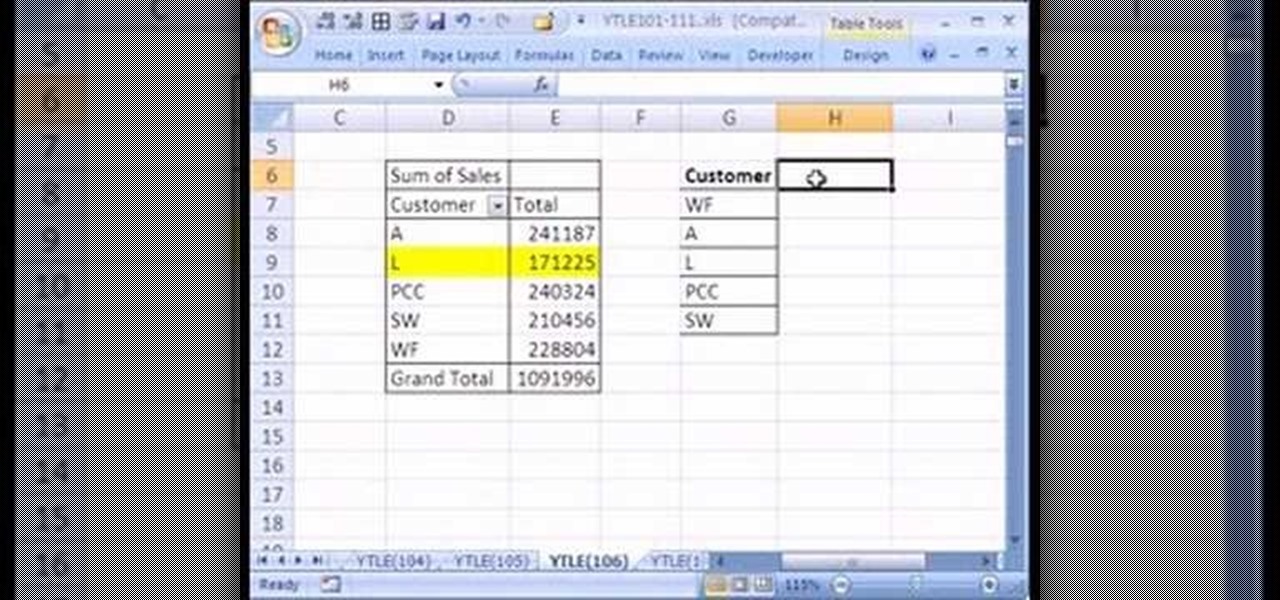
Love Microsoft Excel? This clip contains a tip that just might induce you to. With this free video tutorial from ExcelIsFun, the 106th installment of his "YouTubers Love Excel" or YTLE series of free video MS Excel lessons, you'll learn how to use two alternatives to pivot tables.
Love Microsoft Excel? This clip contains a tip that just might induce you to. With this free video tutorial from ExcelIsFun, the 102nd installment of his "YouTubers Love Excel" or YTLE series of free video MS Excel lessons, you'll learn how to count the number of days between two dates using an array formula.
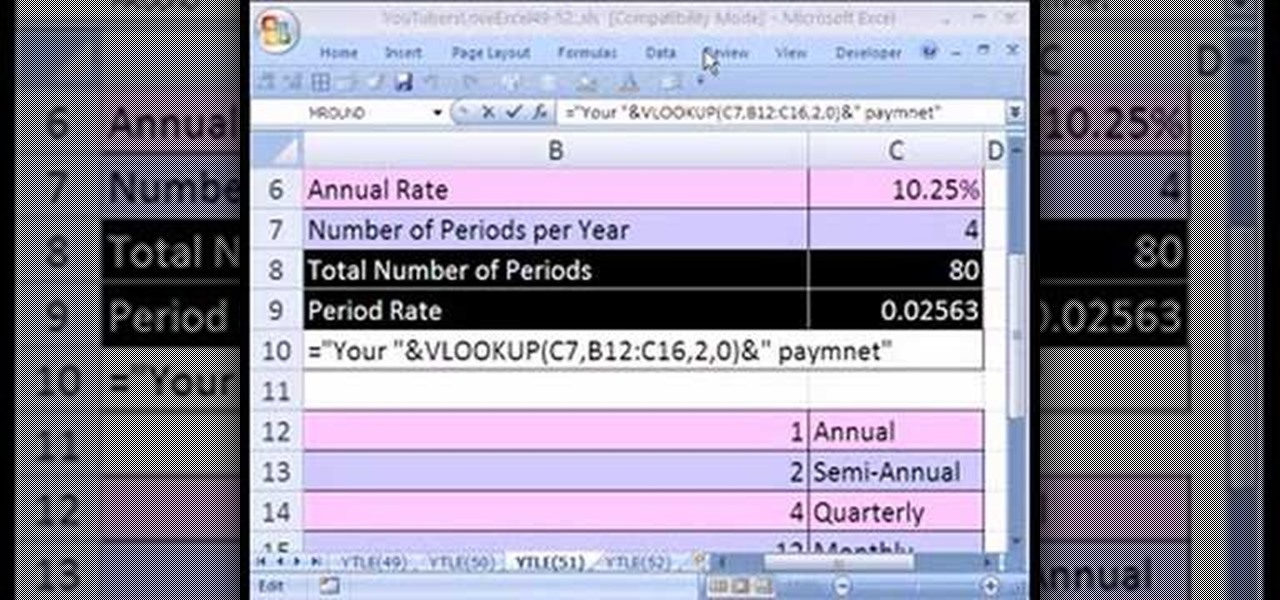
Love Microsoft Excel? This clip contains a tip that just might induce you to. With this free video tutorial from ExcelIsFun, the 51st installment of his "YouTubers Love Excel" or YTLE series of free video MS Excel lessons, you'll learn how to use a VLOOKUP function inside a Text Formula to add a variable word (e.g., Annual, Semi-Annual, Quarterly, Monthly, or Weekly).
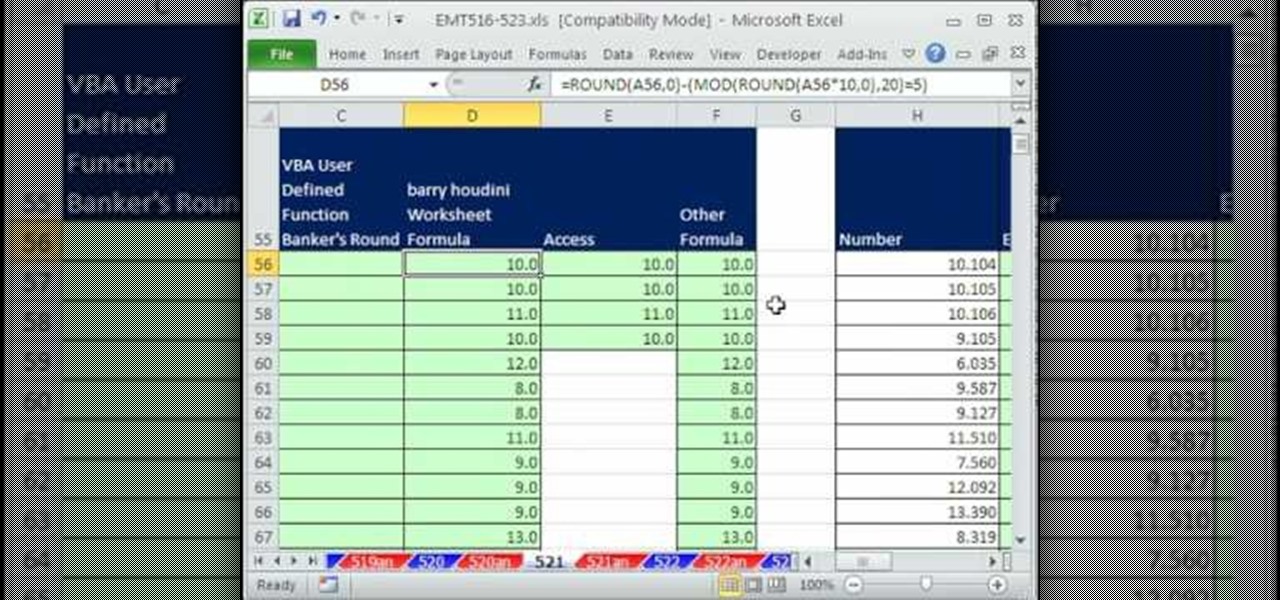
New to Microsoft Excel? Looking for a tip? How about a tip so mind-blowingly useful as to qualify as a magic trick? You're in luck. In this MS Excel tutorial from ExcelIsFun, the 521st installment in their series of digital spreadsheet magic tricks, you'll learn how to round numbers two different ways.
New to Microsoft Excel? Looking for a tip? How about a tip so mind-blowingly useful as to qualify as a magic trick? You're in luck. In this MS Excel tutorial from ExcelIsFun, the 561st installment in their series of digital spreadsheet magic tricks, you'll learn how to use the * and ? COUNTIF wildcards in Excel.