Eggplant is a great summer vegetable that's hearty enough to replace meat in some dishes! They are big and odd-looking though, and most people don't know how to tell if they're ripe and delicious. Watch this video to find out how.

If you're looking to increase the odds of pregnancy or are just looking to understand your body better, you will need to be able to understand when you're ovulating. In this video you will get basic tips and signs of when you're ovulating and how to identify some of the symptoms.

Synthesize the odds and ends in your crafts or bead drawers into lovely hoop earrings! Using a few charms, a bow, premade hoop earrings, crystals and two pieces of jewelry wire, this tutorial shows you how DIY your own fashion accessories.

Enter your kitchen and bring your laptop, cause you're going to learn how to cook some delicious halibut fish! Watch and learn how to prepare your halibut, including an odd (but yummy) nut crust (in this case, almonds). Then, move out to the patio and heat up the grill to cook the halibut to the perfect temperature atop that cedar wood plank.
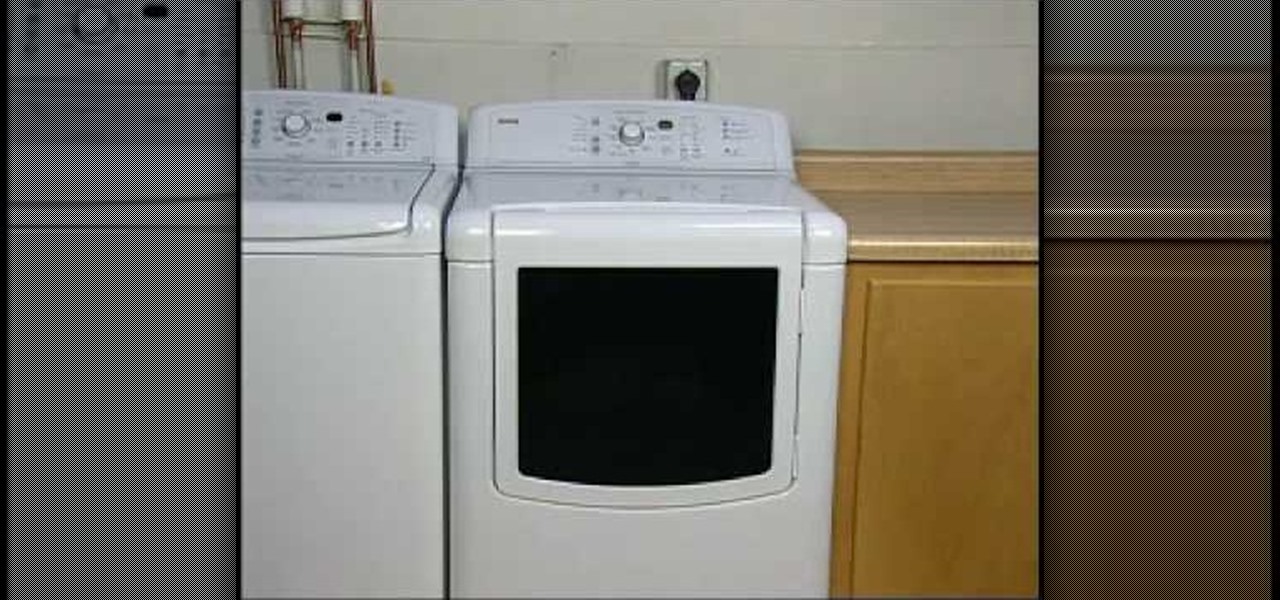
If you getting ready to place a load of wet clothes into your dyer and notice a faint smell, it may not be time to panic just yet. Even though discovering an odd odor is alarming, it isn't the end of the world.
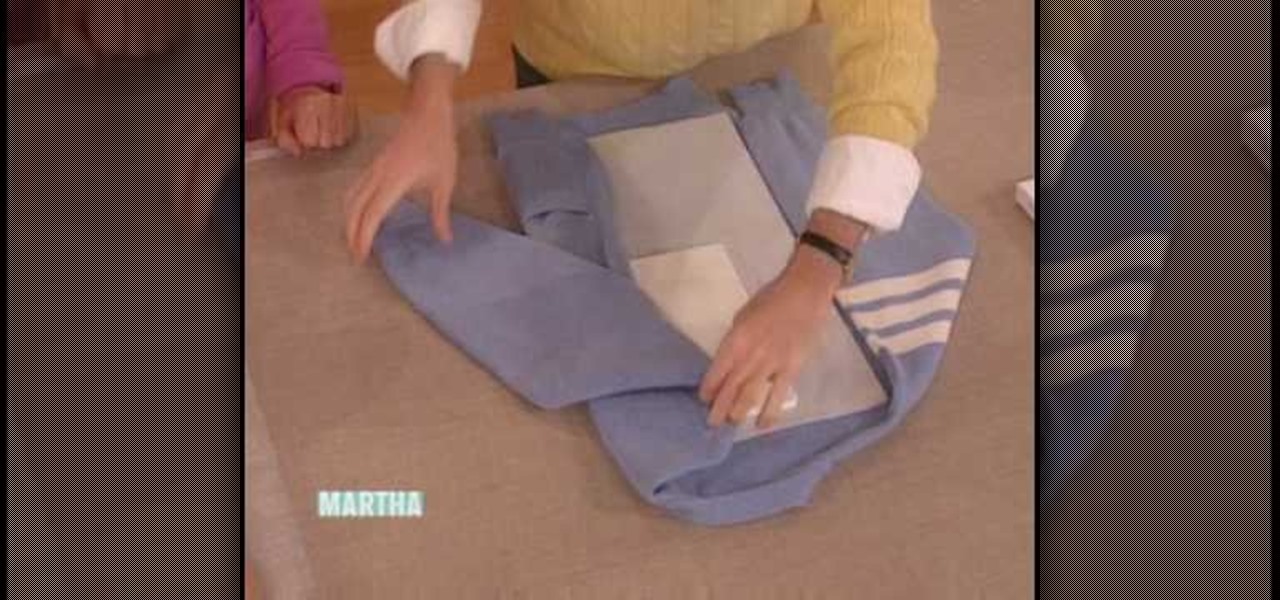
Organizing your closet can be tough work: What do you take out, what do you toss, and what do you keep and where? It's easy to just stuff all of life's little odds and ends in your closet, but you'll achieve a much more peaceful state of mind when things are in order.

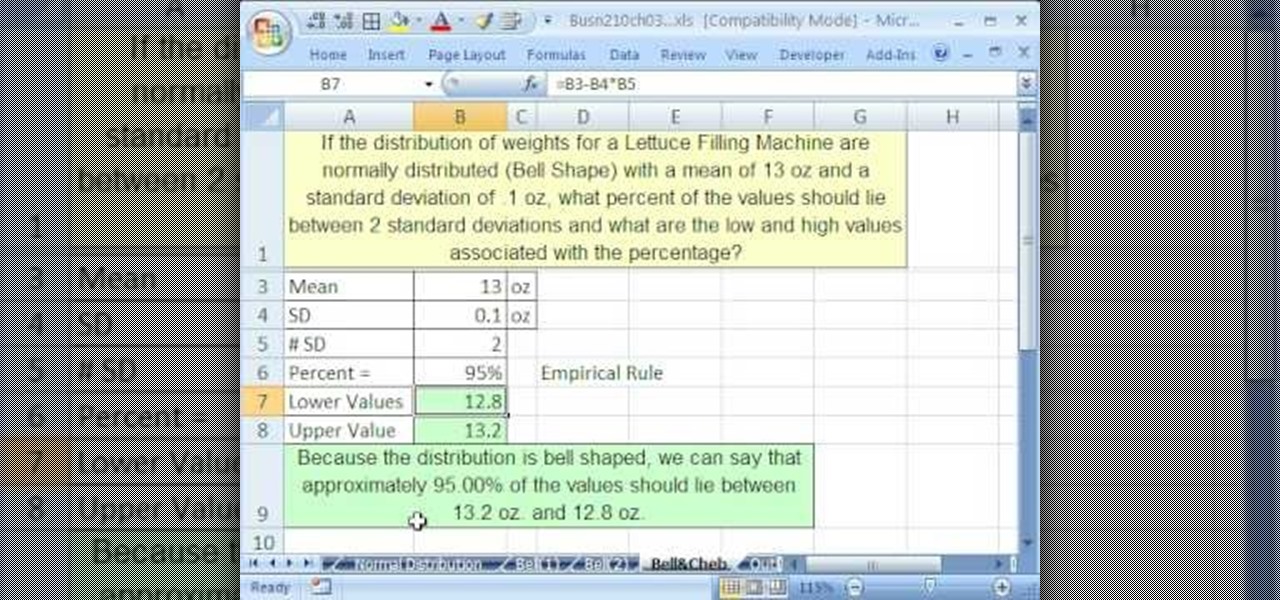
If you use Microsoft Excel on a regular basis, odds are you work with numbers. Put those numbers to work. Statistical analysis allows you to find patterns, trends and probabilities within your data. In this MS Excel tutorial from everyone's favorite Excel guru, YouTube's ExcelsFun, the 48th installment in his "Excel Statistics" series of free video lessons, you'll see comparison of Chebyshev's Theorem and the Empirical Rule (bell curve) and learn when to apply which.
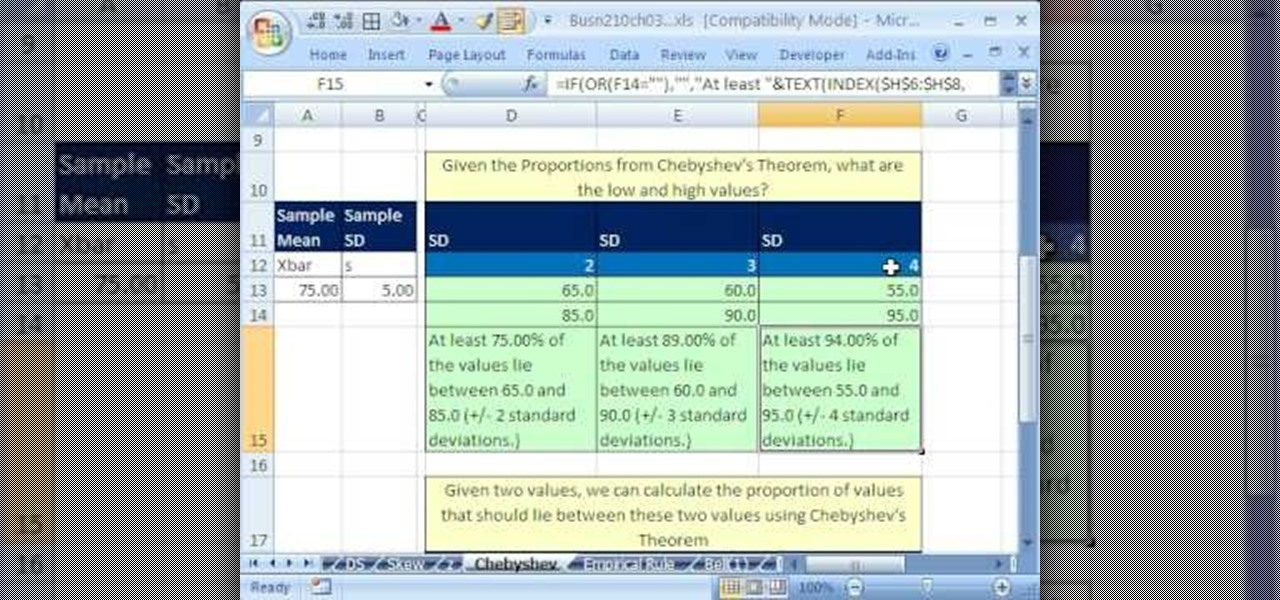
If you use Microsoft Excel on a regular basis, odds are you work with numbers. Put those numbers to work. Statistical analysis allows you to find patterns, trends and probabilities within your data. In this MS Excel tutorial from everyone's favorite Excel guru, YouTube's ExcelsFun, the 46th installment in his "Excel Statistics" series of free video lessons, you'll learn about Chebyshev's Theorem and how to apply it in three different ways.
If you use Microsoft Excel on a regular basis, odds are you work with numbers. Put those numbers to work. Statistical analysis allows you to find patterns, trends and probabilities within your data. In this MS Excel tutorial from everyone's favorite Excel guru, YouTube's ExcelsFun, the 43rd installment in his "Excel Statistics" series of free video lessons, you'll learn how to use the Excel Data Analysis add-in descriptive statistics tool.
If you use Microsoft Excel on a regular basis, odds are you work with numbers. Put those numbers to work. Statistical analysis allows you to find patterns, trends and probabilities within your data. In this MS Excel tutorial from everyone's favorite Excel guru, YouTube's ExcelsFun, the 42nd installment in his "Excel Statistics" series of free video lessons, you'll learn how to calculate the coefficient of variation.
If you use Microsoft Excel on a regular basis, odds are you work with numbers. Put those numbers to work. Statistical analysis allows you to find patterns, trends and probabilities within your data. In this MS Excel tutorial from everyone's favorite Excel guru, YouTube's ExcelsFun, the 30th installment in his "Excel Statistics" series of free video lessons, you'll learn how to create a scatter diagram for 2 quantitative variables.
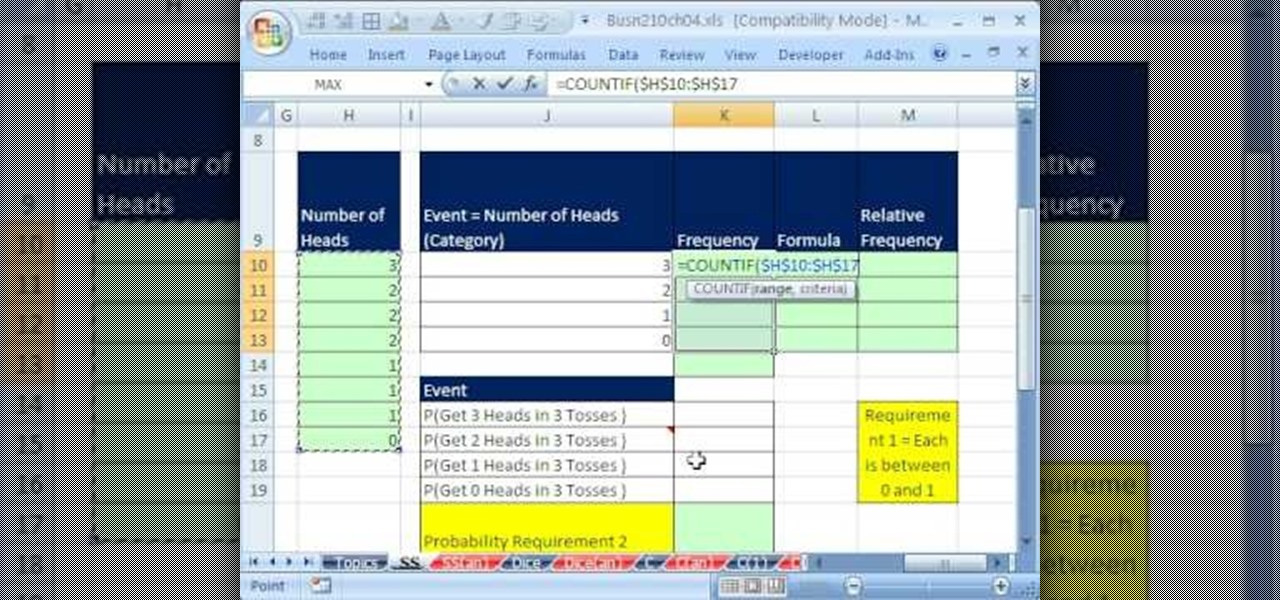
If you use Microsoft Excel on a regular basis, odds are you work with numbers. Put those numbers to work. Statistical analysis allows you to find patterns, trends and probabilities within your data. In this MS Excel tutorial from everyone's favorite Excel guru, YouTube's ExcelsFun, the 51st installment in his "Excel Statistics" series of free video lessons, you'll learn how to understand, work with and find simple probabilities in Microsoft Office Excel.
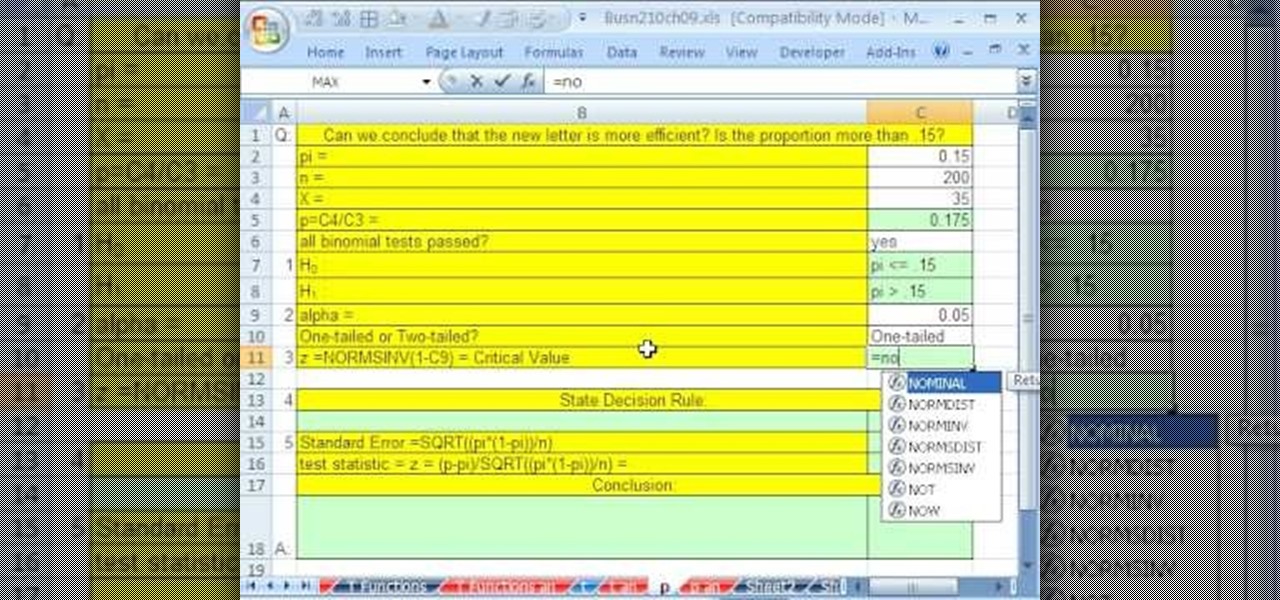
If you use Microsoft Excel on a regular basis, odds are you work with numbers. Put those numbers to work. Statistical analysis allows you to find patterns, trends and probabilities within your data. In this MS Excel tutorial from everyone's favorite Excel guru, YouTube's ExcelsFun, the 93rd installment in his "Excel Statistics" series of free video lessons, you'll learn how to use the NORMSINV and NORMSDIST functions to complete a hypothesis test about a population proportion.
If you use Microsoft Excel on a regular basis, odds are you work with numbers. Put those numbers to work. Statistical analysis allows you to find patterns, trends and probabilities within your data. In this MS Excel tutorial from everyone's favorite Excel guru, YouTube's ExcelsFun, the 83rd installment in his "Excel Statistics" series of free video lessons, you'll learn how to construct confidence intervals when the sigma (population standard deviation) in NOT known using the TINV function.
If you use Microsoft Excel on a regular basis, odds are you work with numbers. Put those numbers to work. Statistical analysis allows you to find patterns, trends and probabilities within your data. In this MS Excel tutorial from everyone's favorite Excel guru, YouTube's ExcelsFun, the 29th installment in his "Excel Statistics" series of free video lessons, you'll learn how to create quantitative data cross tabulation using a pivot table (PivotTable).
If you use Microsoft Excel on a regular basis, odds are you work with numbers. Put those numbers to work. Statistical analysis allows you to find patterns, trends and probabilities within your data. In this MS Excel tutorial from everyone's favorite Excel guru, YouTube's ExcelsFun, the 11th installment in his "Excel Statistics" series of free video lessons, you'll learn how to work with, and create charts for, cross-sectional and time-series data.
If you use Microsoft Excel on a regular basis, odds are you work with numbers. Put those numbers to work. Statistical analysis allows you to find patterns, trends and probabilities within your data. In this MS Excel tutorial from everyone's favorite Excel guru, YouTube's ExcelsFun, the 13th installment in his "Excel Statistics" series of free video lessons, you'll learn how to install the Excel 2007 Data Analysis add-in.
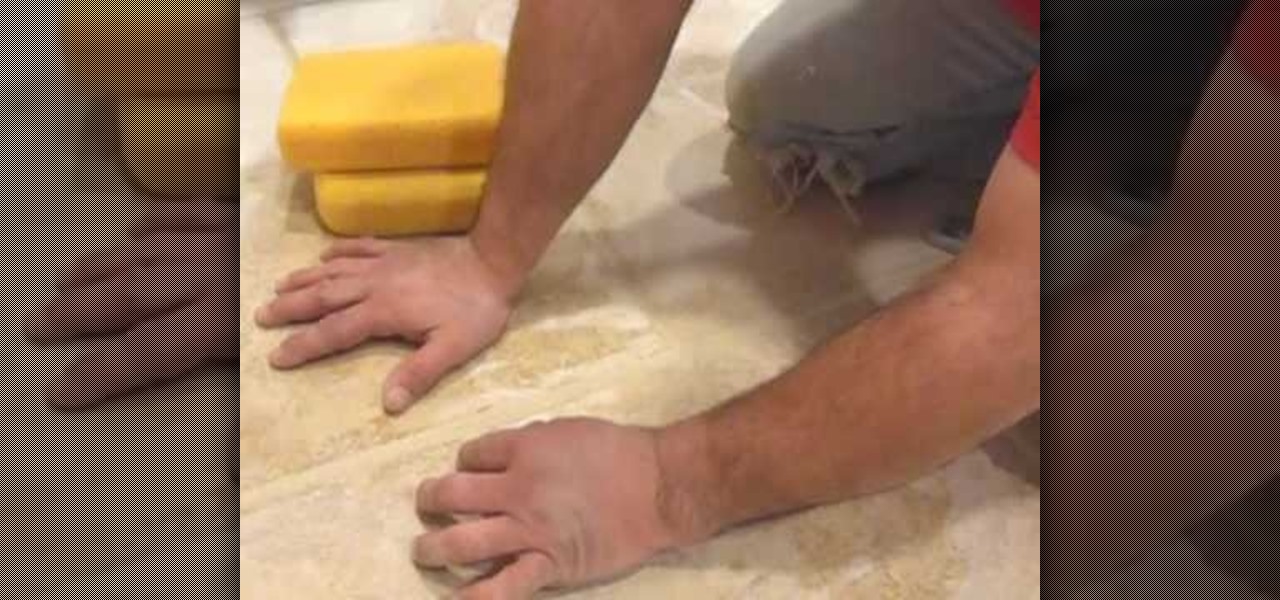
If you're undertaking a big DIY project in either your bathroom or kitchen, odds are you'll need to know how to grout ceramic tile. And, if you don't know how, you can learn with this handy how-to.
Recycle your soap odds and ends into a beautiful new bar. Learn how to make recycled soap in this instructional video.
If you've recently purchased a new, prefab computer, odds are it's loaded with things you don't need. With this helpful how-to, you'll learn how to optimize your Windows PC so as to get rid of said unwanted resource hogs. Get rid of bloatware with this video tutorial.
If you have your own domain, odds are you do things from FTP from time to time. In this tutorial, you'll learn a technique for making FTP shortcuts with the Windows HOSTS file, which will allow you to simplify the process. The time you save will be your own.
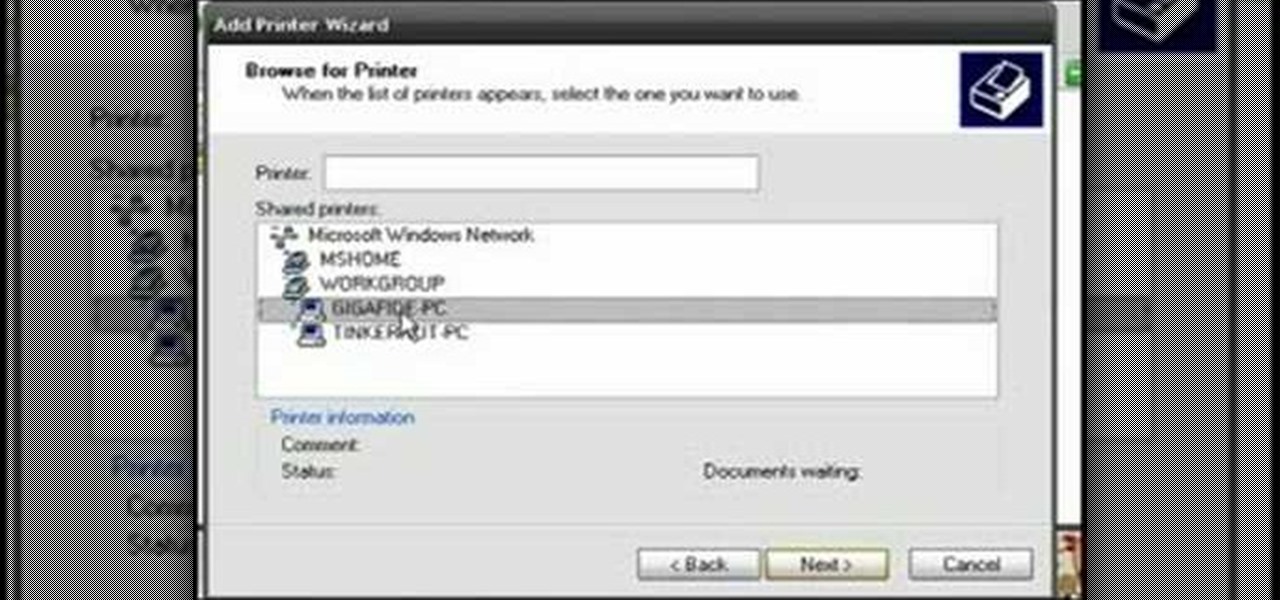
Odds are you have more computers on your network than printers. This video lays out the steps for sharing a printer over a network. This tutorial assumes that the printer is installed on another computer and not connected directly to the network. Take a look!
By performing the mirror glitch, it's possible to perform a glitch in the game aptly dubbed the reset curse in Zelda: A Link to the Past. This instructional video shows you how to perform the reset curse glitch which causes a number of odd things to occur such as the inability to pick things up and discoloration. Note that this trick only works on the Game Boy Advanced version, not the Super Nintendo.
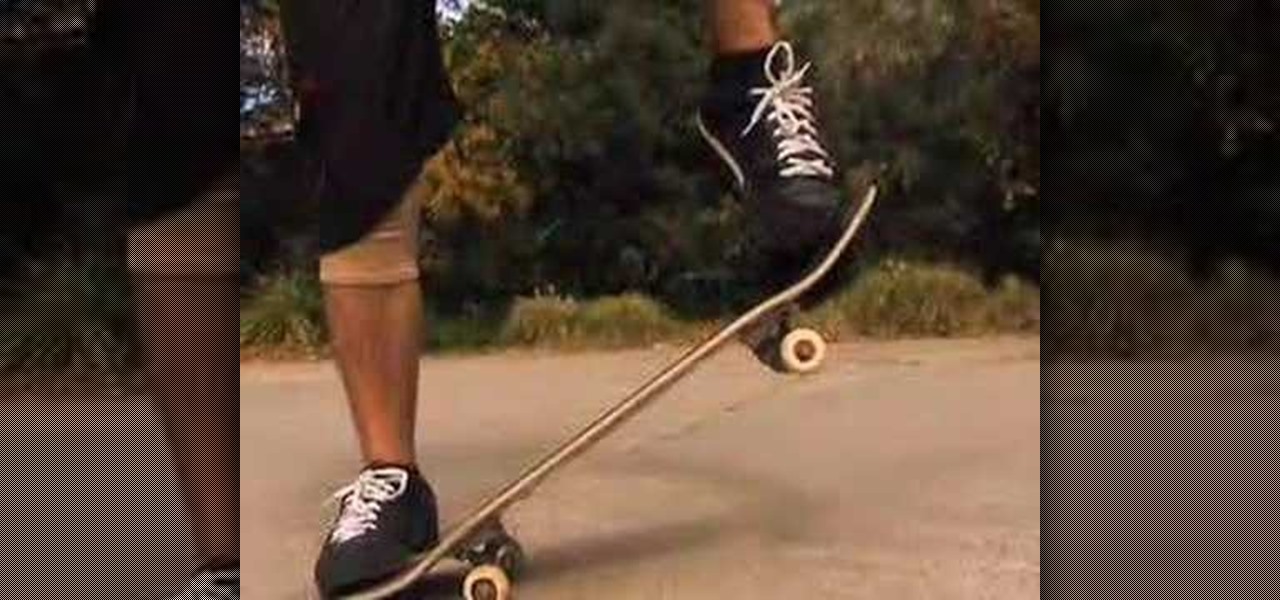
This is a quick video tutorial on how to master the basics of skateboarding. These skateboarding basics include how to maneuver, ollie and perform a pop shuvit on your board. If you know nothing about skateboarding tricks, this could be a good start for you. Learn about the trucks, the hardware, the grip, and everything else on the board. This is a great, not to mention odd, introduction to the world of skateboarding.
Learn how to play your hand in no limit Texas Hold'em after the river. Learn what strong poker players typically do and how you should react to figure out what you should do to get the best odds for winning the hand. Master the game of Texas Hold'em!
Try to guess which hand is the best before the flop, after the flop and after the river.
Whether you want to prove that you would be an awesome GM, or you’re just in it for the money, here’s how to improve your odds of winning a fantasy basketball league.
Removing/adjusting any odd shape in Photoshop is a pain in the ass. But it probably doesn't get more complicated than cutting out hair. Whether you need to trim a bit off that fro or just want to fix your hairstyle, check out this Photoshop tutorial to learn how to cut your hair using layer styles.
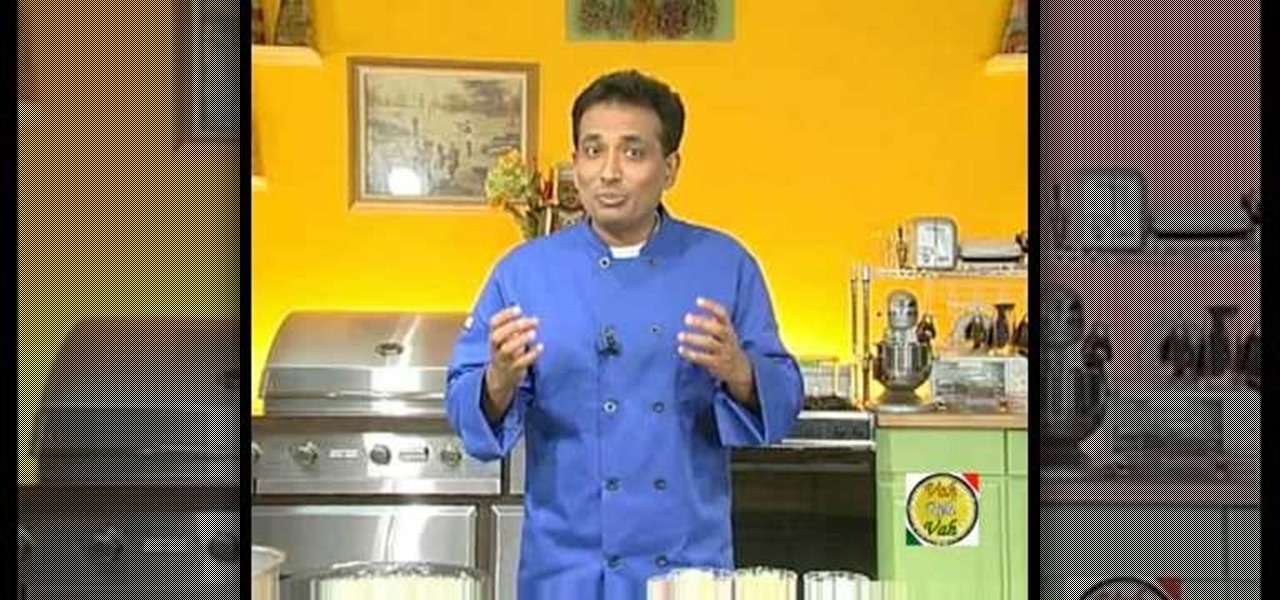
Chef Sanjay is celebrating the success of his webcast by making you one of his favorite Indian chicken dishes: chicken 65. Learn how to make it and how it got such an odd name!
Learn and understand hand match ups and the percentages of winning those hands in a Texas Hold'em game. Become the local guru and know pot odds and percentages of winning.
Are you not quite sure what slow playing mean in poker terms. You should only slow play when your hand is very strong and the odds of the next card giving your opponents a stronger hand very small. Master the art of slow playing and win more hands than before.
Watch this science video tutorial from Nurd Rage on how to compare regular ice with liquid nitrogen-cooled ice with Dr. Lithium.
If you've ever been taking pictures and have suddenly noticed an odd white line in your pictures, it's called "Spray Light" and it happens when light enters into the viewfinder while the picture is developing. This video teaches you why it's important to use the viewfinder cover or curtain to avoid this serious problem!
If you use Microsoft Excel on a regular basis, odds are you work with numbers. Put those numbers to work. Statistical analysis allows you to find patterns, trends and probabilities within your data. In this MS Excel tutorial from everyone's favorite Excel guru, YouTube's ExcelsFun, the 92nd installment in his "Excel Statistics" series of free video lessons, you'll learn how to use the TINV and TDIST functions to test a hypothesis.
If you use Microsoft Excel on a regular basis, odds are you work with numbers. Put those numbers to work. Statistical analysis allows you to find patterns, trends and probabilities within your data. In this MS Excel tutorial from everyone's favorite Excel guru, YouTube's ExcelsFun, the 85th installment in his "Excel Statistics" series of free video lessons, you'll learn how to construct confidence intervals for proportions using NORMSINV function and other formulas.
I know it sounds odd, but not every bit of action in a film takes place during the day. Sometimes it's necessary to shoot some scenes at night. This instructional video explores the basics of lighting for a nighttime shoot.
This is an odd how-to on doing up your upper lip with the hippest of new accessories: the mustache.
Been trying for those 6-pack abs without much success? According to oodelboxTV fitness guru Wes Cole, odds are you aren’t working out the correct type of muscle fibers. What? Watch and learn what that means AND how to get a brick belly.
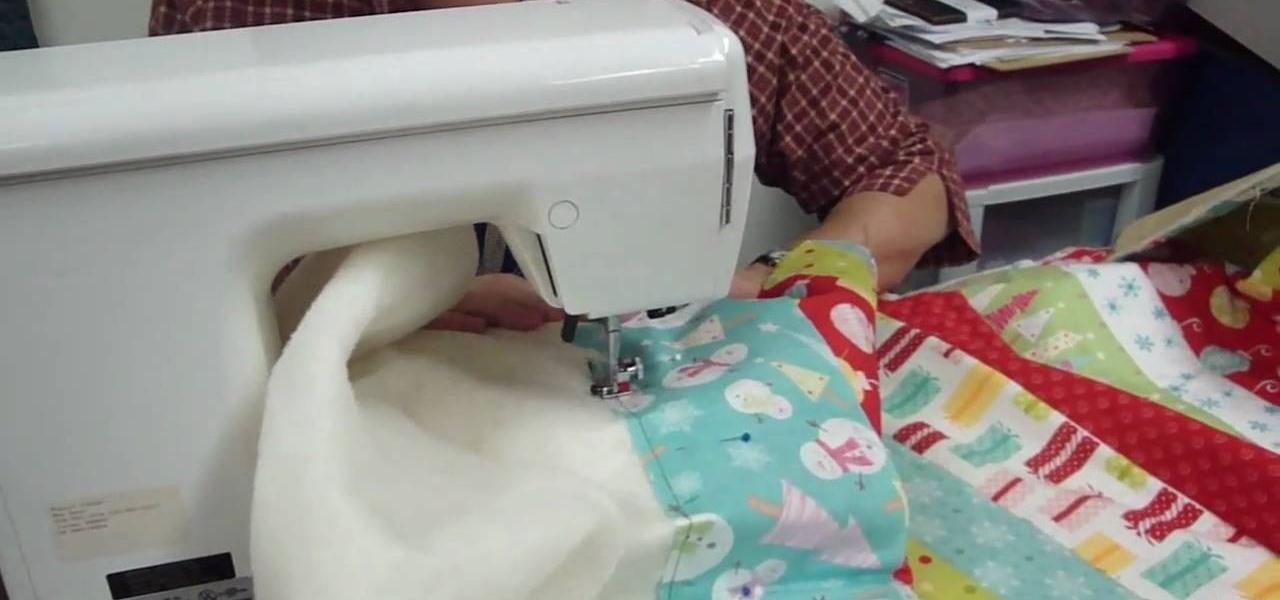
Looking for a new way to do your quilting? Why not try the 'quilt as you go' method! With this method you don't finish the whole piece at one time, but instead take various pieces of fabric and use them one by one. This is a great method if you happen to have a big bag of fabric odds and ends you didn't know what to do with. You'll need a piece of backing, thread, pins and of course a sewing machine. Watch and learn how to quilt as you go!
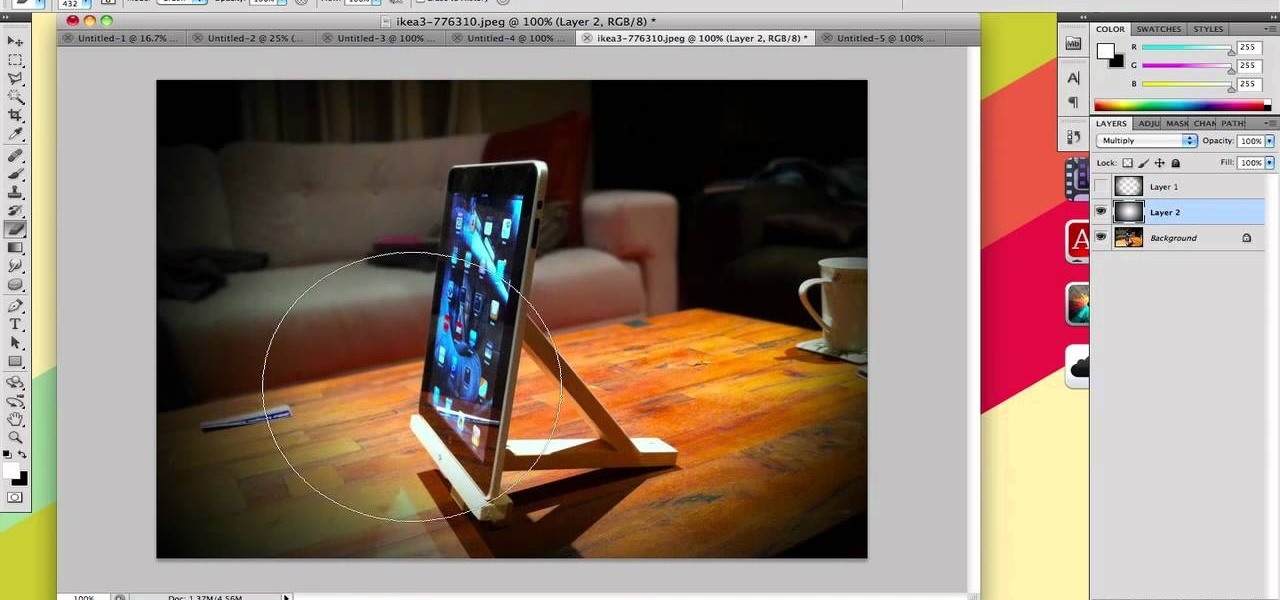
If you take a lot of photos with your smartphone or cheap digital camera, you can see the difference compared to results from a pro camera. So, if you want to get a professional camera look without dropping the money, check out this video to learn how to enhance your pics. This trick works with Photoshop, or any photo editing software that has a selection tool, a gradient tool and a gaussian blur filter.