Recording professional-sounding music at home is cheaper and easier than ever before, but still neither cheap nor easy compared to, say, grilled-cheese-sandwich-making. If you need some help getting started watch this video, which will teach you all about mics, cables, digital interfaces, and the other elements of the modern home recording studio.

This is actually quite amazing. If you own an HTC DROID ERIS cell phone, then that cardboard container it came in can be turned into that tiny, but terrific Google Android Bot. The Android Bot logo is known across the world now, and it's odd that their box can be broken down perfectly to recreate it. Was this on purpose, or accident? Anyway, Nextraker found the secret, and he's going to show you how it's down. With just a few basic cuts, you too can have your own little green Bot.
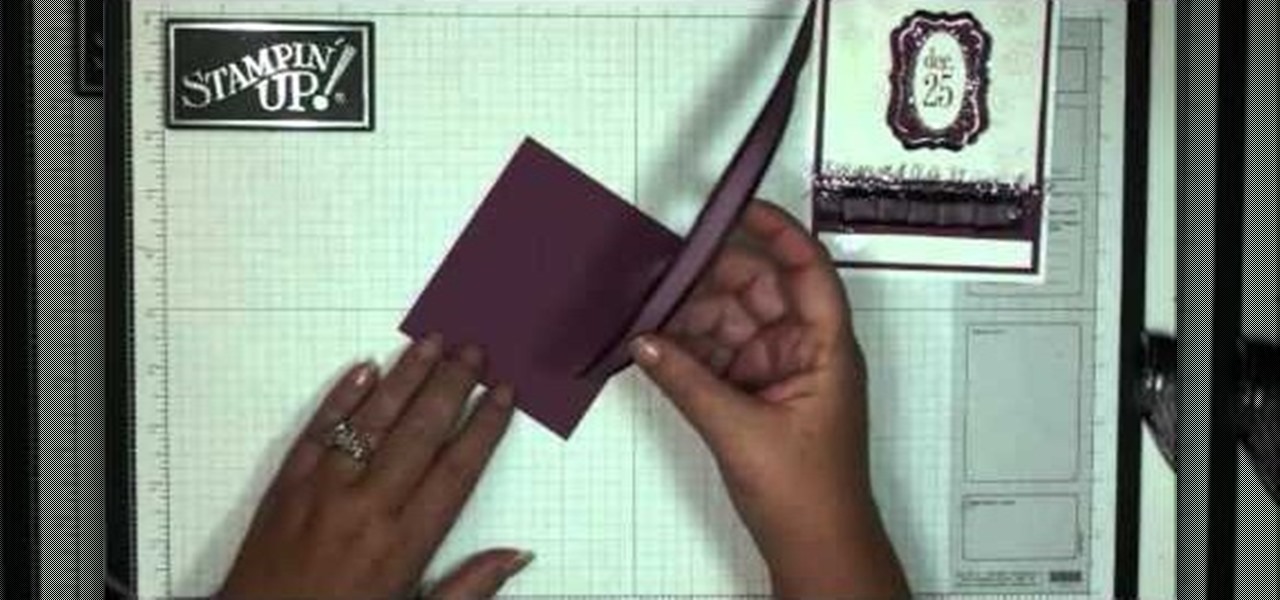
This by far one of the most elegant and beautiful cards we've ever seen in a card making tutorial, and we've seen a lot of cards. Rather than tacking on cheesy mass-produced floral prints and little butterflies and other odds and ends that just distract, this Christmas card focuses on minimalist beauty.

This video will teach and demonstrate the thyroid status assessment and thyroid gland examination in a patient. As a doctor, you will, at some point in your career, need to examine the thyroid gland in a patient's neck, and some other parts of the body which are effected by the thyroid.

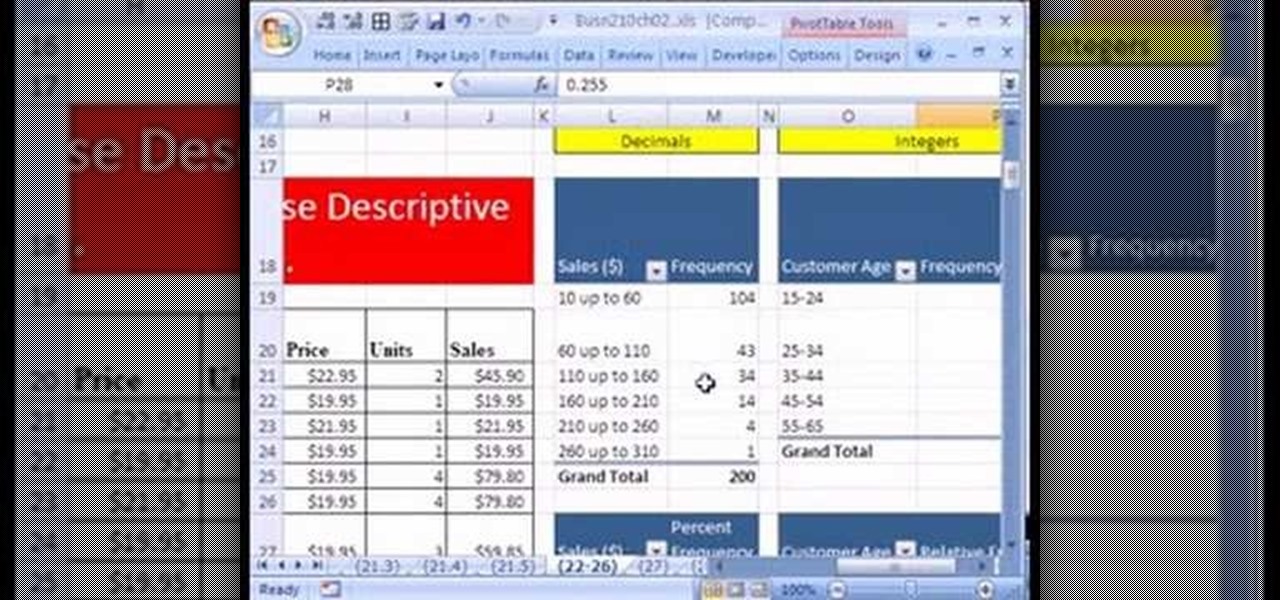
If you use Microsoft Excel on a regular basis, odds are you work with numbers. Put those numbers to work. Statistical analysis allows you to find patterns, trends and probabilities within your data. In this MS Excel tutorial from everyone's favorite Excel guru, YouTube's ExcelsFun, the 24th installment in his "Excel Statistics" series of free video lessons, you'll learn how to create quantitative data frequency distributions with pivot tables. See how to create the correct unambiguous labels ...

If you use Microsoft Excel on a regular basis, odds are you work with numbers. Put those numbers to work. Statistical analysis allows you to find patterns, trends and probabilities within your data. In this MS Excel tutorial from everyone's favorite Excel guru, YouTube's ExcelsFun, the 12th installment in his "Excel Statistics" series of free video lessons, you'll learn how to use Advanced Filter 'Unique Records Only" to extract a list of unique items from a data base, and then use the COUNTI...

Learn how to juggle three balls in this video tutorial! Jason Garfield is one of the best professional jugglers in the world, especially when it comes having a disciplined technical form. He has won the advanced ball competition (5 - 7 balls) several years in a row now. This video is good because it will teach you the best posture and techniques for juggling from day one, so you will ready if you want to move to more advanced patterns.
We we first started playing the piano, we thought every scale other than the C major scale was just too darn difficult. Too bad we didn't have this clever video to help us out!
In this video I go over an odd subject, I go over how I Draw a Vampire Child. I make it a relatively simple sketch. Easy things to Draw. Drawing Sites will be great. For more videos go to my blog : http://howtodrawfantasyart.blogspot.com/
This is a video tutorial in the Education category where you are going to learn how to compare 2 distributions with the Z-Score formula. In this example Doug's class has X bar as 71 and a standard deviation of 4. Corey's class has X bar as 68 and a standard deviation of 11. If both Doug and Corey beat the class average and have the same standard score, will Doug have a lower grade than Corey? If both of them have a standard score of 1.5, then Doug will get 77 marks and Corey will get 84.5 mar...
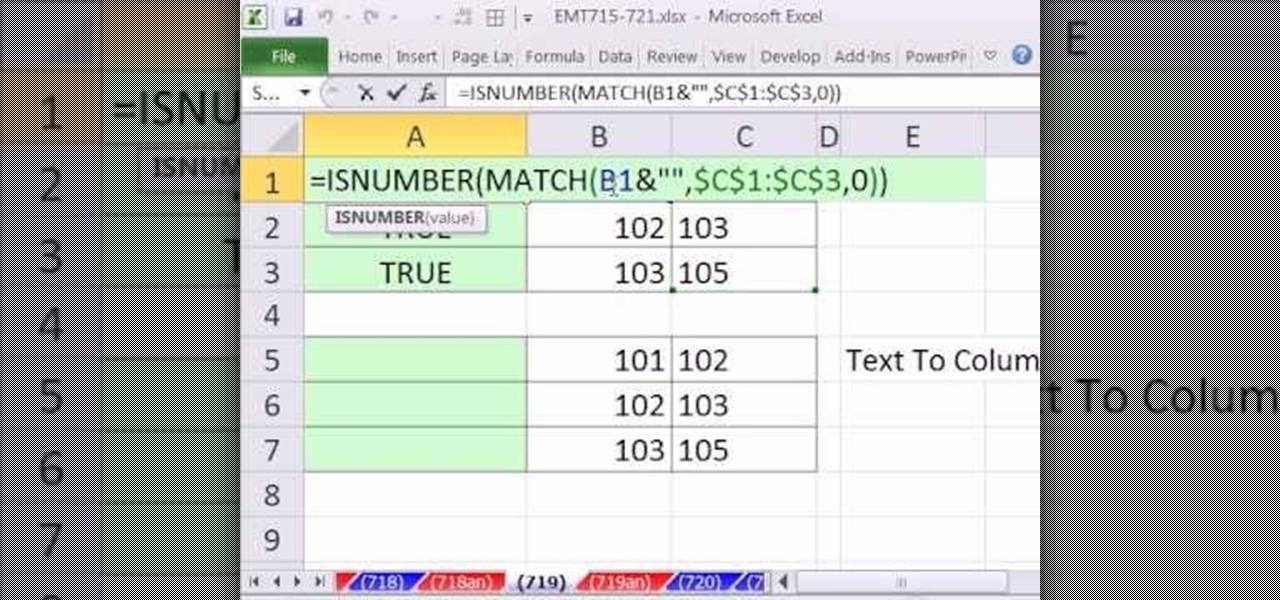
New to Microsoft Excel? Looking for a tip? How about a tip so mind-blowingly useful as to qualify as a magic trick? You're in luck. In this MS Excel tutorial from ExcelIsFun, the 719th installment in their series of digital spreadsheet magic tricks, you'll learn how to compare two list of numbers and see what happens when one list is numbers is aligned right and the other list is numbers as text.
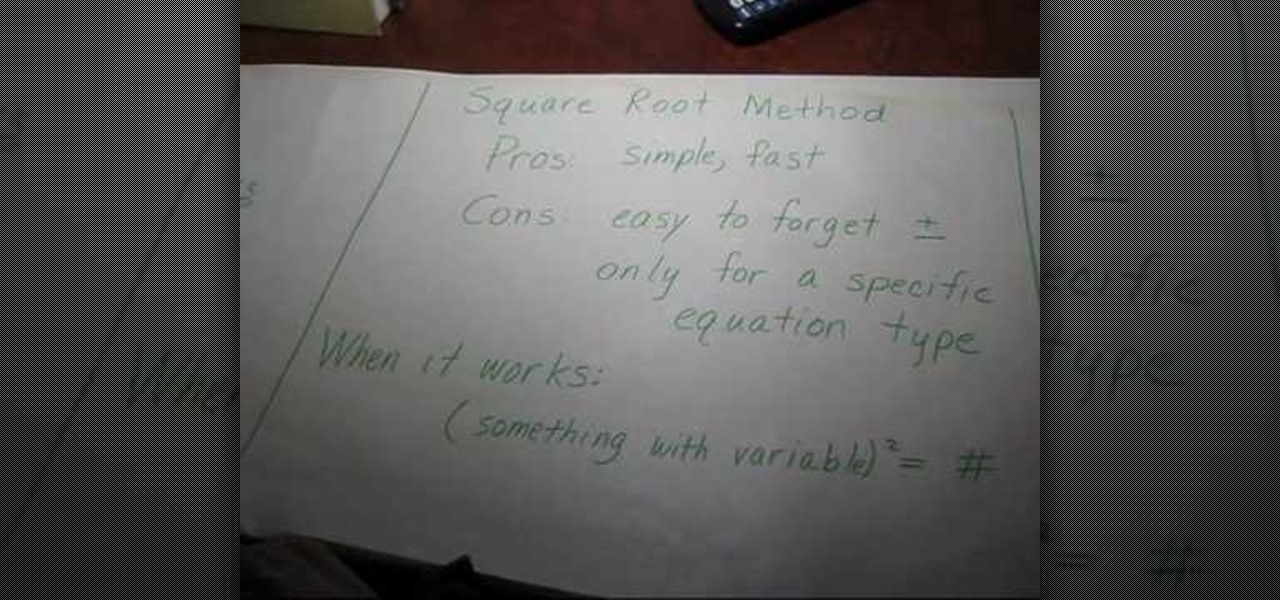
In this video the instructor shows the different methods of solving quadratic equations. There are many methods to solve quadratic equations each with its pros and cons, each method suitable for a particular situation. The first method to solve quadratic equation is factoring. The advantage of using this method is that it is quick and easy. But the problem is not all equations can be factored very easily. This method requires a lot of practice and intuition. Use this method when the discrimin...
robichaudd teaches you how to simplify square roots. When you're dealing with variables, even powers and you want to find out the square root of it, you follow the process. Divide the power by the root, which is two, because it's a square root, that gives you what comes out. If we have square root of x squared, the result would be x. So the square root of x to the 6 is x cubed. You simply divide the power by two, since we are dealing with square root. Then square root of 36 times x square is ...
Does size really matter in plugs and rings? If you don't want a blow-out, definitely. Be safe.
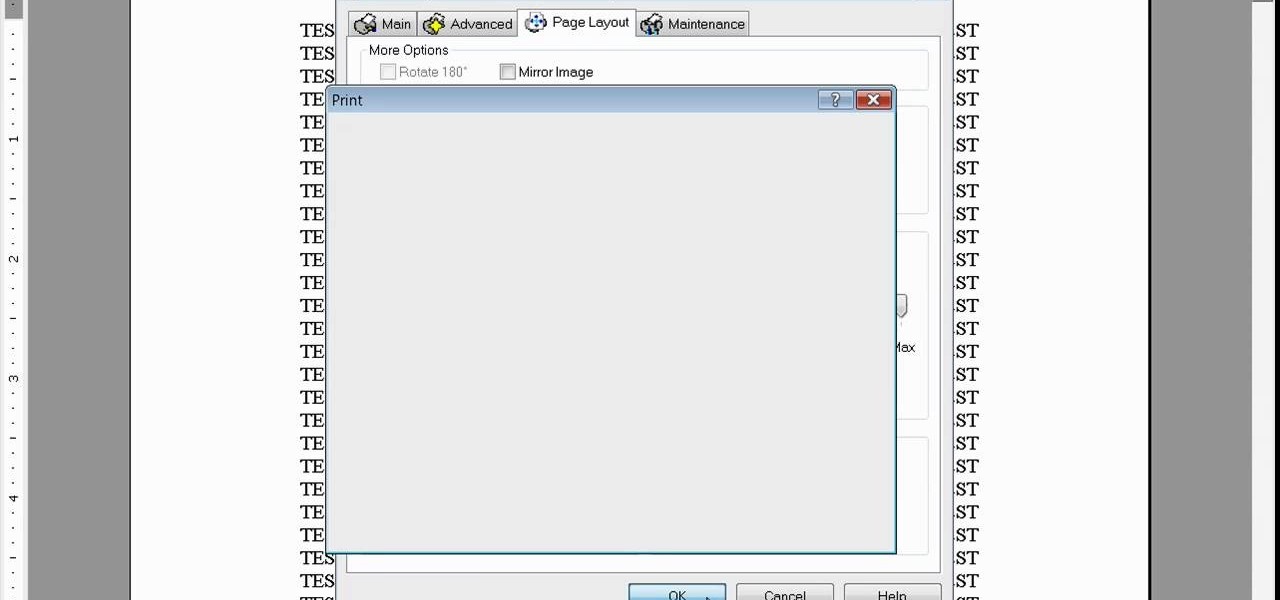
Learn how to print double-sided and reverse printing order in Microsoft Word. * Go to the Start menu and open Microsoft Word.
Shopping for a new phone is an entire ordeal. Even when you've narrowed it down to a few choices, comparing the finalists can be difficult, because specs and prices are scattered around on various different manufacturer websites, and if you're trying to do this on your current phone, most of these websites aren't optimized for mobile viewing.
Here's a neat little demonstration video on how to draw a Christmas tree using a pencil, an eraser and pen. This tree will be drawn with a more realistic looking drawing style, compared to the simplified abstract stack of triangles that people normally draw Christmas trees with. British children's author Shoo Rayner, writer and illustrator of over 200 books, shows you how.
Dia de los Muertos is the much more meaningful Mexican holiday that many Americans compare with Halloween because of it's nefarious imagery and it's inclusion of delicious sugar skulls. In this video you'll learn how to combine the two by dressing as a Dia de los Muertos sugar skull for Halloween.
During the Fall 2010 runway shows there were a bunch of crazy makeup looks, but perhaps the most unique look was the two-tone lipstick worn by models on the Nanette Lepore catwalk.
These hot dog cutting projects are the perfect "crafts" to practice on a rainy day. From making spiny hot dog balls to an octopus with funny curled tentacles, these hot dog projects are a delight to make and to eat, since you'll be deep frying them.
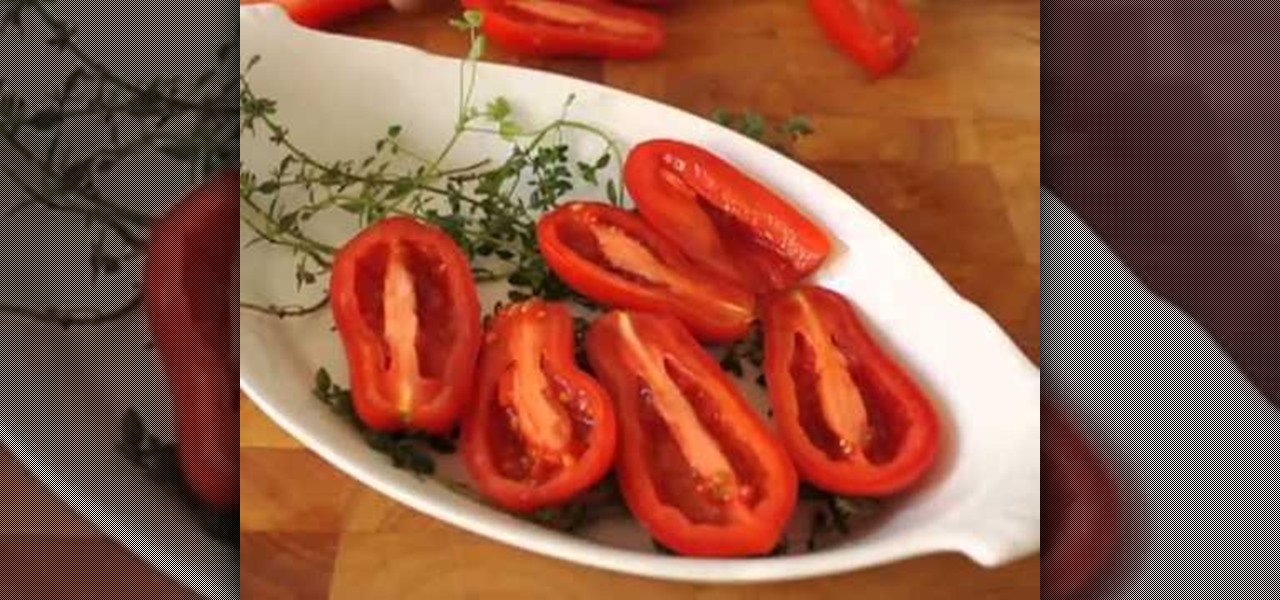
We always cringe when we see that a recipe calls for sundried tomatoes. Not that we have anything against tomatoes, but the sundried and preserved kind is all wrinkly, odd tasting, and too sterile. These oven-dried tomatoes, however, are incredibly delicious.
Root beer has a bunch of yummy functions, though usually they involve ice cream sodas. But there's more than just one way to enjoy this delicious carbonated drink. It may seem odd at first, but you can actually use root bear to create a glaze for cakes.
It's pretty odd that summer's hottest braided hairstyles are modeled after fish tails, given that fish don't possess much hair of their own. Either way, the fishtail braid/plait is a sexy look for everyone, especially adult women who want to wear braids without looking like Pippi Longstocking.
These days it seems like budgets are on everybody's minds. Big or small, financial planning is an essential part of daily life following the latest recession. In this tutorial you will learn how to create budget resources, using MS Project 2007, that you can assign to your project to compare you actual hours and costs against your budget.
Having a congo drum there for those impromptu African dance groove sessions at your pad is a smart idea, but authentic drums are quite costly.
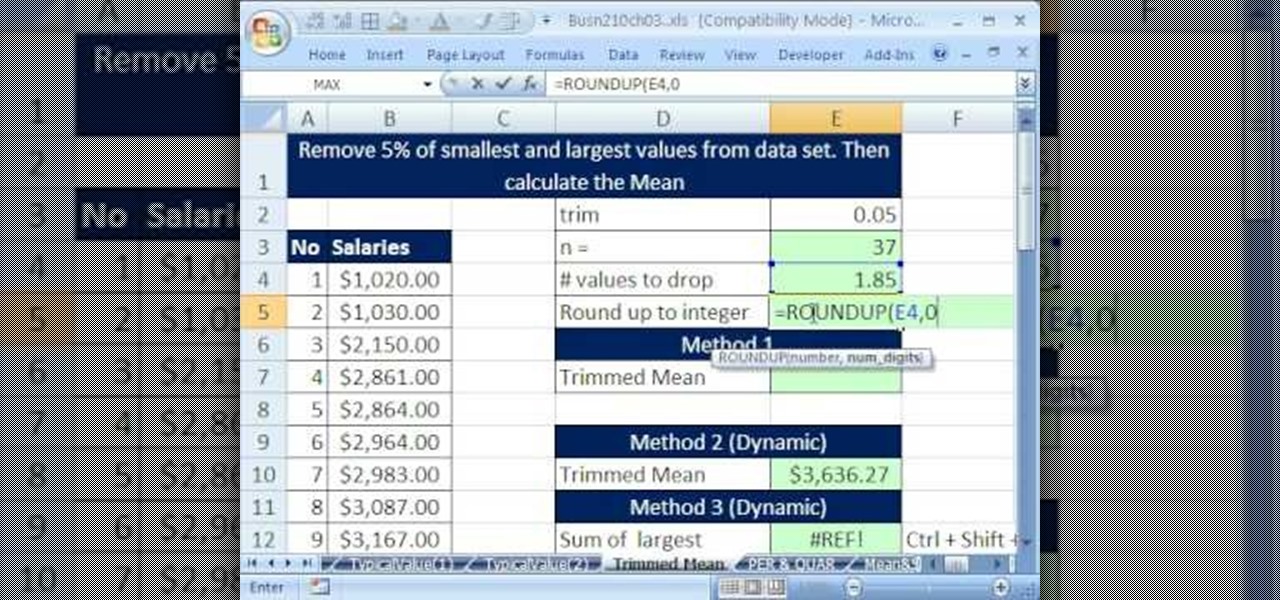
If you use Microsoft Excel on a regular basis, odds are you work with numbers. Put those numbers to work. Statistical analysis allows you to find patterns, trends and probabilities within your data. In this MS Excel tutorial from everyone's favorite Excel guru, YouTube's ExcelsFun, the 36th installment in his "Excel Statistics" series of free video lessons, you'll learn how to calculate a trimmed mean, which is used when there are extreme values in the data set that might skew the mean.
If you use Microsoft Excel on a regular basis, odds are you work with numbers. Put those numbers to work. Statistical analysis allows you to find patterns, trends and probabilities within your data. In this MS Excel tutorial from everyone's favorite Excel guru, YouTube's ExcelsFun, the 39th installment in his "Excel Statistics" series of free video lessons, you'll learn about variability (or dispersion or spread). Create an X-Y Scatter Diagram chart showing data points and the mean.
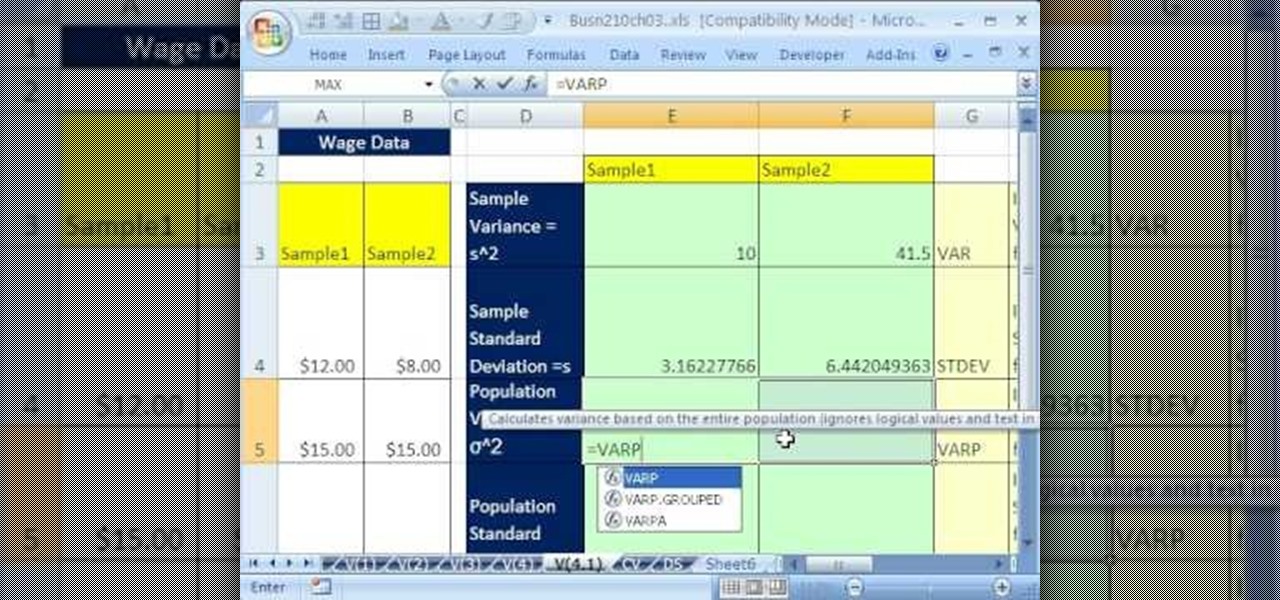
If you use Microsoft Excel on a regular basis, odds are you work with numbers. Put those numbers to work. Statistical analysis allows you to find patterns, trends and probabilities within your data. In this MS Excel tutorial from everyone's favorite Excel guru, YouTube's ExcelsFun, the 41st installment in his "Excel Statistics" series of free video lessons, you'll learn how to calculate deviations, variance and standard deviation for a sample and a population using Excel tables and the VAR, S...
If you use Microsoft Excel on a regular basis, odds are you work with numbers. Put those numbers to work. Statistical analysis allows you to find patterns, trends and probabilities within your data. In this MS Excel tutorial from everyone's favorite Excel guru, YouTube's ExcelsFun, the 32nd installment in his "Excel Statistics" series of free video lessons, you'll learn how to group when the quantitative data are whole numbers, integers or discrete data and how to group when the quantitative ...
If you use Microsoft Excel on a regular basis, odds are you work with numbers. Put those numbers to work. Statistical analysis allows you to find patterns, trends and probabilities within your data. In this MS Excel tutorial from everyone's favorite Excel guru, YouTube's ExcelsFun, the 25th installment in his "Excel Statistics" series of free video lessons, you'll learn how to create quantitative data percent & relative frequency distributions with pivot tables. Also see how to create a histo...
If you use Microsoft Excel on a regular basis, odds are you work with numbers. Put those numbers to work. Statistical analysis allows you to find patterns, trends and probabilities within your data. In this MS Excel tutorial from everyone's favorite Excel guru, YouTube's ExcelsFun, the 22nd installment in his "Excel Statistics" series of free video lessons, you'll learn how to create a percent (%) cumulative frequency distribution with formulas, a histogram and an ogive chart. See how to add ...
If you use Microsoft Excel on a regular basis, odds are you work with numbers. Put those numbers to work. Statistical analysis allows you to find patterns, trends and probabilities within your data. In this MS Excel tutorial from everyone's favorite Excel guru, YouTube's ExcelsFun, the 10th installment in his "Excel Statistics" series of free video lessons, you'll learn how about data sets and the nominal, ordinal, interval and ration scales/levels of measurement and see two Pivot Tables that...
In this video tutorial, learn how to add your Playstation 3 activities to your Facebook newsfeed. By doing this, you can share three things on Facebook: Your Playstation trophy information, purchase information, and game event information... all while you compare yourself to those friends on Facebook that are signed up as well. Get your PS3 on Facebook and let the world know how you're kicking Playstation's ass.
The odds are that you'll never find yourself being held prisoner with your hands bound together with zip ties. But if you ever are, you'll be very grateful for the info you learned from this video. In this tutorial from the folks at ITS Tactical, you'll learn how to escape from zip ties using shims. You can use all sorts of things for shimming, from professional equipment to your own fingernails.
See how to avoid rejection on the singles scene! When it comes to putting the moves on someone, no one can make themselves rejection-proof. But you can increase the odds of a good outcome.
Turn mealtime odds and ends into a hearty—and tasty—soup. This is a cost efficient way to prepare a yummy meal.
Need to spruce up (or wreath up) your trailer for the holidays? For this Christmas in your trailer park, let Jolene Sugarbaker show you how to make a classic trailer park Christmas craft... the wreath. This video will show you how to turn ordinary dryer sheets into a festive holiday wreath.
These two Houdini 9 lessons illustrate a valuable and efficient means of modeling an animated surface in a manner not generally considered. It provides an explanation of the advantages to this approach and compares it to a more traditional means of animating a surface. So watch the tutorial and learn how to animate a stingray in Houdini 9 using newer style animation methods.
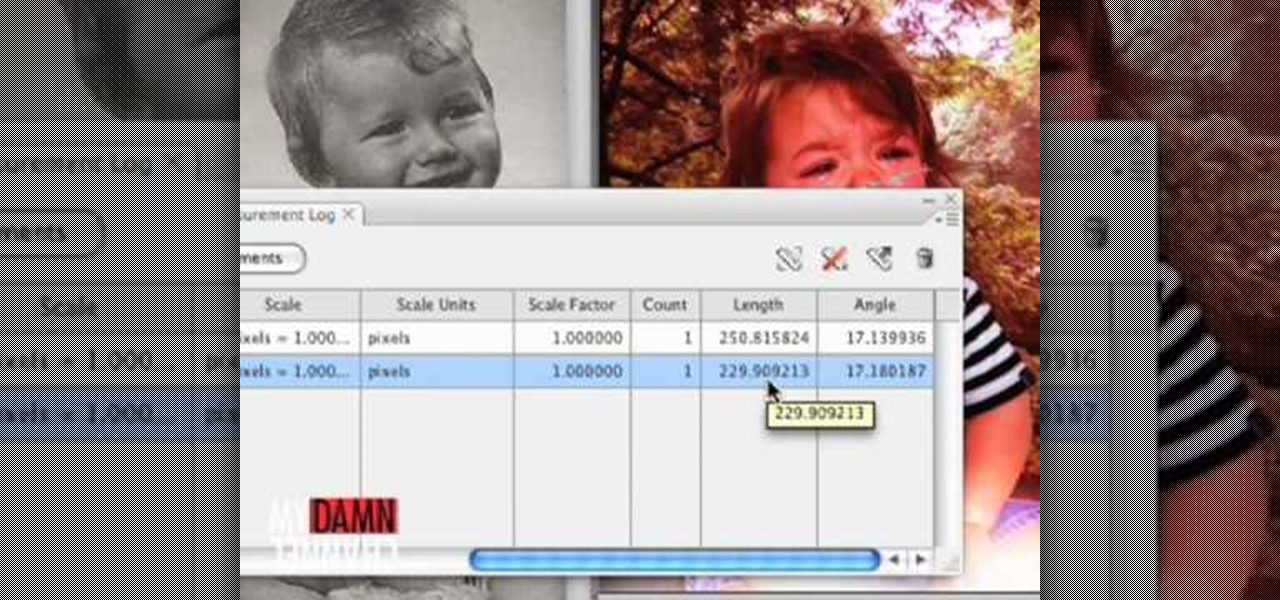
Donnie Hoyle sizes himself up against some old memories. Size yourself up too by learning how to not suck at Photoshop and use the measurement log. The measurement log in Photoshop allows you to click and drag from point to point and take the measurements of things. In this example, you learn to use the measurement log to compare similarities and differences in the faces of a dad and his son.
In Aperture, you can easily select multiple images to view them side by side. this convenient feature makes it easy to compare images and to make changes to a group of images simultaneously.