

How To: Use stacks in Aperture
To help you compare and manage groups of similar shots or of images shot in a rapid sequence, Aperture provides stacks, an organizational tool that allows you to group related images.

To help you compare and manage groups of similar shots or of images shot in a rapid sequence, Aperture provides stacks, an organizational tool that allows you to group related images.

In addition to stacks, Aperture also provides a special stack mode that lets you easily compare all of the images in a stack to determine which one you want to be the pick.
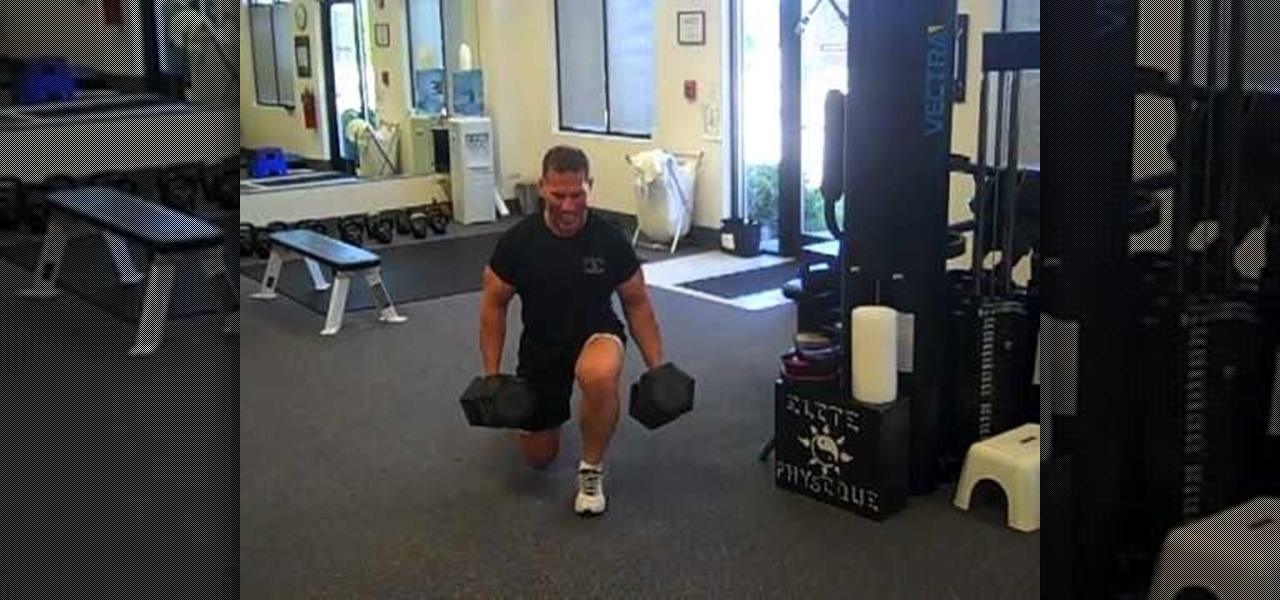
Want buff, fat-free legs that would put the Incredible Hulk to shame? Then lunges are your new best friend. While basic lunges work and are great for sculpting your entire leg, adding weights makes you work your core out more and causes your quads to really strain to get yourself up.
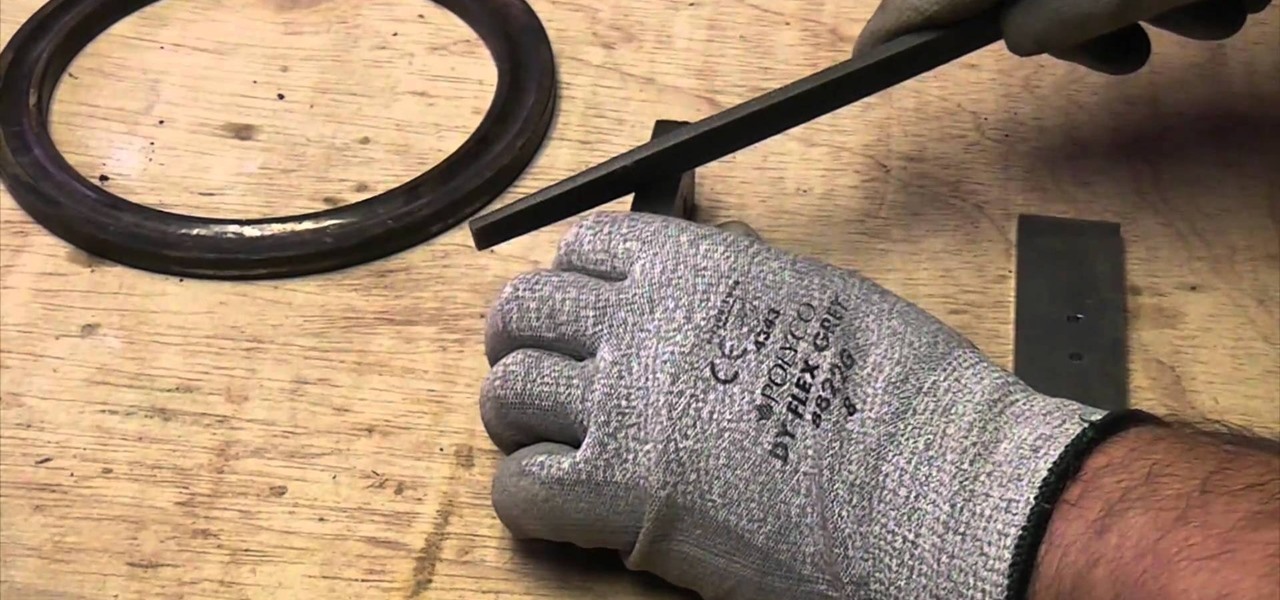
Hardened steel is very durable, but nearly impossible to work with at home. If you are trying to choose a piece of steel and can't tell if it's hardened or not, you're in luck, because this video contains a quick method for doing so. All you do is try to file an indentation in the steel with a file. If that doesn't make a mark, you've probably got hardened steel.
In this tutorial, we learn how to stop being a hypochondriac naturally. Your first step is to put your worry down, and take control of your life. Know that the chance of you catching a disease is small, and you have a full life to live. Ignore your anxieties, fall back to the principles that you are healthy, and live a healthy life. The odds will be in your favor if you take it slow and focus on living a healthy life instead of focusing on the problems and negative thoughts. Don't look up sym...

You've probably seen old t-shirts being turned into dresses, miniskirts, and if you're a fan of Gianny L, even two-piece bikinis, but you've probably never even thought about it transforming them into underwear. It may seem a bit odd at first, but making these intimate pieces from t-shirts means you can customize the pattern as well as the type of cut (cheeky, granny top, or thong?).

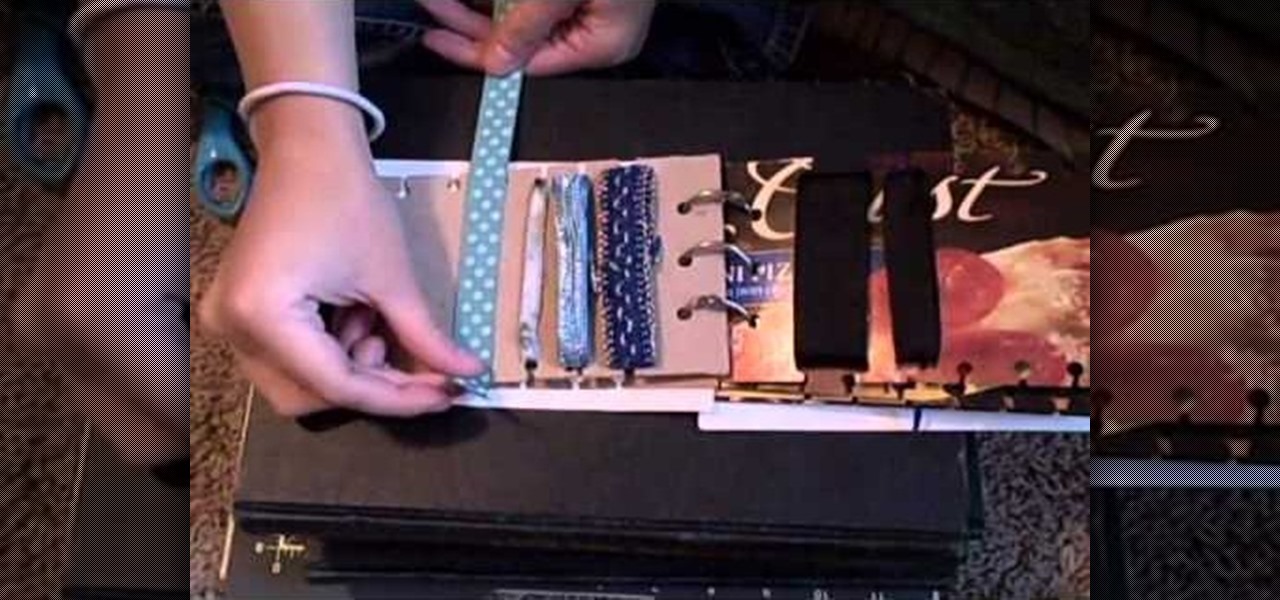
Seriously gals, how easy is this? Unless you're a bum living in a box under a bridge, you can probably muster up the simple tools needed to make this makeup organizer. All you need is Elmer's household cement and six office stamper covers.
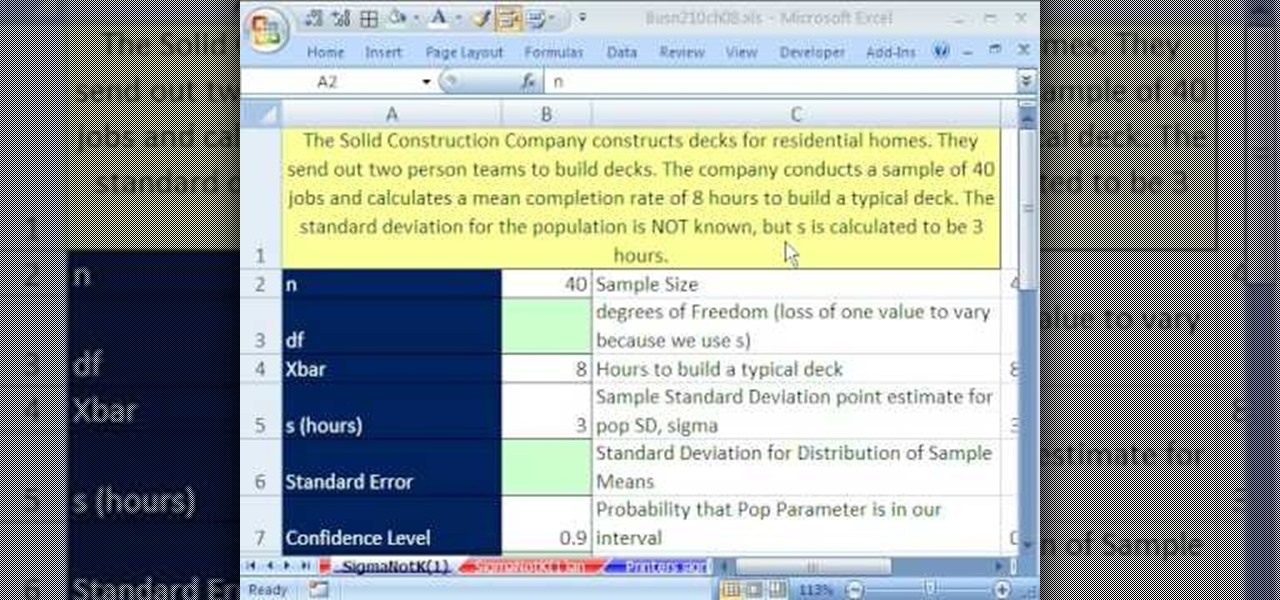
If you use Microsoft Excel on a regular basis, odds are you work with numbers. Put those numbers to work. Statistical analysis allows you to find patterns, trends and probabilities within your data. In this MS Excel tutorial from everyone's favorite Excel guru, YouTube's ExcelsFun, the 82nd installment in his "Excel Statistics" series of free video lessons, you'll learn how to construct confidence intervals when the sigma value (the population's standard deviation) in NOT Known using the TINV...

If you use Microsoft Excel on a regular basis, odds are you work with numbers. Put those numbers to work. Statistical analysis allows you to find patterns, trends and probabilities within your data. In this MS Excel tutorial from everyone's favorite Excel guru, YouTube's ExcelsFun, the very first installment in his "Excel Statistics" series of free video lessons, you'll learn how to get started doing statistical analysis in Microsoft Excel 2007.

There are so many different card games, it can be difficult to keep track of how to play each one. With this tutorial, you'll be focusing on the card game, gin rummy. It's surprisingly simple and easy to play compared to other card games. So sit back, pay attention, and then enjoy!

In this video you will learn how to build a LEGO stroller. The materials you will need are 4 of the small slanted bricks, one two by four thin brick, 3 two by 1 thick bricks, 2 one by one thin bricks, 2 one by one by four studded bricks, a small smooth brick, two odd angled smoothed bricks, 4 wheels, one one by two with dot in center bricks, and one one by two handle bricks. Then after carefully assembling the bricks as shown he will show you a example of what it will look like when you're fi...

Boost your odds of having a baby with these 10 tested tips. Learn how to increase your chances of getting pregnant with this informative video.
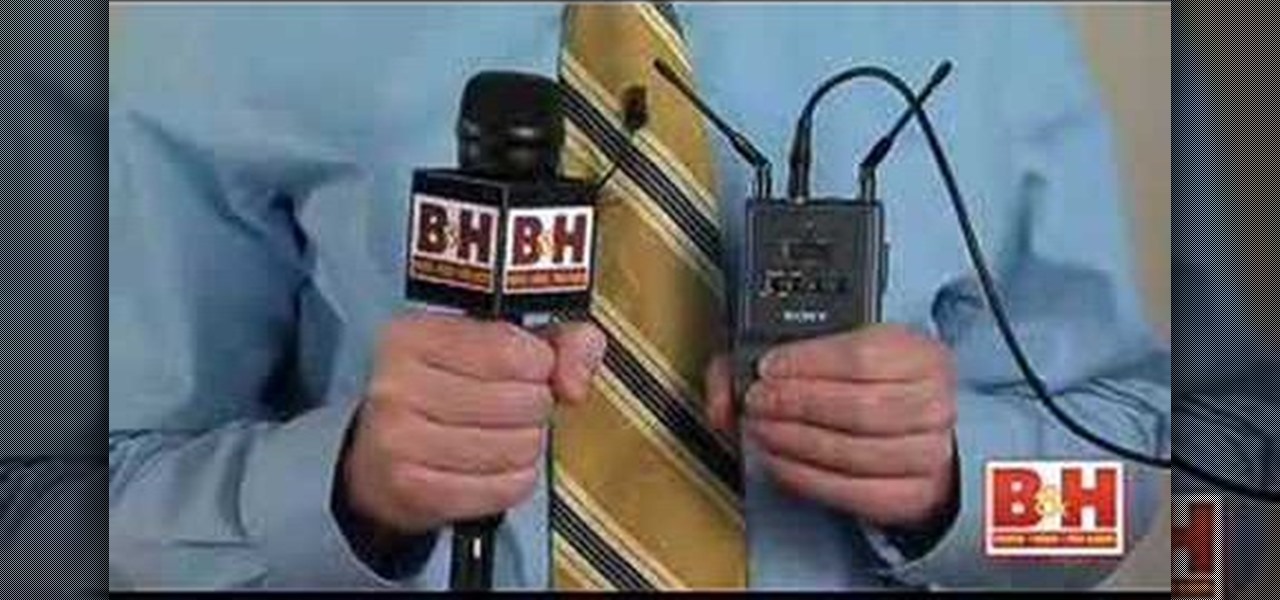
This video shows you how to upgrade your consumer camcorder sound capabilities using a camcorder XLR adapter, a simple device that mounts to the bottom of the camera. It then tests and compares the various types of microphones that can be attached, including the lavalier, sennheiser, handheld interview, and the wireless clip-on microphone. WAtch this helpful instructional video, and boost the sound on your camcorder for professional audio.

The first video explains the Method of Mathematical Induction. It also gives a background of Francesco Maurolico, Pascal and John Wallis. You'll see how to apply the Method of Induction to prove the sum of odd numbers is a square.
If you think that card counting is only a thing in the movies then think again. You too can try a couple of methods to help you count cards. Like anything, the more you work on it the better you will be.

When compared to the other guns, there aren't many sniper rifles in Call of Duty: Black Ops. However, the few which are there pack a definite punch behind them. This tutorial shows you each sniper rifle and how you can use it in the game.
If you're an arts and crafts fanatic then you probably have more than your fair share of ribbons lying all around the house. You snip off one long piece from the roll and then you have to go and tape it to itself again to keep everything in place, and then eventually you give up and the remaining ribbon ends up in an odds-and-ends jar.

Still baking your turkey all traditional-like in the oven? Why not try a new way of serving turkey this year for Thanksgiving that doesn't even involve the oven? It may sound odd and even a bit difficult, but deep frying a turkey is one of the best ways to eat a turkey.

What would "Star Wars" be without its infamous red-faced villain, Darth Maul? True, we never thought he was the prettiest character in the "Star Wars" franchise (that title still goes to hottie Natalie Portman as Princess Amidala), but he had some pretty cool makeup going on.
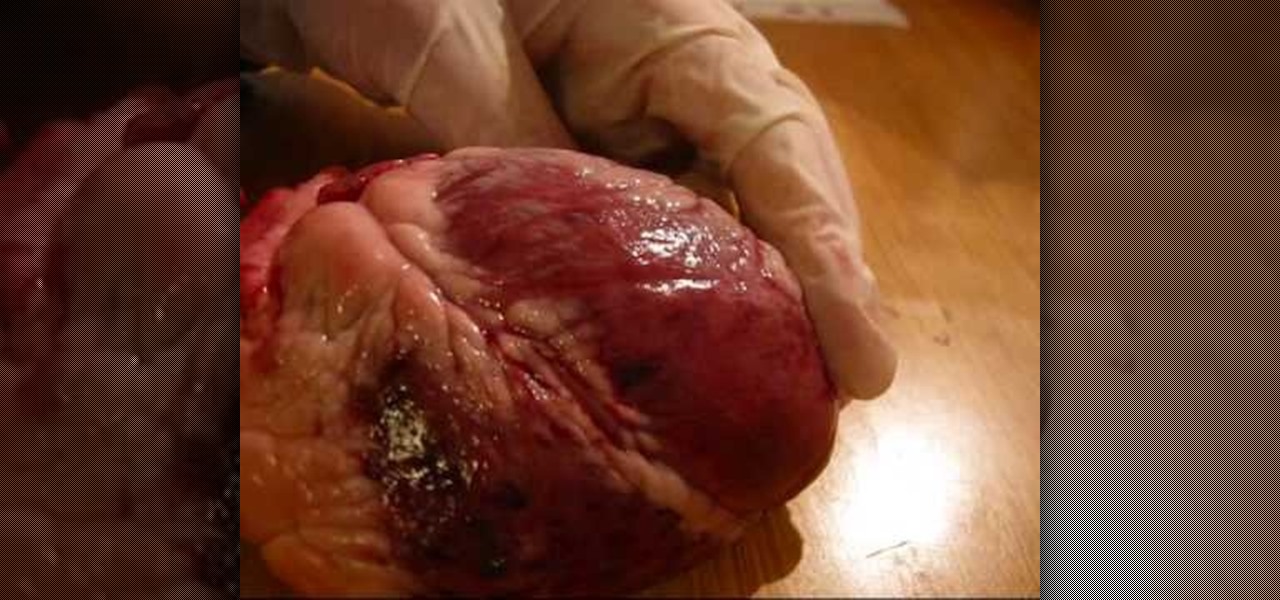
This free video science lesson from YouTube's bionerd23 presents an overview of the similarities between the human heart and that of a regular sheep. For all of the relevant details and detailed overview of the similarities and differences, watch this home-science how-to.

Lady Gaga is truly the queen of outrageous, outre makeup looks, so unique that the only person capable of upstaging her previous looks is herself. In her unforgettable music video for "Bad Romance" she reinvents her look many times, going from odd party hostess to insane asylum babe to monster dancer to glittery hooker to a girl seducing a guy in a bear cape.

Comparing evaluations of the same thing done on different scales can seem difficult, but there is a simple equation you can use to translate something expressed in one numerical scale into another. This video will show you how to use it and make your math life easier.

If you have Ubuntu Linux installed, and the GNOME desktop manager, this video will help you navigate the features and functions. Wlakthrough the workspace and see what you can do! If you're a Windows or Mac user thinking about installing Ubuntu, watch these video tutorials and walkthroughs about Ubuntu and compare for yourself before you make the plunge.
Want to do a little comparative shopping for your next big purchase? With Google Product Search, it's easy. So easy, in fact, that this video guide can present a complete overview of the process in about two minutes. For more information, including step-by-step instructions on how to adjust your own Facebook tagging settings, take a look.

From Ramanujan to calculus co-creator Gottfried Leibniz, many of the world's best and brightest mathematical minds have belonged to autodidacts. And, thanks to the Internet, it's easier than ever to follow in their footsteps. With this installment from Internet pedagogical superstar Salman Khan's series of free math tutorials, you'll learn how to determine whether two fractions are equivalent.

In Japan, kanzashi are hair ornaments, often in a floral or jeweled style, which adorn traditional female Japanese hairstyles. These are gorgeous long pins with a special adornment attached at the end.
Getting the perfect shot is difficult, so when you finally get that perfect picture of yourself, you want to enhance it as much as possible. But if this perfect picture took place in a humdrum location like the bathroom or your living room and you want to glorify your face even more by surrounding it with, say, an island paradise, you can transplant your head (and body) using Photoshop.

At first glance, this drawing looks like nothing special, just an odd design of lines, but then you notice the two bolded lines. They look like they are different sizes, but are they? No! They are the exact same length. Tricky… very tricky.
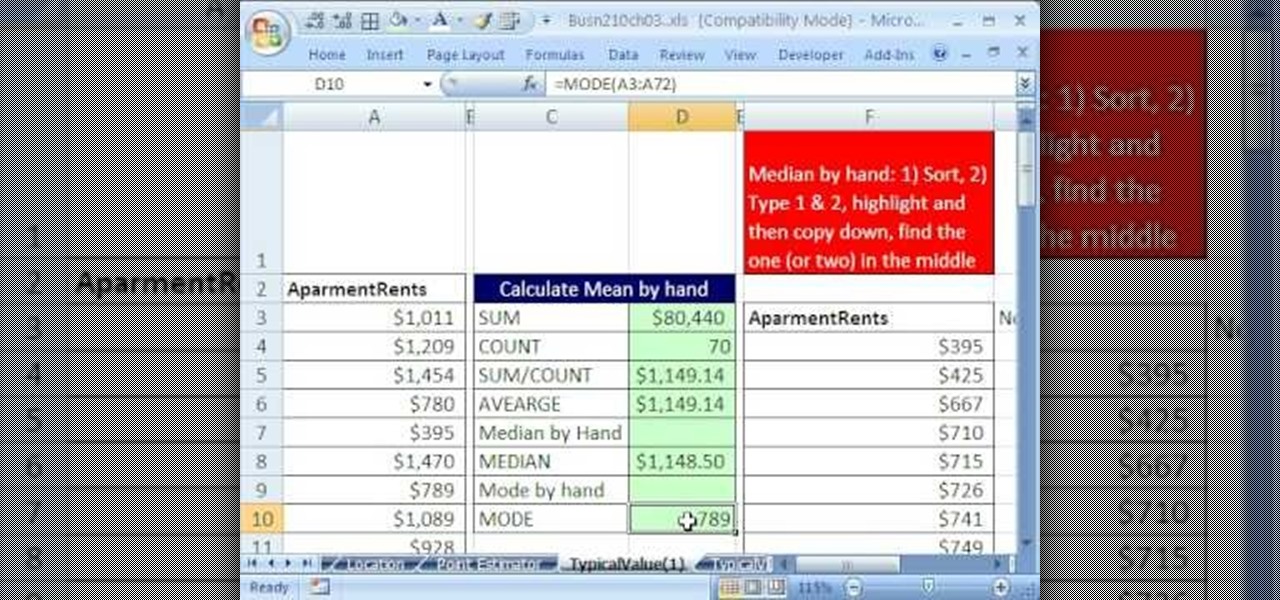
If you use Microsoft Excel on a regular basis, odds are you work with numbers. Put those numbers to work. Statistical analysis allows you to find patterns, trends and probabilities within your data. In this MS Excel tutorial from everyone's favorite Excel guru, YouTube's ExcelsFun, the 34th installment in his "Excel Statistics" series of free video lessons, you'll learn how to use MEAN, MEDIAN, MODE. These measures give us a typical value, a measure of central tendency one value that can repr...
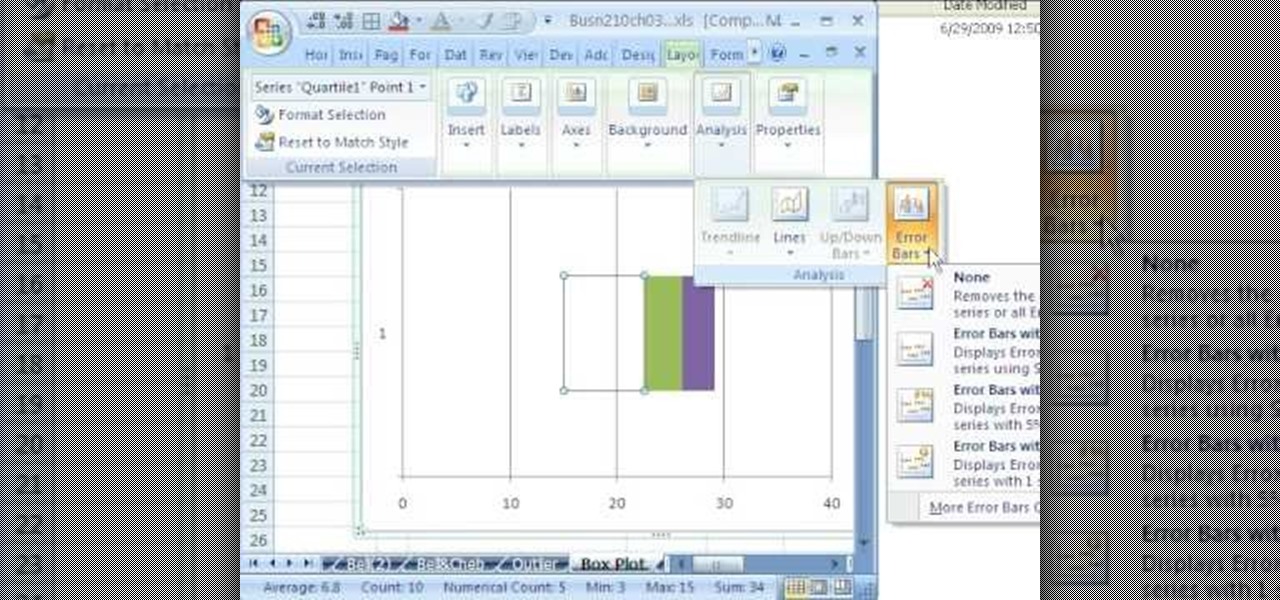
If you use Microsoft Excel on a regular basis, odds are you work with numbers. Put those numbers to work. Statistical analysis allows you to find patterns, trends and probabilities within your data. In this MS Excel tutorial from everyone's favorite Excel guru, YouTube's ExcelsFun, the 49th installment in his "Excel Statistics" series of free video lessons, you'll learn how to find outliers with the +/- 3 Z-score rule and the ABS function. See how to do a box plot by hand and in Excel. For th...
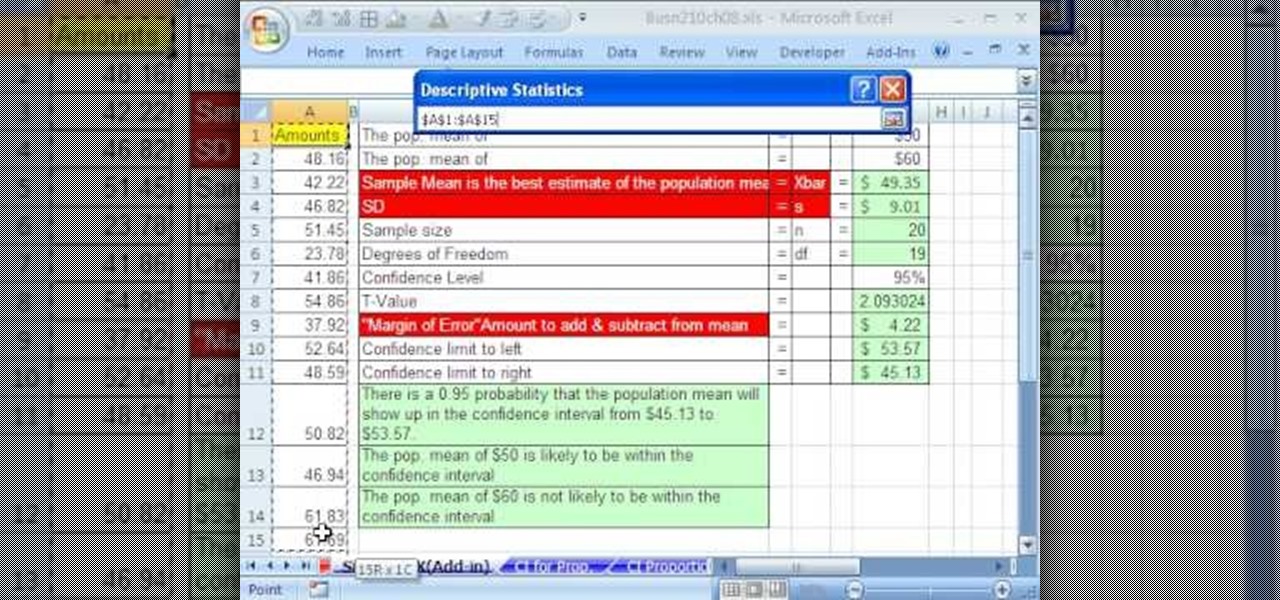
If you use Microsoft Excel on a regular basis, odds are you work with numbers. Put those numbers to work. Statistical analysis allows you to find patterns, trends and probabilities within your data. In this MS Excel tutorial from everyone's favorite Excel guru, YouTube's ExcelsFun, the 84th installment in his "Excel Statistics" series of free video lessons, you'll learn how to construct confidence intervals when the sigma is NOT known using the Descriptive Statistics data analysis add-in.
If you use Microsoft Excel on a regular basis, odds are you work with numbers. Put those numbers to work. Statistical analysis allows you to find patterns, trends and probabilities within your data. In this MS Excel tutorial from everyone's favorite Excel guru, YouTube's ExcelsFun, the 38th installment in his "Excel Statistics" series of free video lessons, you'll learn how to use the RANK and PERCENTRANK functions as well as the Data Analysis add-in's Rank & Percentile tools.

If you use Microsoft Excel on a regular basis, odds are you work with numbers. Put those numbers to work. Statistical analysis allows you to find patterns, trends and probabilities within your data. In this MS Excel tutorial from everyone's favorite Excel guru, YouTube's ExcelsFun, the 20th installment in his "Excel Statistics" series of free video lessons, you'll learn how to take raw quantitative (numerical) data and figure out how to group it into classes so that you can have categories an...
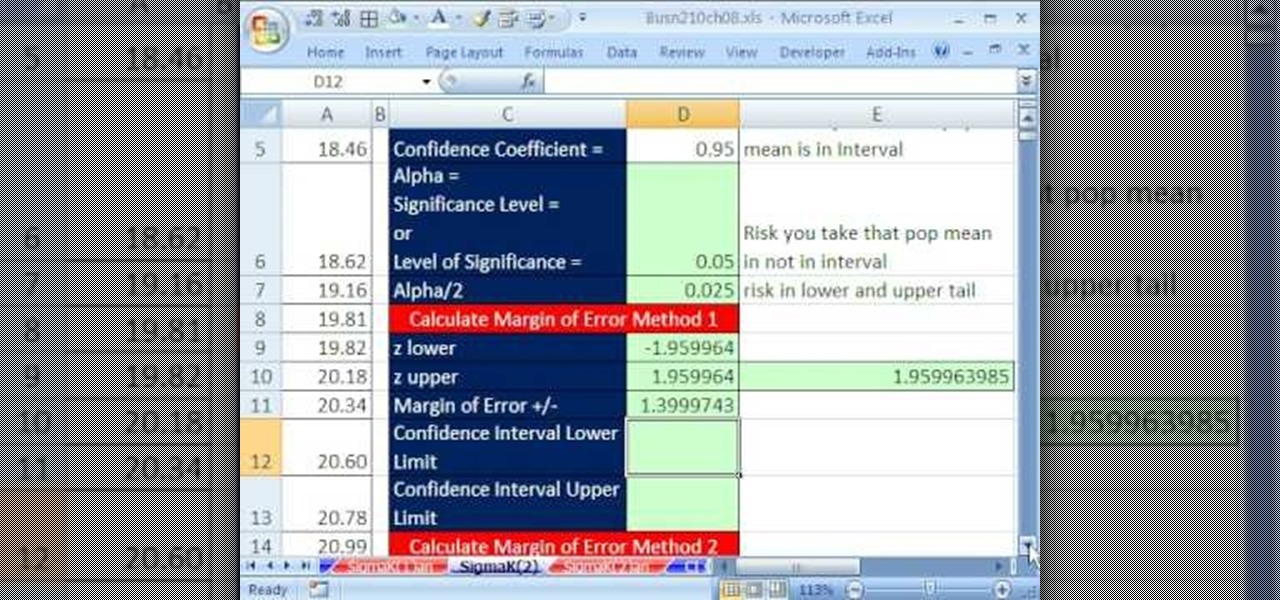
If you use Microsoft Excel on a regular basis, odds are you work with numbers. Put those numbers to work. Statistical analysis allows you to find patterns, trends and probabilities within your data. In this MS Excel tutorial from everyone's favorite Excel guru, YouTube's ExcelsFun, the 81st installment in his "Excel Statistics" series of free video lessons, you'll learn how to construct confidence intervals when the sigma (population standard deviation) is known. See how the CONFIDENCE and NO...
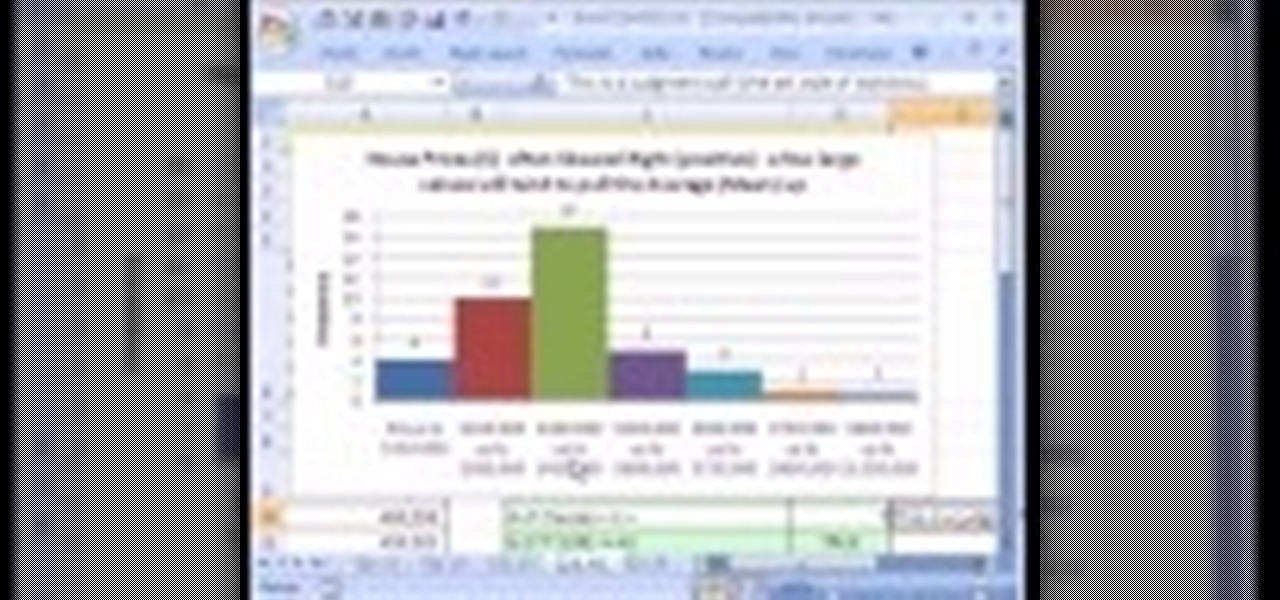
If you use Microsoft Excel on a regular basis, odds are you work with numbers. Put those numbers to work. Statistical analysis allows you to find patterns, trends and probabilities within your data. In this MS Excel tutorial from everyone's favorite Excel guru, YouTube's ExcelsFun, the 23rd installment in his "Excel Statistics" series of free video lessons, you'll learn how to work with skew in histograms for quantitative Data. Learn how to skew left (negative) and skew right (positive) with ...
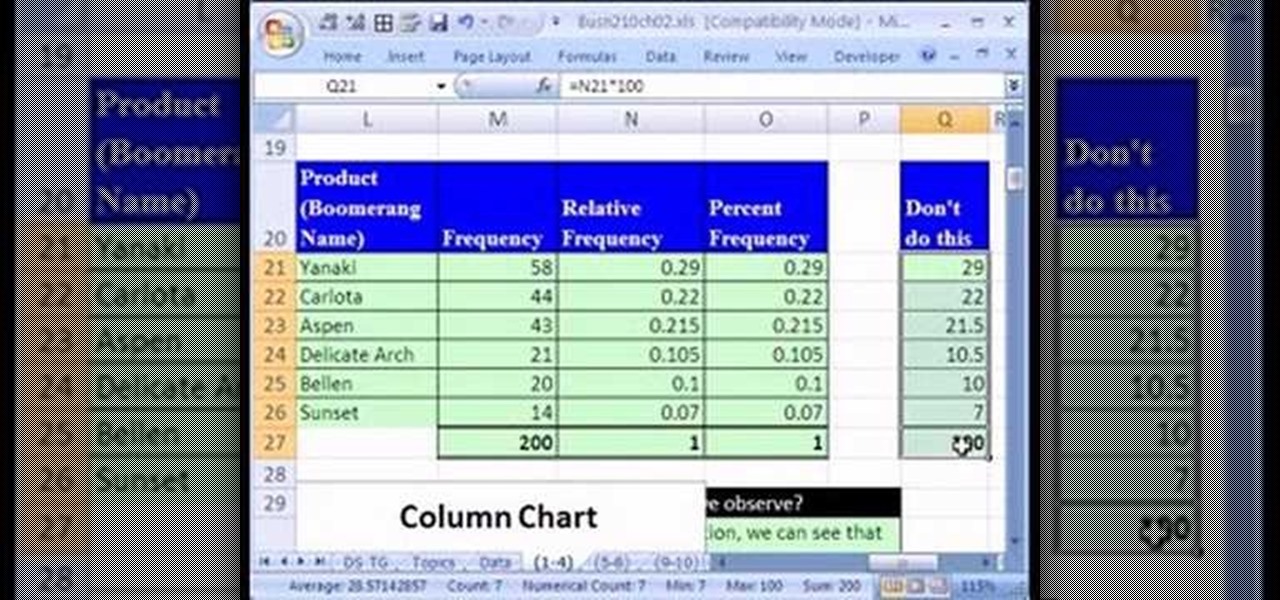
If you use Microsoft Excel on a regular basis, odds are you work with numbers. Put those numbers to work. Statistical analysis allows you to find patterns, trends and probabilities within your data. In this MS Excel tutorial from everyone's favorite Excel guru, YouTube's ExcelsFun, the 14th installment in his "Excel Statistics" series of free video lessons, you'll learn how to create relative & percent & frequency distributions with formulas for categorical data. See, too, how to create a per...
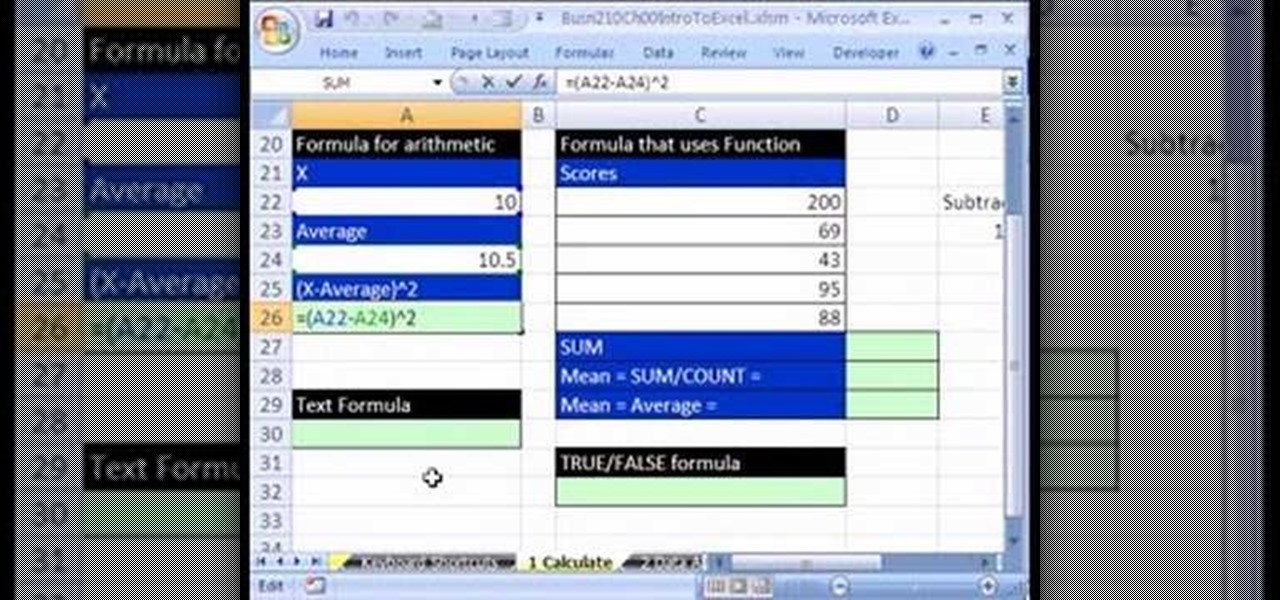
If you use Microsoft Excel on a regular basis, odds are you work with numbers. Put those numbers to work. Statistical analysis allows you to find patterns, trends and probabilities within your data. In this MS Excel tutorial from everyone's favorite Excel guru, YouTube's ExcelsFun, the 2nd installment in his "Excel Statistics" series of free video lessons, you'll learn how to make calculations in Excel using formulas and cell references. Learn about the different Excel Math operators and func...

This video shows us the method to find the median and the inter-quartile range. The first step involves the arrangement of the numbers in the ascending order. Median is the middle number. The middle number is the number at (number of numbers + 1)/2 if the number of numbers is odd or the (number of number)/2 if the number of numbers is even. In the example the number is located at [(11+1)/2] or the 6th number. The inter-quartile range is higher quartile - lower quartile. The higher quartile is...

On the subject of avocados, do you know how to properly prepare and eat the fruit? Compare your techniques to those of Mike's in this video. Learn how to properly prepare an avocado for eating with a little guidance from this instructional.

In this video hosted by I Paint Girls, the idea of motivation and becoming a better artist is discussed. The artist's old work is compared to his new work, as a means to show how practice makes... not perfect, but better. Learn how to become a better artist and get motivated with help and tips given in this video.