If you use Microsoft Excel on a regular basis, odds are you work with numbers. Put those numbers to work. Statistical analysis allows you to find patterns, trends and probabilities within your data. In this MS Excel tutorial from everyone's favorite Excel guru, YouTube's ExcelsFun, the 26th installment in his "Excel Statistics" series of free video lessons, you'll learn how to create quantitative data cumulative frequency distributions with pivot tables.

If you use Microsoft Excel on a regular basis, odds are you work with numbers. Put those numbers to work. Statistical analysis allows you to find patterns, trends and probabilities within your data. In this MS Excel tutorial from everyone's favorite Excel guru, YouTube's ExcelsFun, the 16th installment in his "Excel Statistics" series of free video lessons, you'll learn how to cross tabulate & do percentage cross tabulation for categorical data using a pivot table (PivotTable).

If you use Microsoft Excel on a regular basis, odds are you work with numbers. Put those numbers to work. Statistical analysis allows you to find patterns, trends and probabilities within your data. In this MS Excel tutorial from everyone's favorite Excel guru, YouTube's ExcelsFun, the 19th installment in his "Excel Statistics" series of free video lessons, you'll learn how to group categories in a frequency distribution with a formula (2 COUNTIF) and the pivot table (PivotTable) grouping fea...

If you use Microsoft Excel on a regular basis, odds are you work with numbers. Put those numbers to work. Statistical analysis allows you to find patterns, trends and probabilities within your data. In this MS Excel tutorial from everyone's favorite Excel guru, YouTube's ExcelsFun, the 17th installment in his "Excel Statistics" series of free video lessons, you'll learn how to cross tabulate & do percentage cross tabulation for categorical data using formulas rather than pivot tables.

If you use Microsoft Excel on a regular basis, odds are you work with numbers. Put those numbers to work. Statistical analysis allows you to find patterns, trends and probabilities within your data. In this MS Excel tutorial from everyone's favorite Excel guru, YouTube's ExcelsFun, the 3rd installment in his "Excel Statistics" series of free video lessons, you'll learn how to use Excel's sorting and pivot tables (PivotTables) data analysis tools.

If you use Microsoft Excel on a regular basis, odds are you work with numbers. Put those numbers to work. Statistical analysis allows you to find patterns, trends and probabilities within your data. In this MS Excel tutorial from everyone's favorite Excel guru, YouTube's ExcelsFun, the 35th installment in his "Excel Statistics" series of free video lessons, you'll learn how to calculate weighted and geometric means and see how to use the GEOMEAN function.

If you use Microsoft Excel on a regular basis, odds are you work with numbers. Put those numbers to work. Statistical analysis allows you to find patterns, trends and probabilities within your data. In this MS Excel tutorial from everyone's favorite Excel guru, YouTube's ExcelsFun, the 33rd installment in his "Excel Statistics" series of free video lessons, you'll learn how to use the AVEARGE, MEDIAN, MODE, PERCENTILE, QUARTILE and PERCENTILERANK functions to measure location.
If you use Microsoft Excel on a regular basis, odds are you work with numbers. Put those numbers to work. Statistical analysis allows you to find patterns, trends and probabilities within your data. In this MS Excel tutorial from everyone's favorite Excel guru, YouTube's ExcelsFun, the 4th installment in his "Excel Statistics" series of free video lessons, you'll learn how to create a frequency table and percentage frequency table using a Pivot Table (PivotTable).
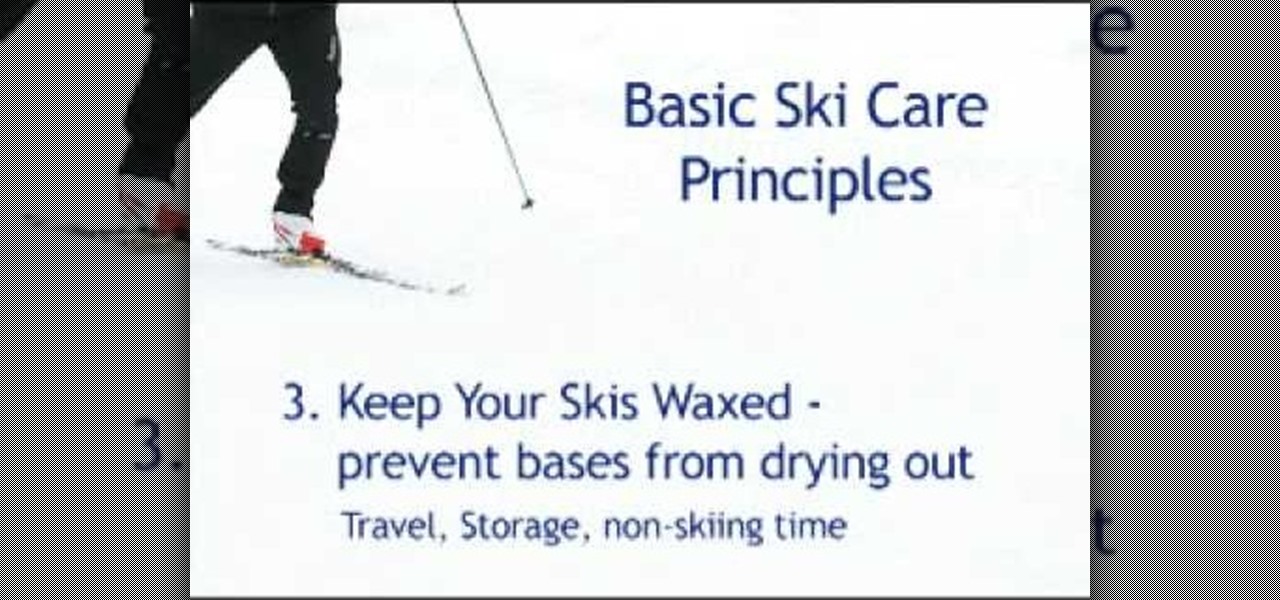
NordicSkiSource.com owner Doug McSpadden illustrates basic practices for caring for your XC skis. The more wax you have the faster your skis. Do not ski through dirt; it will ruin your bases. Keep skis waxed when travelling to keep them from drying out. Don't walk across a parking lot.
Jumpstyle is all the rage from Europe and can be danced to with hiphop or electronica.
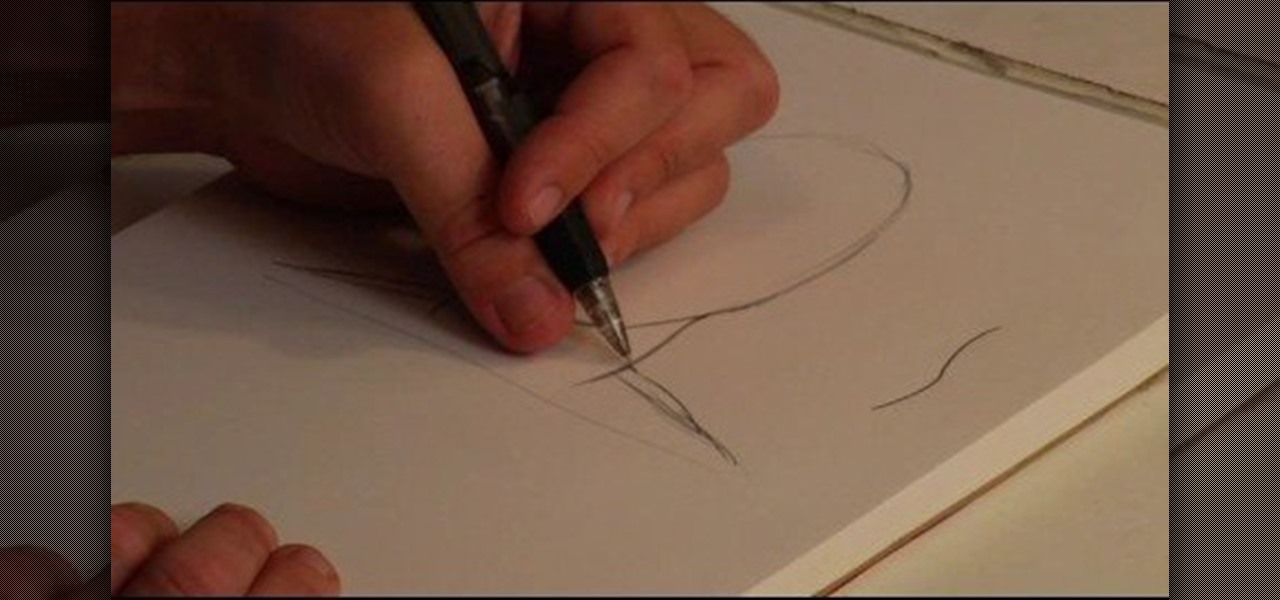
Figure drawing is the basis of fine arts education, so watch this how to video on drawing the human neck. To draw the human neck, pay attention to the muscles and bones that represent its shape. Draw an anatomical human neck with tips from a professional illustrator in this free instructional video on drawing.
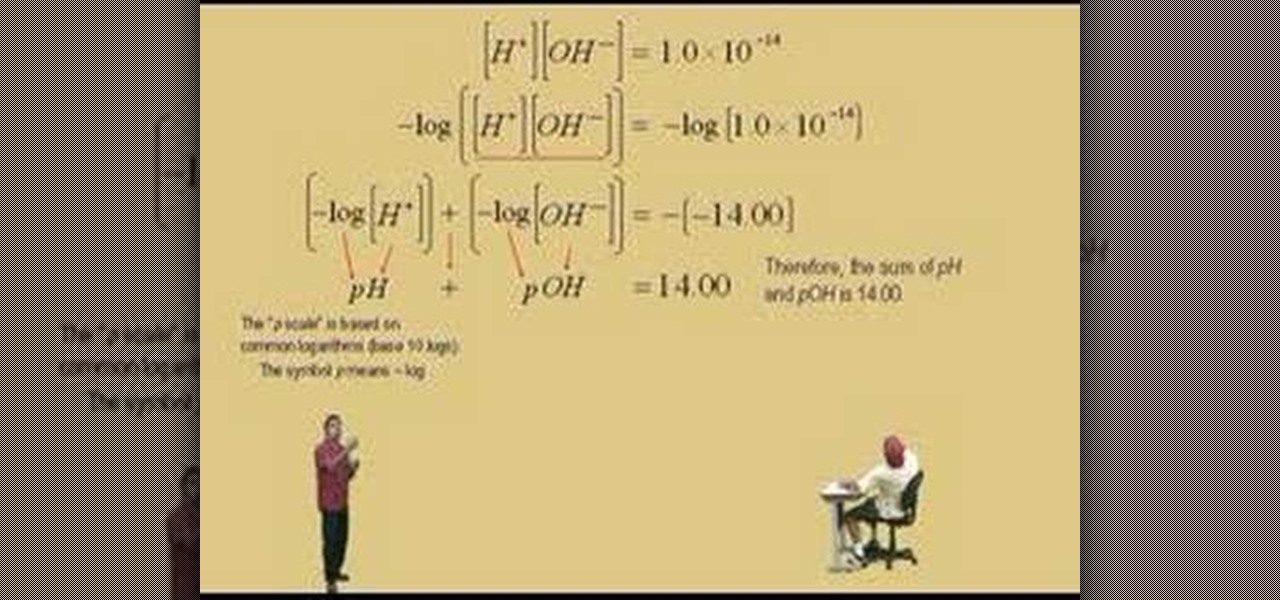
Lawrence Perez, from Saddleback College, and his assistant Charlie, give this intermediate-algebra two-part lesson on logarithmic applications, chemistry acids and bases. If you've never taken chemistry, well, you should probably go and take it first.
In this video, you will learn the best way to throw cards. This takes practice, as many people who first try to throw card do not have the right grip. In order to throw the card properly, you will need to place your thumb on the center of the top side and the index finger on the corner. When you throw the card, use your index finger to create spin. You can use your wrist to add more power, or put your entire arm into it to increase throwing distance. You must work up to using your entire arm....
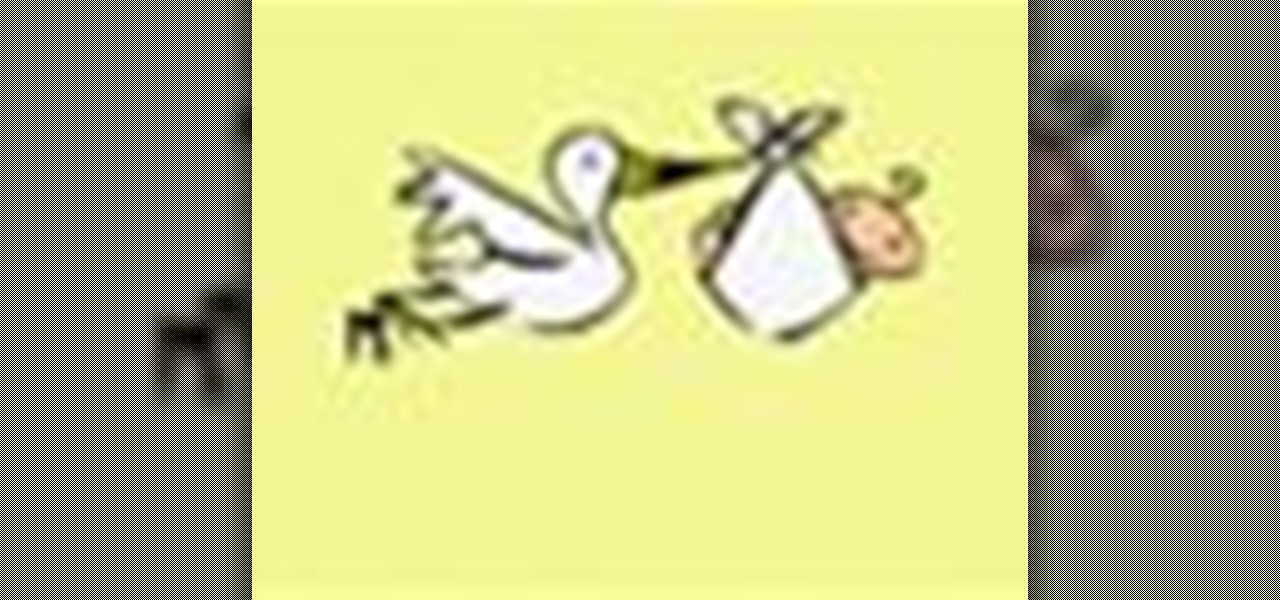
Baby showers are fun ways to celebrate new mommy-hood. You won't want to forget the traditions though. Check out this video before you start planning and make sure you have an nice balance of etiquette and fun.
Kick up your look by adding dresses you make yourself to your wardrobe. It's simple to create a patter and sew a dress that will fit your exact measurements. You'll be amazed at the differene of having a drees you made yourself makes.
Not in the mood to do jumping jacks in your hideous gym uniform? There are ways to sit it out. You Will Need
Sony's Ghost Corps, the caretaker of the Ghostbusters franchise, just released some pre-alpha gameplay footage from the upcoming Ghostbusters World location-based AR game to whet the appetites of would-be hunters of the paranormal.
Aura, a highly rated app for mindfulness and mental health, just became available on Android and is currently on sale.
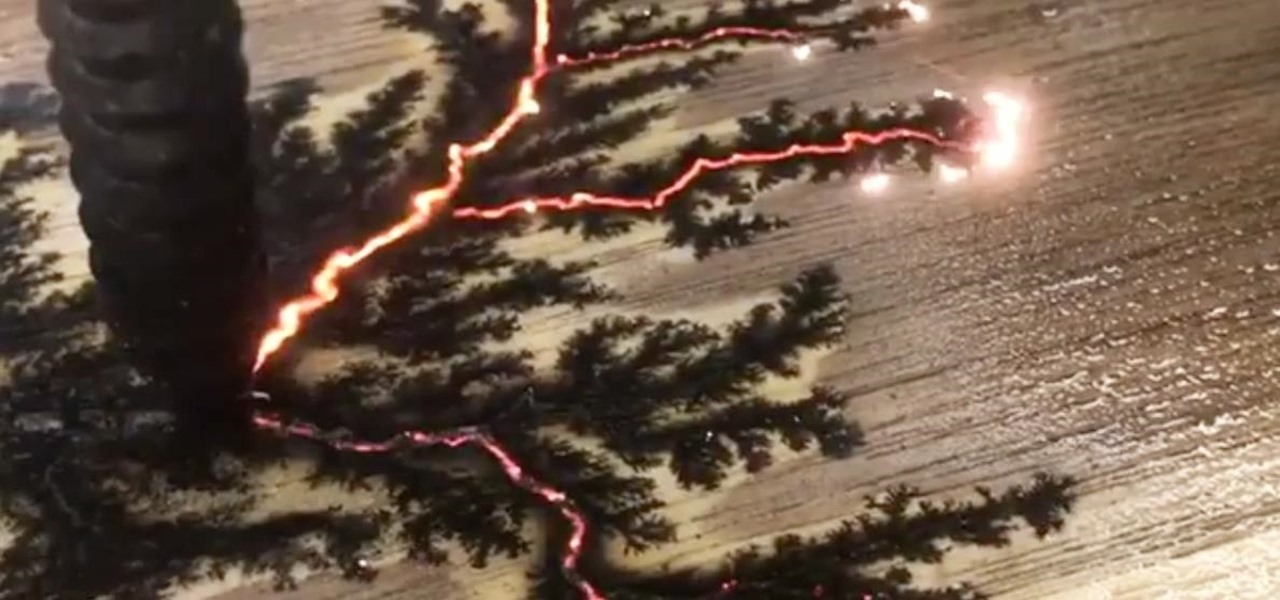
Lightning is scary and powerful, yet when harnessed correctly, it can become a beautiful pattern for hand-crafted wooden furniture. Muchd like Zeus in ancient mythology, Canadian Woodworks is harnessing the power and beauty of lightning, but they're doing it for aesthetic purposes.
While iPhone sales are expected to dip for the first year ever, Apple is reportedly planning to release a souped-up, 4-inch iPhone 5 in hopes of boosting sales for users who prefer a smaller handset.
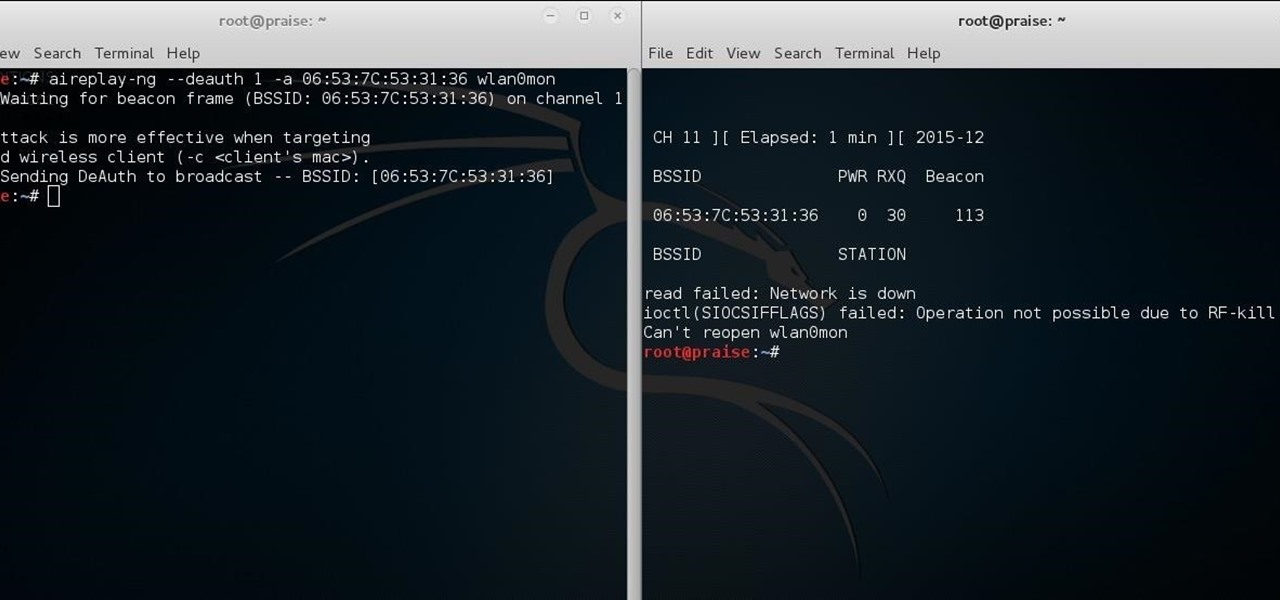
Hello there learners and readers! I figured I'd show you guys my problem and how I solved it, hoping that it would help people who are facing the same issue. Today, we'll be talking about the solution of
When surfing the web in Safari, you can double-tap the status bar to quickly scroll back up to the top any webpage. In other iOS apps that have the shortcut enabled, you can get the job done even faster by tapping the status bar only once. The only bad thing about this feature is that there's no shortcut for scrolling all of the way back down or to the middle.
Before lead was removed from gasoline, lead from car exhaust got into the air, was breathed in by kids, lowered their IQs, and increased crime rates (there is a very strong correlation between IQ and criminal behavior).
The figure 8 is the basis of rave light show technique, whether you use gloves or glowsticks (you oldskooler you). If you've been having some trouble getting it down watch this video for a succinct and helpful explanation of the wrist motion that is essential to really good figure 8's.
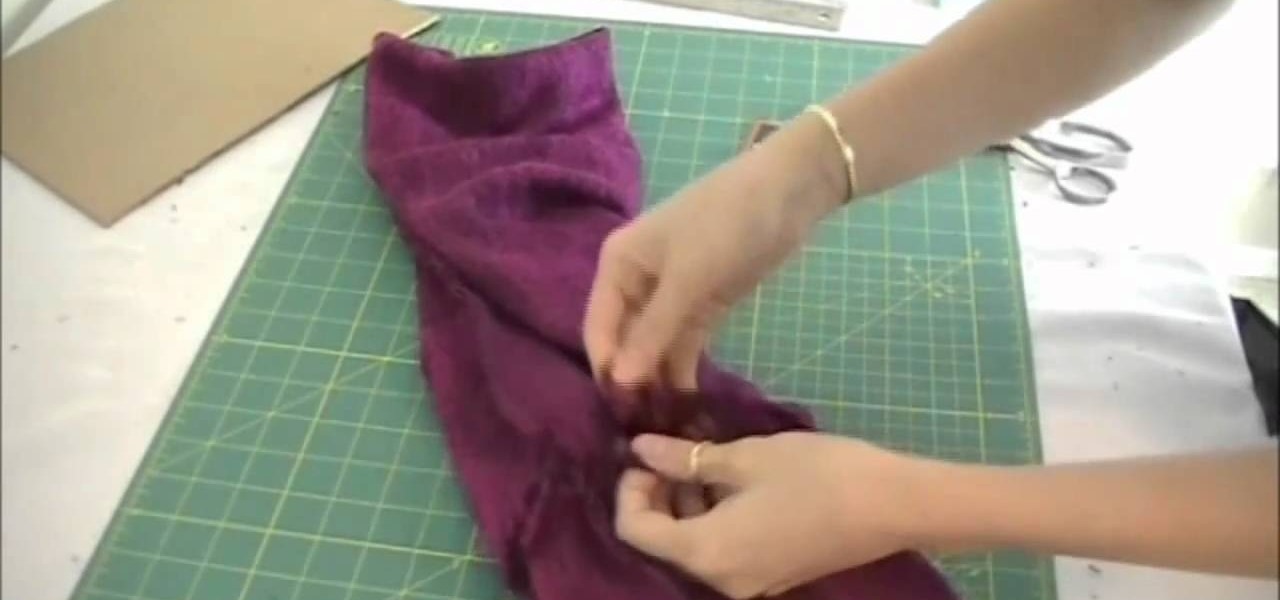
Infinity scarves are ridiculously easy to make at home. All you need is a long strip of thick fabric in a print you enjoy and some basis sewing utensils.
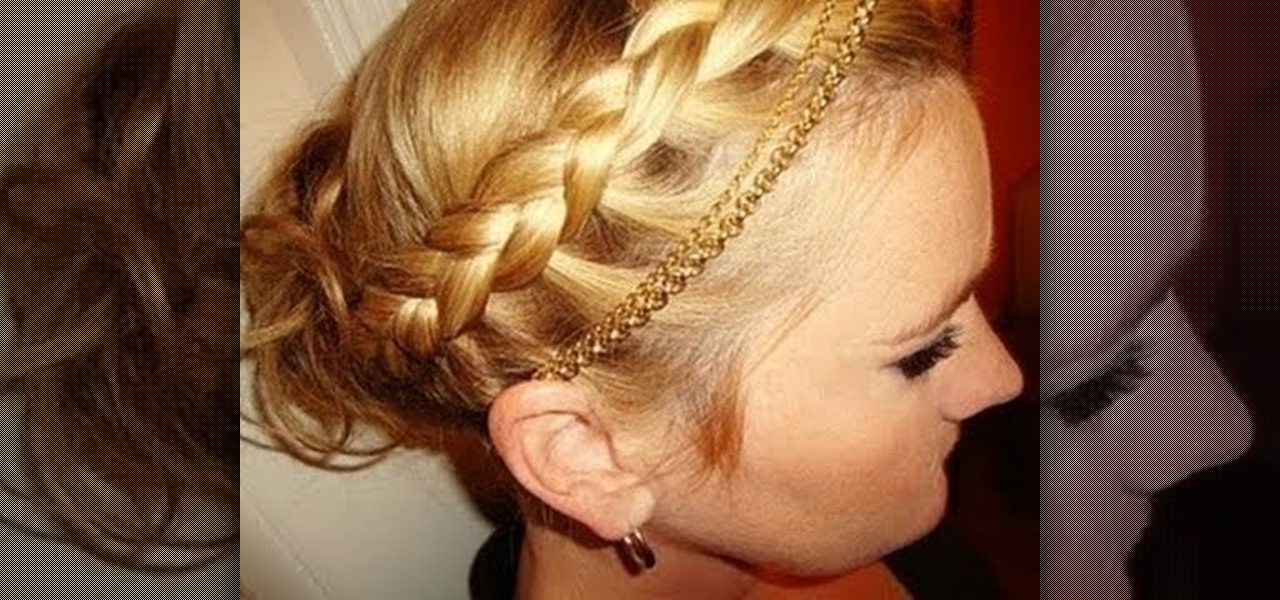
Need a complementary, beautiful hairstyle to go with your Greek goddess costume this Halloween? Then this braided goddess updo is exactly what you're looking for. While this look is great for a Halloween costume, it's also not too showy to be worn on a daily basis.
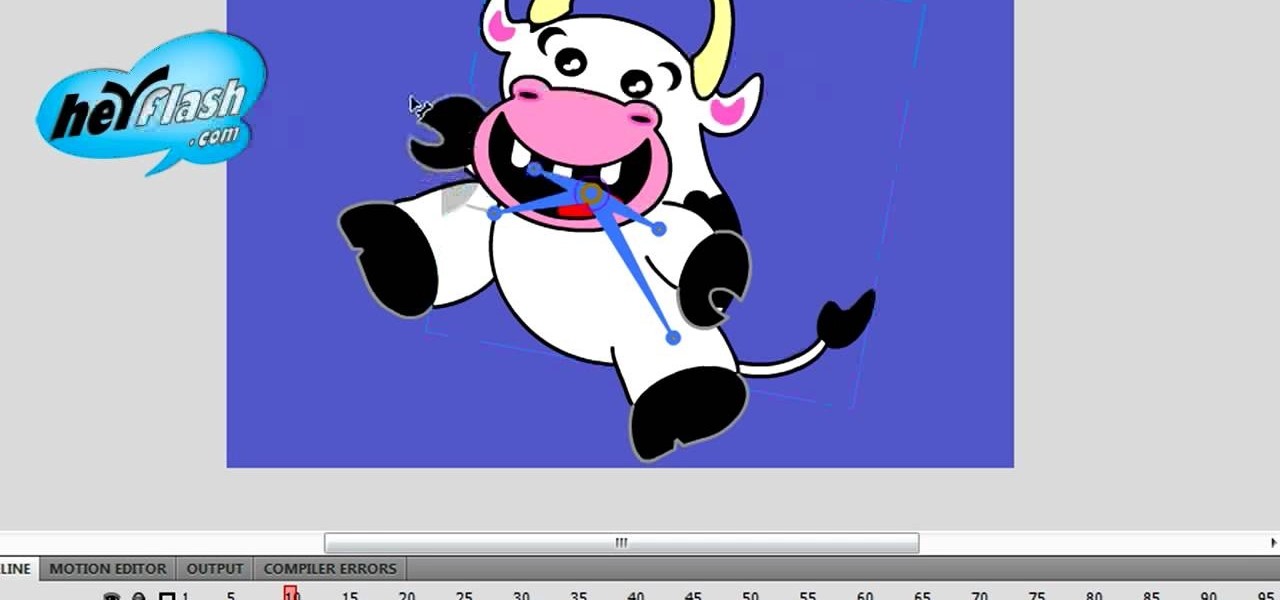
The bone tool is one of the most important tools in Flash for creating basic animations. It allows you to give your characters virtual bones which you can manipulate to make them move. This video tutorial will show you how to use the bone tool to create a simple animation of a dancing cartoon cow. It is very cute, and this tool will be the basis of many of your future, more cinematic works.
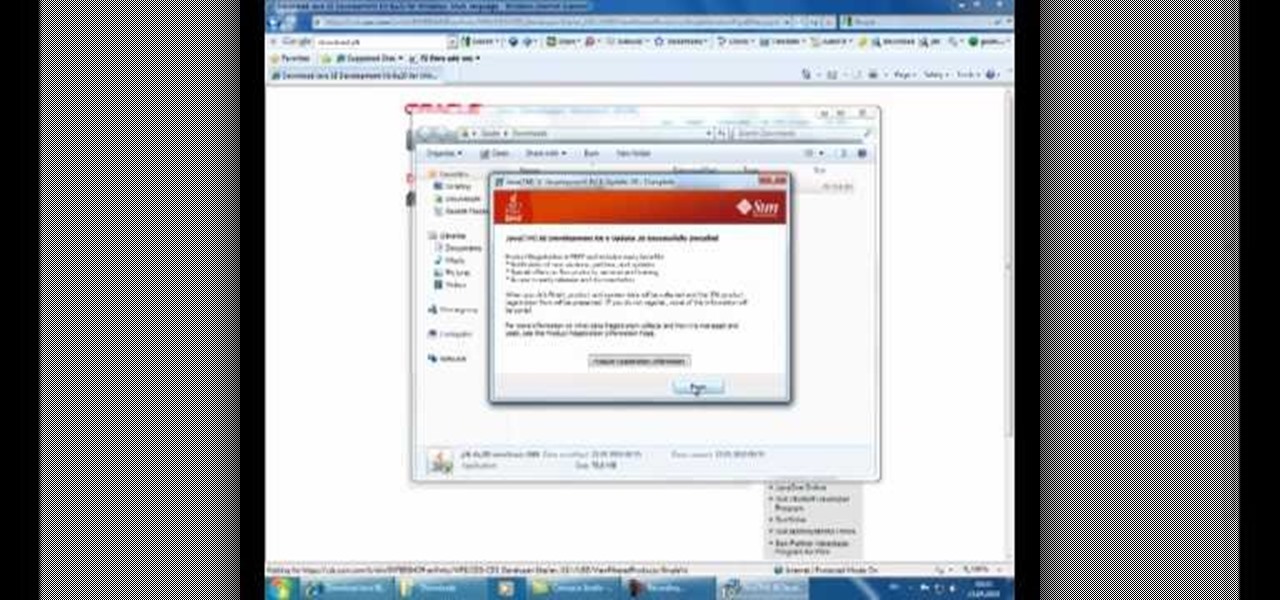
If you want to learn how to program in the Java language, then the first thing you're going to need to do is download and install the JDK. That stands for Java Development Kit, and is the basis for anyone begging in Java, and you need it to get the Javac (Java compiler) running. This video will show you what to do, and will show you how to set a new variable name and value in the Environment Variables under Advanced System Settings on your Windows PC.
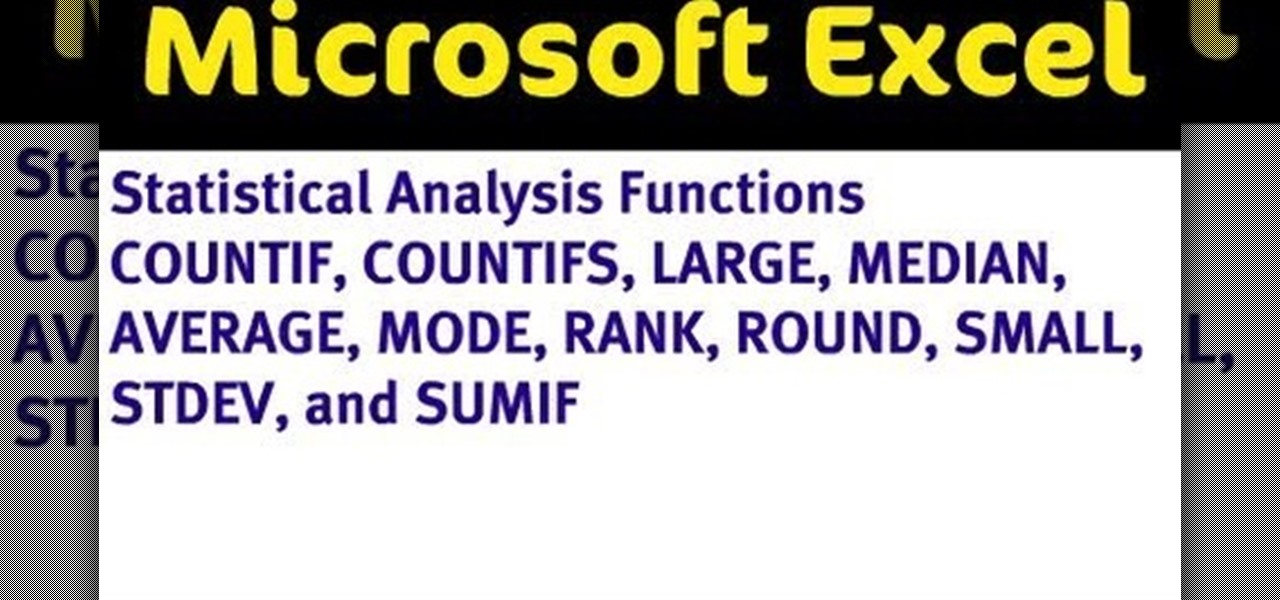
If you use Microsoft Office Excel on anything resembling a regular basis, odds are you work with numbers. Put those numbers to work with this free MS Excel video tutorial, which will teach you how to use a number of Excel's basic statistical functions (e.g., STDEV, AVERAGE, MEDIAN, MODE, RANK, ROUND, LARGE & SMALL).
If you use Microsoft Excel on a regular basis, odds are you work with numbers. Put those numbers to work. Statistical analysis allows you to find patterns, trends and probabilities within your data. In this MS Excel tutorial from everyone's favorite Excel guru, YouTube's ExcelsFun, the 44th installment in his "Excel Statistics" series of free video lessons, you'll learn how to use the SKEW function to calculate the skew in a distribution of data.
f you use Microsoft Excel on a regular basis, odds are you work with numbers. Put those numbers to work. Statistical analysis allows you to find patterns, trends and probabilities within your data. In this MS Excel tutorial from everyone's favorite Excel guru, YouTube's ExcelsFun, the 37th installment in his "Excel Statistics" series of free video lessons, you'll learn how to use the PERCENTILE and QUARTILE functions.
If you use Microsoft Excel on a regular basis, odds are you work with numbers. Put those numbers to work. Statistical analysis allows you to find patterns, trends and probabilities within your data. In this MS Excel tutorial from everyone's favorite Excel guru, YouTube's ExcelsFun, the 47th installment in his "Excel Statistics" series of free video lessons, you'll learn about the basics of the empirical rule (the bell curve) and how to apply it in various ways.
If you use Microsoft Excel on a regular basis, odds are you work with numbers. Put those numbers to work. Statistical analysis allows you to find patterns, trends and probabilities within your data. In this MS Excel tutorial from everyone's favorite Excel guru, YouTube's ExcelsFun, the 89th installment in his "Excel Statistics" series of free video lessons, you'll learn how to use the NORMSINV function for critical values and the NORSDIST function for p-values.
If you use Microsoft Excel on a regular basis, odds are you work with numbers. Put those numbers to work. Statistical analysis allows you to find patterns, trends and probabilities within your data. In this MS Excel tutorial from everyone's favorite Excel guru, YouTube's ExcelsFun, the 91st installment in his "Excel Statistics" series of free video lessons, you'll learn how to use TINV and TDIST functions to find critical values given an unknown sigma value.
If you use Microsoft Excel on a regular basis, odds are you work with numbers. Put those numbers to work. Statistical analysis allows you to find patterns, trends and probabilities within your data. In this MS Excel tutorial from everyone's favorite Excel guru, YouTube's ExcelsFun, the 80th installment in his "Excel Statistics" series of free video lessons, you'll learn how to construct confidence intervals when the sigma is known known using the CONFIDENCE and NORMSINV functions.
If you use Microsoft Excel on a regular basis, odds are you work with numbers. Put those numbers to work. Statistical analysis allows you to find patterns, trends and probabilities within your data. In this MS Excel tutorial from everyone's favorite Excel guru, YouTube's ExcelsFun, the 21st installment in his "Excel Statistics" series of free video lessons, you'll learn how to build labels and counting formulas for a frequency distribution.
If you use Microsoft Excel on a regular basis, odds are you work with numbers. Put those numbers to work. Statistical analysis allows you to find patterns, trends and probabilities within your data. In this MS Excel tutorial from everyone's favorite Excel guru, YouTube's ExcelsFun, the 87th installment in his "Excel Statistics" series of free video lessons, you'll learn how to use NORMSINV to test a hypothesis with population standard deviation (sigma) known and proportions.
If you use Microsoft Excel on a regular basis, odds are you work with numbers. Put those numbers to work. Statistical analysis allows you to find patterns, trends and probabilities within your data. In this MS Excel tutorial from everyone's favorite Excel guru, YouTube's ExcelsFun, the 28th installment in his "Excel Statistics" series of free video lessons, you'll learn how to create quantitative data stem & leaf charts using the REPT and COUNTIF functions.
If you use Microsoft Excel on a regular basis, odds are you work with numbers. Put those numbers to work. Statistical analysis allows you to find patterns, trends and probabilities within your data. In this MS Excel tutorial from everyone's favorite Excel guru, YouTube's ExcelsFun, the 13th installment in his "Excel Statistics" series of free video lessons, you'll learn how to create a column chart from a frequency distribution for categorical data.
If you use Microsoft Excel on a regular basis, odds are you work with numbers. Put those numbers to work. Statistical analysis allows you to find patterns, trends and probabilities within your data. In this MS Excel tutorial from everyone's favorite Excel guru, YouTube's ExcelsFun, the 5th installment in his "Excel Statistics" series of free video lessons, you'll learn how to use relative and absolute cell references to save time when writing formulas.