This may not matter to you if you only FaceTime from your iPhone occasionally, but if you're FaceTiming every day on a limited data plan from your cellular provider, you're going to want to conserve as much data as possible by making sure that you're connected to Wi-Fi only — especially if they are video calls.
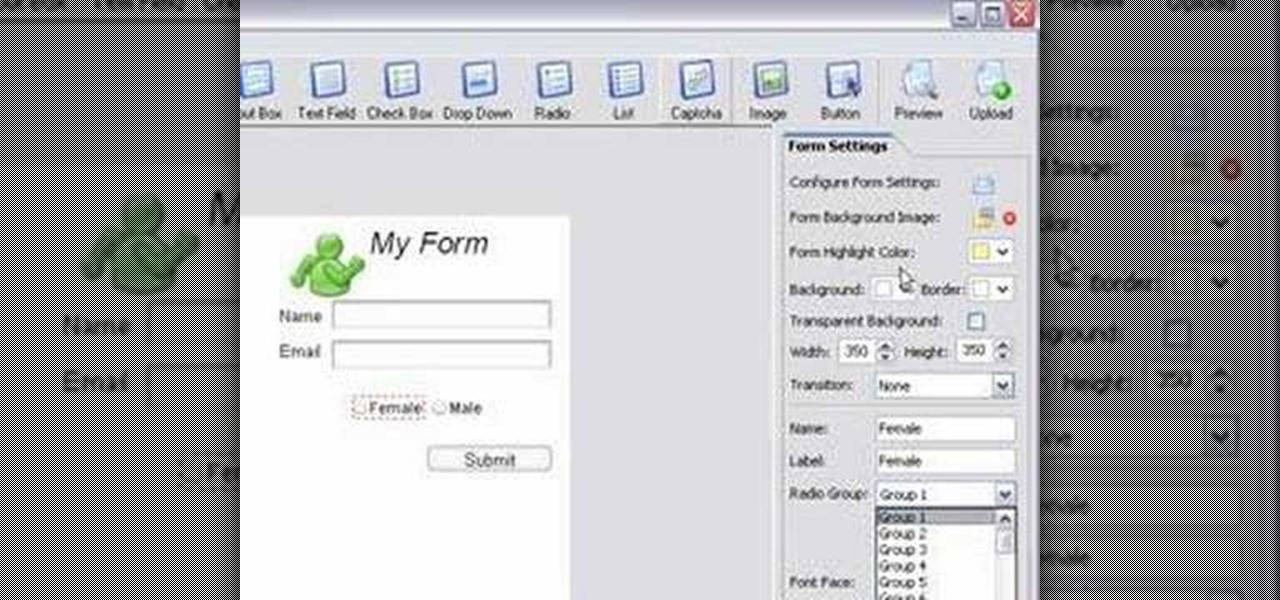
If you want to submit information to a user, you build a website; if you want to receive information from that user, you use a web form. As such, it's crucial that your web forms be well designed. One easy way to design web forms is with CoffeeCup's Web Form Builder.
Check out this informative video tutorial from Apple on how to use iWork.com to share documents and spreadsheets.

Another AR cloud savior has emerged this week in Fantasmo, a startup that wants to turn anyone with a smartphone into a cartographer for spatial maps.

With Gboard, Google created a keyboard with more functionality than just inputting words. The app includes features such as GIF search and live text translation, but it gets even better when you let it learn more about you. With this data, Gboard grows from a good keyboard to one that can complete your sentences.
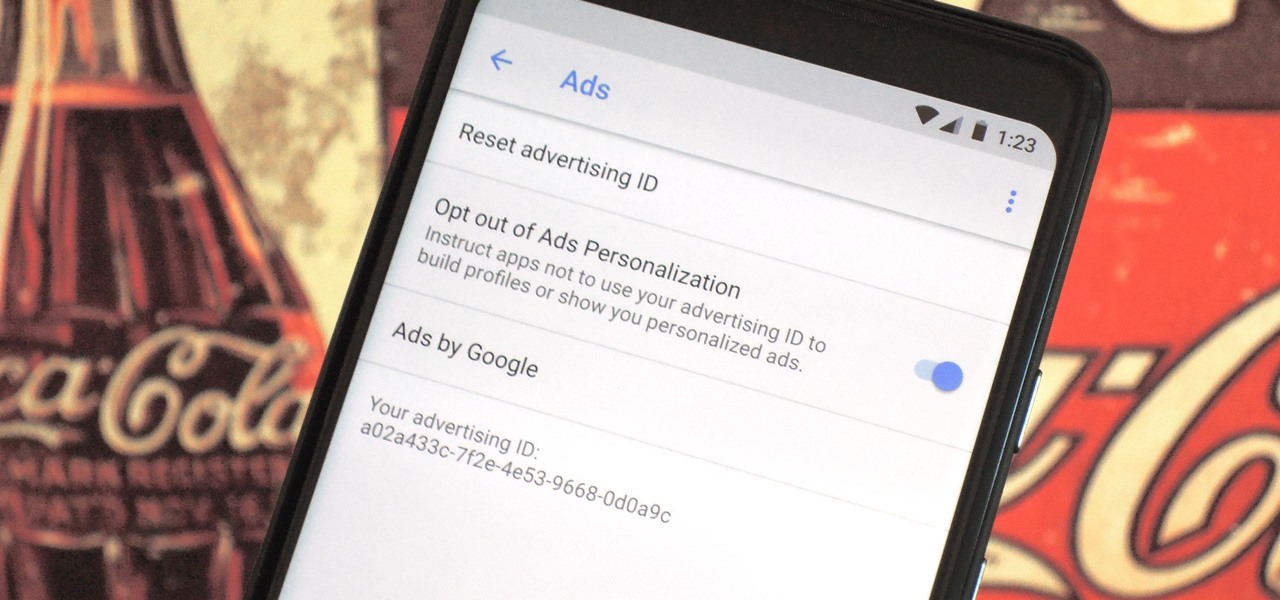
Most of the free apps you'll find on the Play Store have ads. These ads are personalized — in other words, they're for products and services Google believes you might be interested in. The way Google knows about your interests is by collecting data from your smartphone, including your location and app usage. While personalized ads have their advantages, the collection of data is unsettling.

Toyota is testing blockchain and distributed ledger technology (BC/DL) for data sharing for driverless cars and other applications. This could eventually reassure buyers of its upcoming high-end cars by making sure their sensitive data is secure.
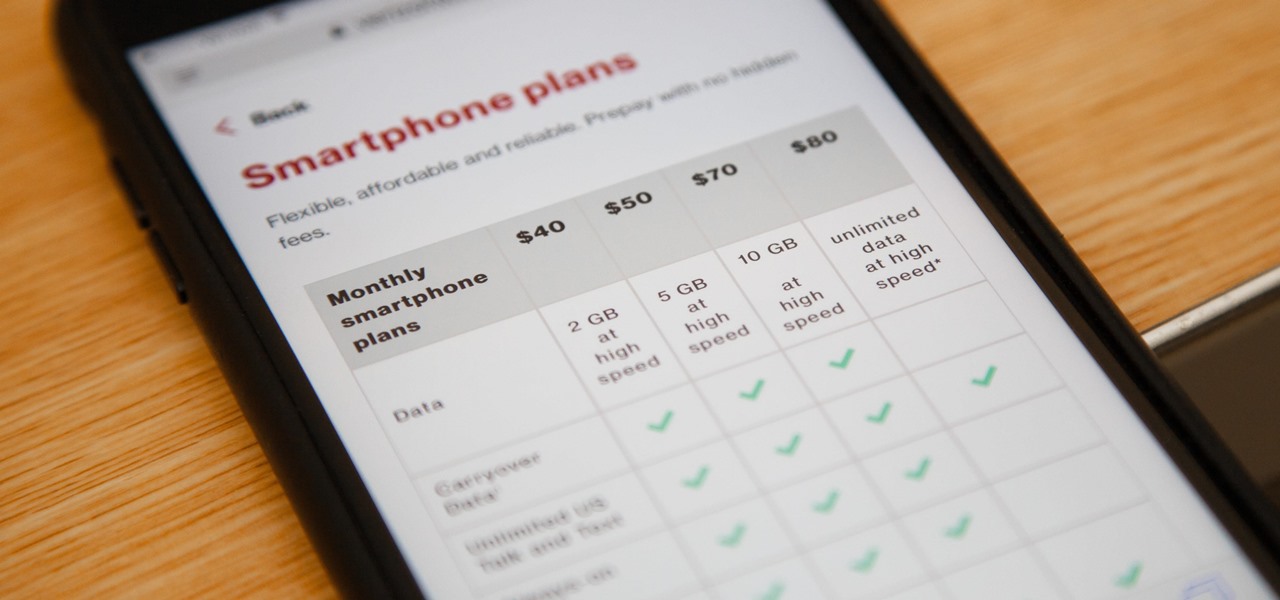
Verizon launched the $80 unlimited prepaid plan this week and we've found that it actually isn't as limitless as they would have you believe.
HoloLens developer Michael Peters of In-Vizible has released quite a few videos since receiving his HoloLens last year. Many of his experiments are odd and funny, but some include serious potential approaches to data visualization. In the videos embedded below, you'll specifically see stock market information beautifully rendered in different ways to help understand the data.
Recently, a group of Duke University students got together to tackle an age-old problem with mobile devices. You see, mobile data coverage isn't exactly ubiquitous, and many folks have restrictive mobile data plans, which means internet connectivity is not always an option.
In this video tutorial, viewers learn how to create drop down menus in Microsoft Excel. This task is very easy, fast and easy to do. Begin by highlighting a desired cell. Then click on the Data tab and click on Data Validation under Data Tools. When the Data Validates window opens, click on the Error tab and deselect "Show error alert after invalid data is entered". Then click on OK. Now simply type in the data into the selected cell. This video will benefit those viewers who use Microsoft Ex...
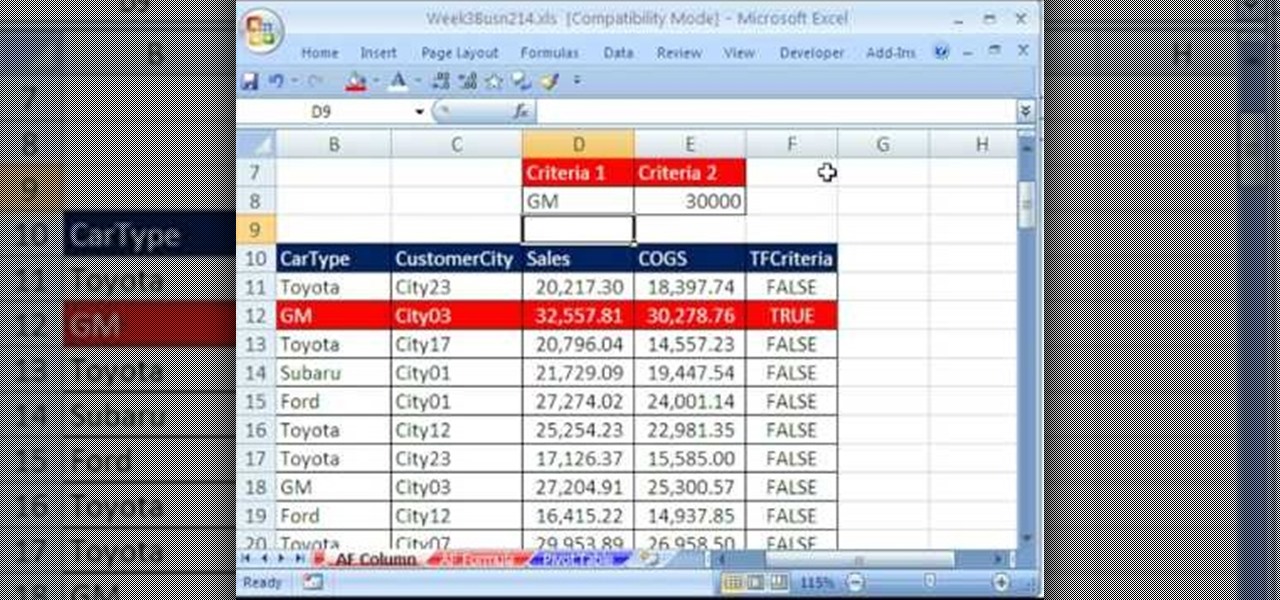
Whether you're interested in learning Microsoft Excel from the bottom up or just looking to pick up a few tips and tricks, you're in the right place. In this tutorial from everyone's favorite digital spreadsheet guru, ExcelIsFun, the 19th installment in his "Highline Excel Class" series of free video Excel lessons, you'll learn about using Advanced Filter to extract data from an Excel List/Table/Database. See these 7 Advanced Filter examples:
A rough definition of standard deviation is that it is a measure of expressing the observed variations about the average in statistical data i.e. by how much do the observed values vary from the mean. This video continues from the previous solved example and demonstrates the mathematical interpretation of the standard deviation that was calculated. We begin with stating the mean and standard deviation values and then calculating the upper and lower bounds of the data based on the standard dev...
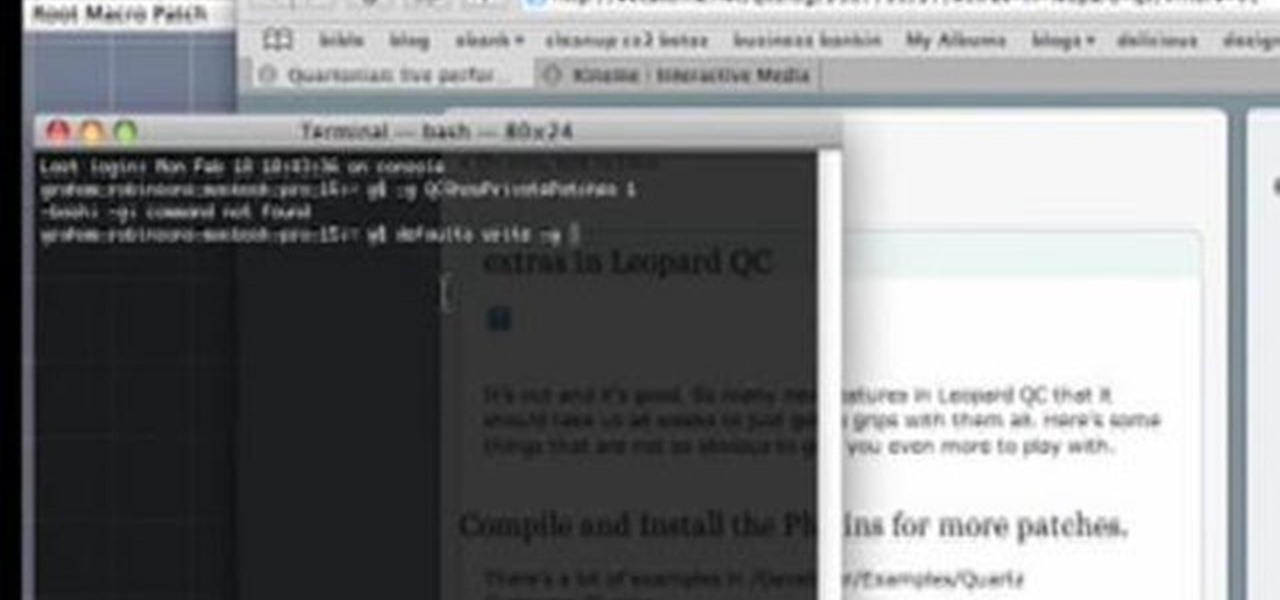
This is a very basic introductory video that teaches you how to successfully install Quartz Composer on your MAC OSX 10.5 Leopard. Quartz Composer is a node-based graphical data software that uses visual programming language. Built exclusively for use on the MAC OSX, it's a handy software for graphic designers.
If you use Microsoft Excel on a regular basis, odds are you work with numbers. Put those numbers to work. Statistical analysis allows you to find patterns, trends and probabilities within your data. In this MS Excel tutorial from everyone's favorite Excel guru, YouTube's ExcelsFun, the 24th installment in his "Excel Statistics" series of free video lessons, you'll learn how to create quantitative data frequency distributions with pivot tables. See how to create the correct unambiguous labels ...
Check out this informative video tutorial from Apple on how to format data values with the format bar in Numbers '09.
With over 1 billion downloads on the Play Store alone, Google Maps has become a staple for those traveling. Its popularity is the result of Google consistently improving its accuracy and adding new functionality. And this was only achieved with help of you — specifically, your data.
Your email inbox is a treasure trove of personal data. The people you contact, your writing style, which messages you flag as spam — all of this information and more can be used to paint a clear picture of you. Google knows this as well as anybody, so they use this data to constantly improve your experience in Gmail.
This month, the power of artificial intelligence will be coming to more augmented reality developers as a leader in the game and 3D software development space and a major force behind the current school of cloud-based AI have officially announced a new partnership.
Thanks to their partnership with Tidal, over 30 million Sprint customers can access Hi-Fi audio on the go. And the Jay-Z-owned music service isn't limited to just Sprint customers — for $19.99/month, anyone can listen to lossless audio from their favorite artists. But streaming uncompressed audio files uses a lot more data than standard quality, so how do you use Tidal without hitting your data cap?
Welcome back, my fledgling hackers! With this first article, I am initiating a new series intended to convey to my readers the skills necessary to develop your own exploits.
This five-part series on C# programming covers many things. First, you learn how to save to the Microsoft SQL Server. Then, you'll learn how to retrieve that data. You'll also learn how to navigate the DataSet, edit SQL data, and delete data. If you have Microsoft Visual Studio and SQL Server, give this lesson a try.
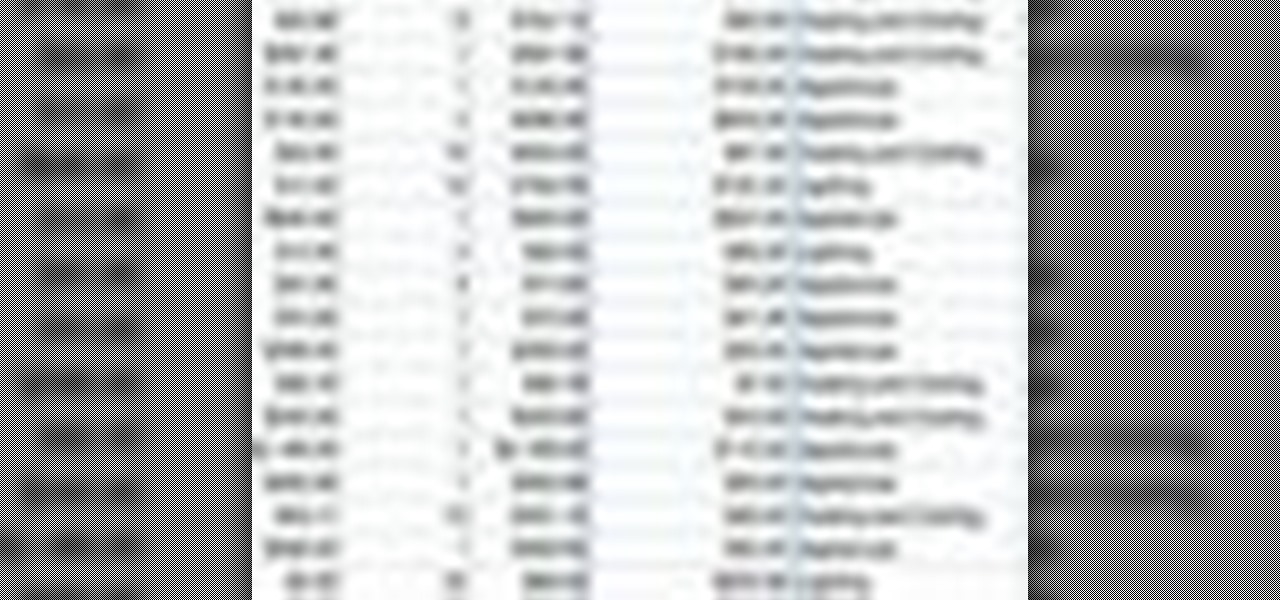
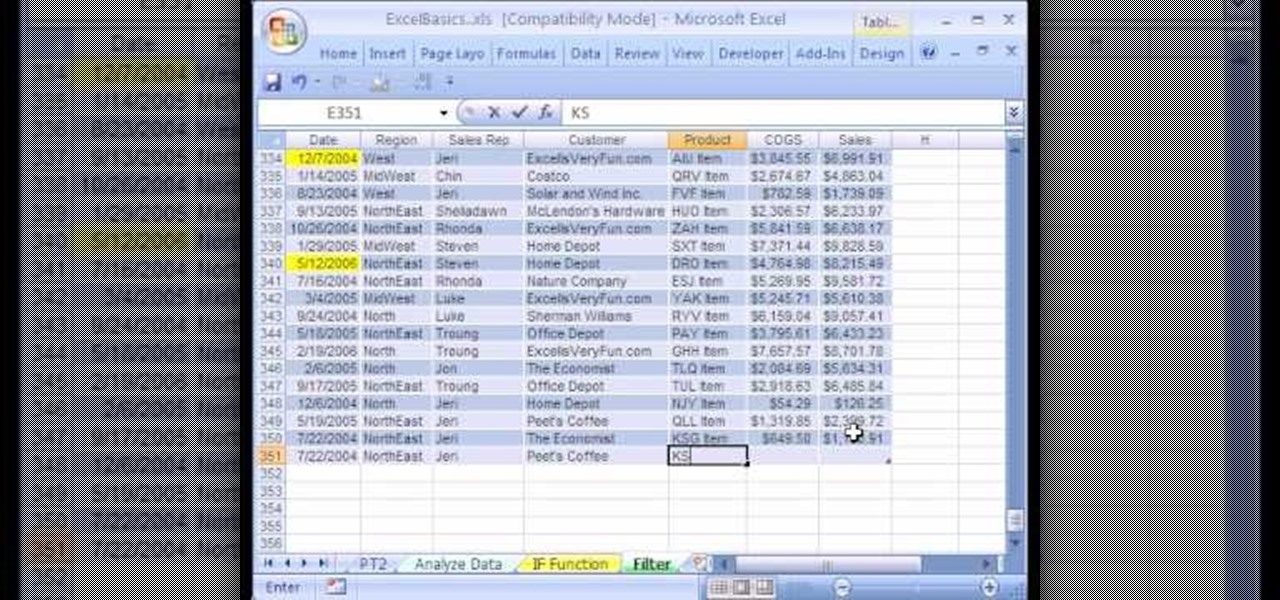
We're on sheet, tab, filter. We want to talk about filter, but we also want to talk about an Excel table or list. It is simply a data set with field names at the top, records in rows, no blanks anywhere and no other data sets touching this data set. When we convert to a table, it does a lot of amazing things. The new keyboard shortcut is "Ctrl T". If data is set up correctly, it will work. Click Ok. You can build a function based on a column of data, i.e. "Alt =" which is the shortcut for sum...
In this six-part video tutorial, learn how to create an access database. The following six parts go over the following:
Core Data is a powerful data-management framework introduced with Mac OS X v10.4 Tiger. When you take advantage of Core Data, it slashes the amount of custom code you need to write in order to manage application data. Opening, saving and undo management can all be handled by Core Data, freeing you to concentrate on creating unique features for your application. This video tutorial, which presents a general introduction to using Core Data, will walk you through the process of building a simple...
Even Halo: Reach on the Xbox 360 has hidden collectable items! All in the convenient (for the people hiding them) size of a small data pad! Earlier you got access to the first 9 data pads that you can get on any difficulty. Next, you will get a look on the next 9 data pads that you can only acquire while being on Legendary difficulty!
If you use Microsoft Excel on a regular basis, odds are you work with numbers. Put those numbers to work. Statistical analysis allows you to find patterns, trends and probabilities within your data. In this MS Excel tutorial from everyone's favorite Excel guru, YouTube's ExcelsFun, the 32nd installment in his "Excel Statistics" series of free video lessons, you'll learn how to group when the quantitative data are whole numbers, integers or discrete data and how to group when the quantitative ...
New to Microsoft Excel? Looking for a tip? How about a tip so mind-blowingly useful as to qualify as a magic trick? You're in luck. In this MS Excel tutorial from ExcelIsFun, the 255th installment in their series of digital spreadsheet magic tricks, you'll learn how to create a two-variable data table in Excel for what-if analysis. See the PMT function and learn about the formula equivalent to a data table.
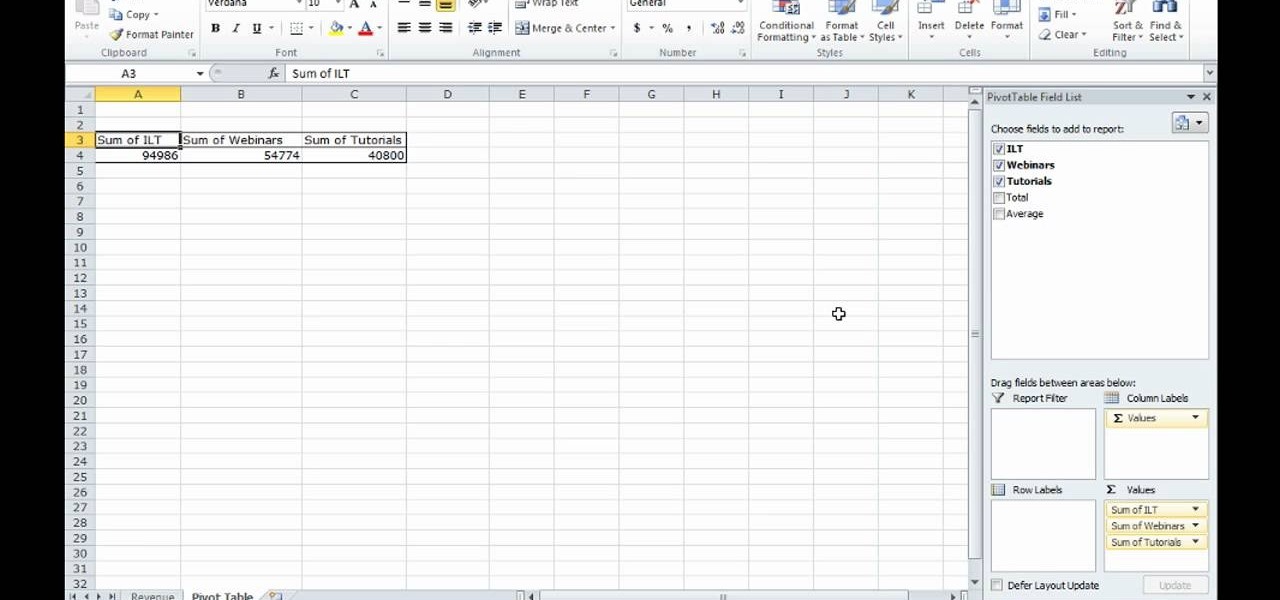
This video shows how to make a quick pivot table data filtering by using Excel 2010's ‘Slicer’ functionality. ‘Slicer’ delivers enhanced visual filtering method to allow you to get the data you need more quickly. When selecting a cell in the pivot table you will find ‘Slicer’ in the filter group of the ‘Insert’ tab. Click on ‘Slicer’ and an 'Insert Slicer' dialogue shows up where you can pick particular data fields from the slider list. Once you click on ‘OK’, the ‘Slicer’ objects with filter...
Data thieves don't have to be programming wizards to get their hands on your personal information. They often find hard drives that contain financial and other sensitive data at flea markets, charity shops, the city dump—even on eBay. In this video tutorial, PC World explains how to completely erase sensitive data from old drives before recycling or discarding them. Wipe your old hard drives with this how-to.
The Motorola Droid is getting a little long in the tooth, but it is still a remarkably capable phone with full keyboard, which makes it almost unique among it's Android-based competition. If you've rooted your phone (good for you!) and for some reason want to go back to the stock configuration that your phone was in when you took it out of the box, this video will show you how to do it. One good reason is if you want to update your phone's firmware, which will not work if you phone is rooted ...
Attention all Redditors: Between June 14 and June 18, Reddit experienced a data breach. The popular website claims it discovered the breach on June 19 and has since made the necessary moves to contain and eliminate the threat. Unfortunately, there isn't much they can do about the data was that accessed and stolen — your user data.
Looking to find the standard deviation of your set of values? Standard deviation quantifies how diverse the values of your data set are, and is useful in determining how different your numbers are from each other.
Hak5 isn't your ordinary tech show. It's hacking in the old-school sense, covering everything from network security, open source and forensics, to DIY modding and the homebrew scene. Damn the warranties, it's time to Trust your Technolust. In this episode, see how to hide secret data inside a photo.
In Halo: Reach for the Xbox 360, there is so much to do! The campaign, the multiplayer, the achievements! But One tough one to get is all 19 hidden data pads. Luckily for you, the first nine can be acquired on any difficulty, and in this video you will learn the locations of all nine of the initial data pads on levels such as Winter Contingency and Pillar of Autumn!
We all have our reasons for erasing personal data from a phone. Whether you just ended a bad relationship whose face you never want to see again (lots of text messages) or just want to restore your privacy on the cell phone, erasing may be your only option.
If you use Microsoft Excel on a regular basis, odds are you work with numbers. Put those numbers to work. Statistical analysis allows you to find patterns, trends and probabilities within your data. In this MS Excel tutorial from everyone's favorite Excel guru, YouTube's ExcelsFun, the 27th installment in his "Excel Statistics" series of free video lessons, you'll learn how to create a quantitative data dot plot chart using the REPT and COUNTIF functions.
If you use Microsoft Excel on a regular basis, odds are you work with numbers. Put those numbers to work. Statistical analysis allows you to find patterns, trends and probabilities within your data. In this MS Excel tutorial from everyone's favorite Excel guru, YouTube's ExcelsFun, the 16th installment in his "Excel Statistics" series of free video lessons, you'll learn how to cross tabulate & do percentage cross tabulation for categorical data using a pivot table (PivotTable).
If you use Microsoft Excel on a regular basis, odds are you work with numbers. Put those numbers to work. Statistical analysis allows you to find patterns, trends and probabilities within your data. In this MS Excel tutorial from everyone's favorite Excel guru, YouTube's ExcelsFun, the 17th installment in his "Excel Statistics" series of free video lessons, you'll learn how to cross tabulate & do percentage cross tabulation for categorical data using formulas rather than pivot tables.
If you use Microsoft Excel on a regular basis, odds are you work with numbers. Put those numbers to work. Statistical analysis allows you to find patterns, trends and probabilities within your data. In this MS Excel tutorial from everyone's favorite Excel guru, YouTube's ExcelsFun, the 10th installment in his "Excel Statistics" series of free video lessons, you'll learn how about data sets and the nominal, ordinal, interval and ration scales/levels of measurement and see two Pivot Tables that...