
How To: Beginners x86 Linux Assembly
Hello everyone! This is my first attempt at a tutorial here. There are a couple great assembly tutorials here, and I wanted to toss my coin in the fountain.

Hello everyone! This is my first attempt at a tutorial here. There are a couple great assembly tutorials here, and I wanted to toss my coin in the fountain.

Mobile data is expensive. The internet connection that comes with your cell phone plan is generally limited to a certain amount of gigabytes that can be downloaded before your monthly cap kicks in, at which point you run the risk of incurring costly overage fees.
Amazingly enough, some of us still have to worry about exceeding our monthly mobile data limits. You'd figure carriers would have given the customers what they want by now by offering truly unlimited plans, but with two conglomerates sitting atop the U.S. cellular market with fat pocketbooks that make for limitless lobbying, they can basically do whatever they want.

It's been rumored ever since the 2012 release of the Kindle Fire, and now Amazon's first smartphone is set to debut a little later this year.

If you're spending hours on your phone playing games like Angry Birds and Candy Crush Saga, or posting online to Google+ and Pinterest, you're probably being spied on. The latest releases from NSA whistle blower Edward Snowden reveal that the National Security Agency, and its UK counterpart, GCHQ, are mining the ad networks utilized in these apps to collect a trove of information on you.

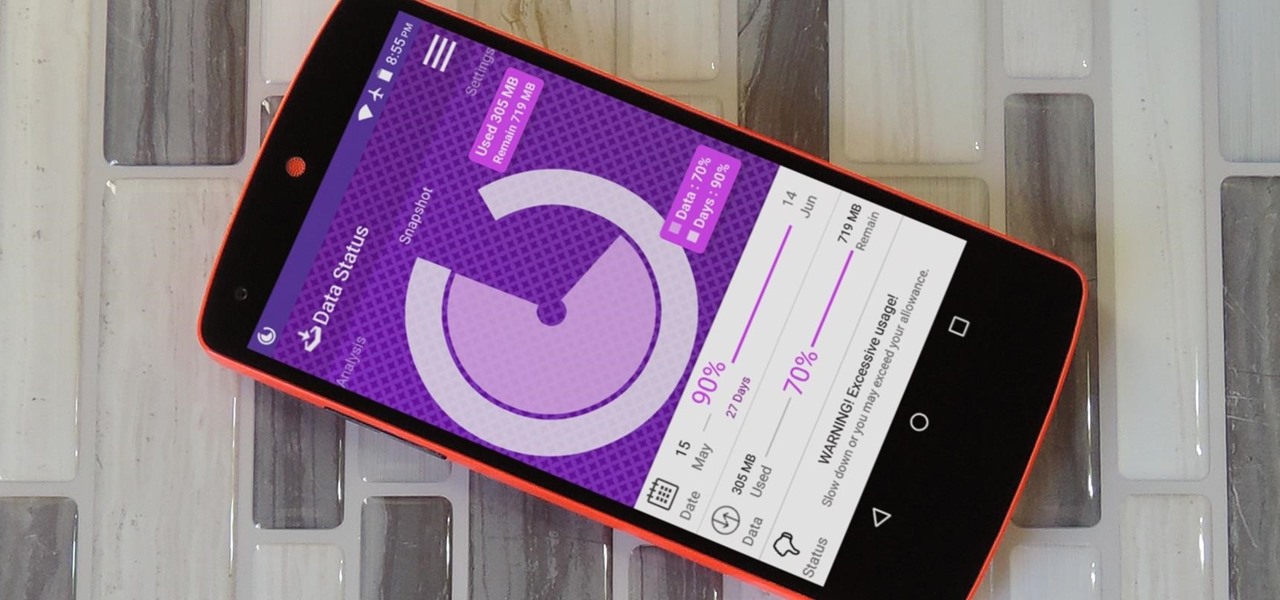
With the majority of smartphone carriers no longer offering unlimited data plans for the iPhone, monitoring how much mobile data you use is a key element to saving money on your phone bill.

Smartphones are becoming pocket computers, jammed full of data essential to our personal and professional lives. With AT&T's 360 Backup app you can protect your important information with the push of a few buttons.
If you picked up a new Xbox 360 Slim, the first thing you're going to want to do is transfer all your old saved game data from your old Xbox 360 to the new internal hard drive in the Slim 360.
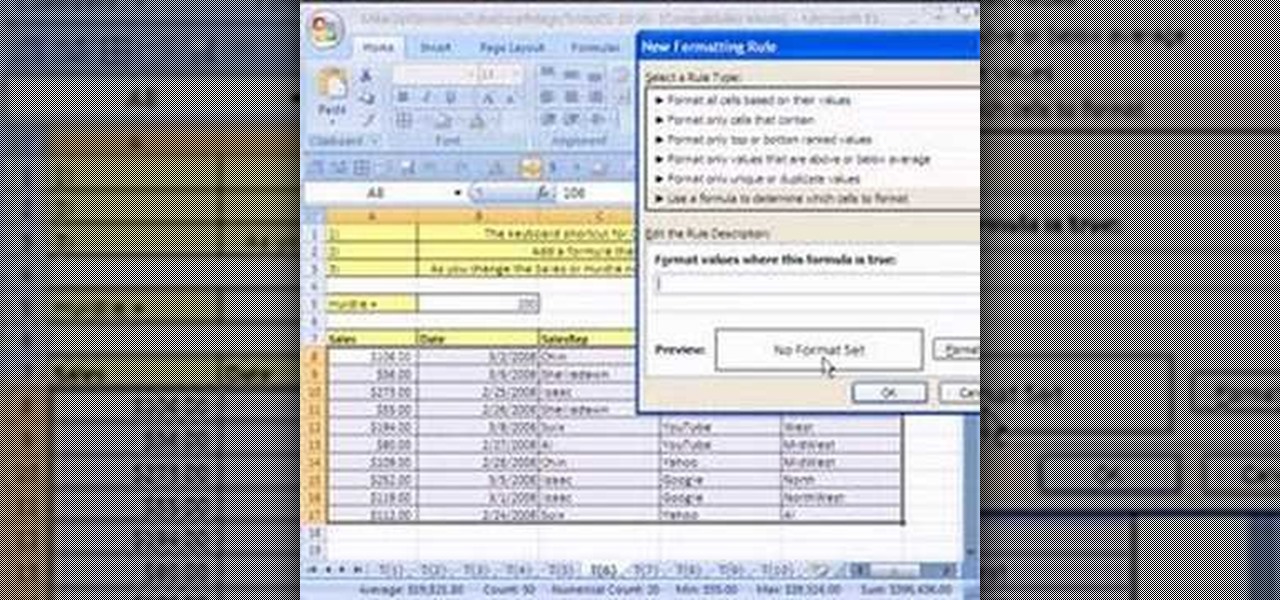
New to Microsoft Excel? Looking for a tip? How about a tip so mind-blowingly useful as to qualify as a magic trick? You're in luck. In this MS Excel tutorial from ExcelIsFun, the 6th installment in their series of digital spreadsheet magic tricks, you'll learn how to add conditional formatting to a whole row of data in an Excel sheet.
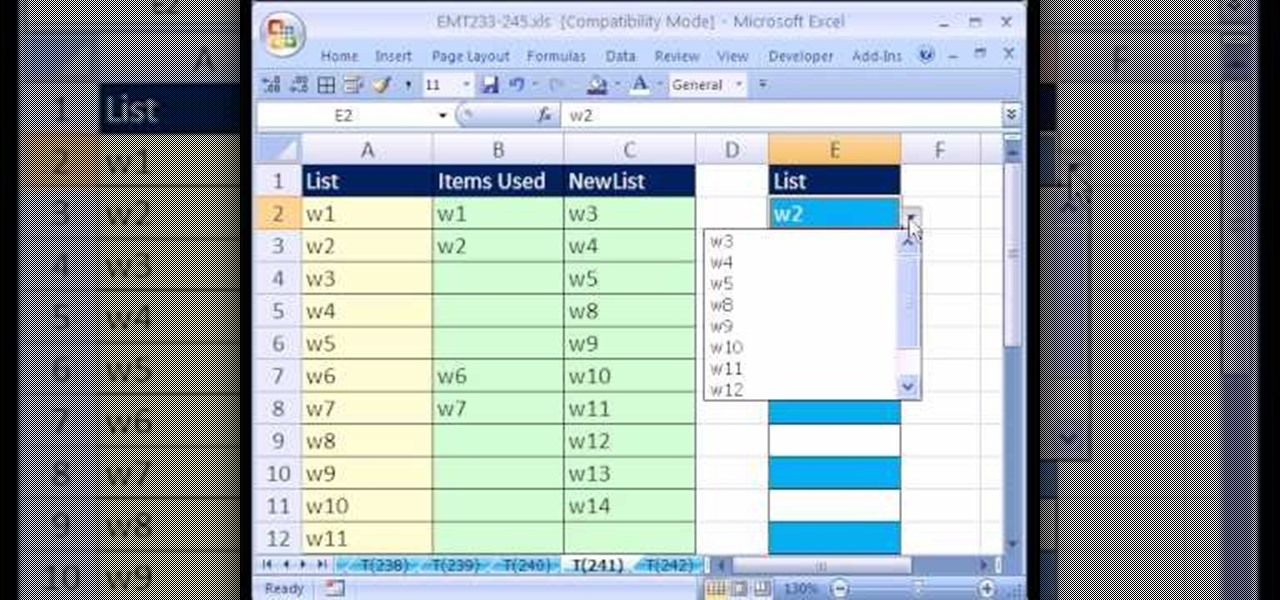
New to Microsoft Excel? Looking for a tip? How about a tip so mind-blowingly useful as to qualify as a magic trick? You're in luck. In this MS Excel tutorial from ExcelIsFun, the 241st installment in their series of digital spreadsheet magic tricks, you'll learn how to create a data validation drop-down cell list where the list shrinks as you select values.
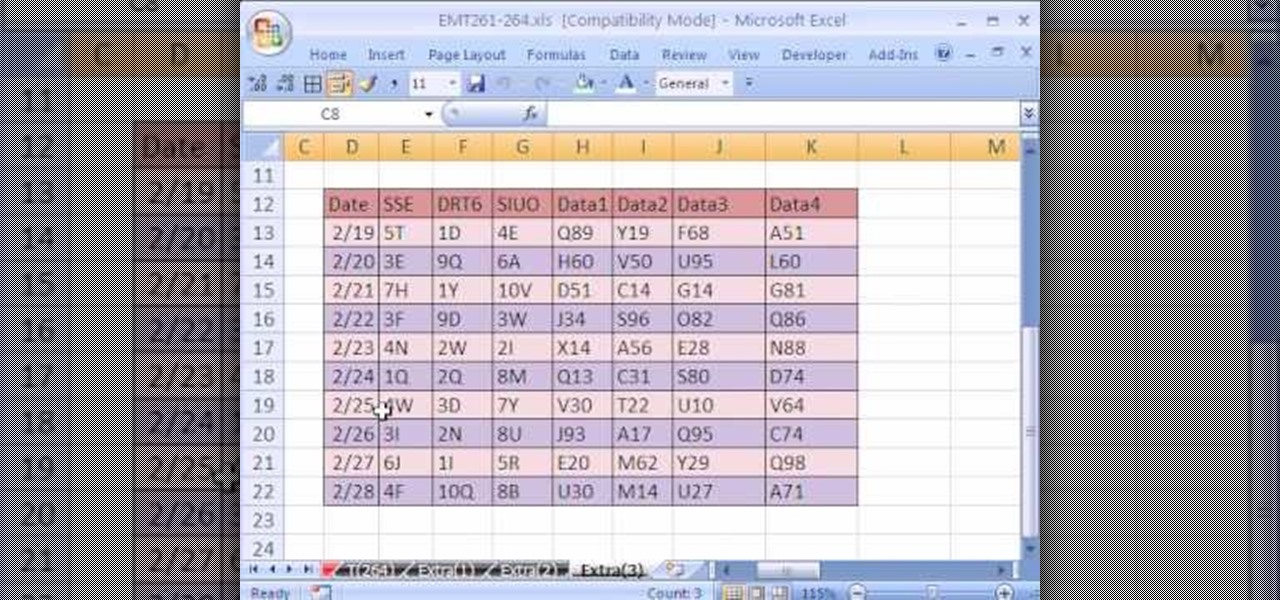
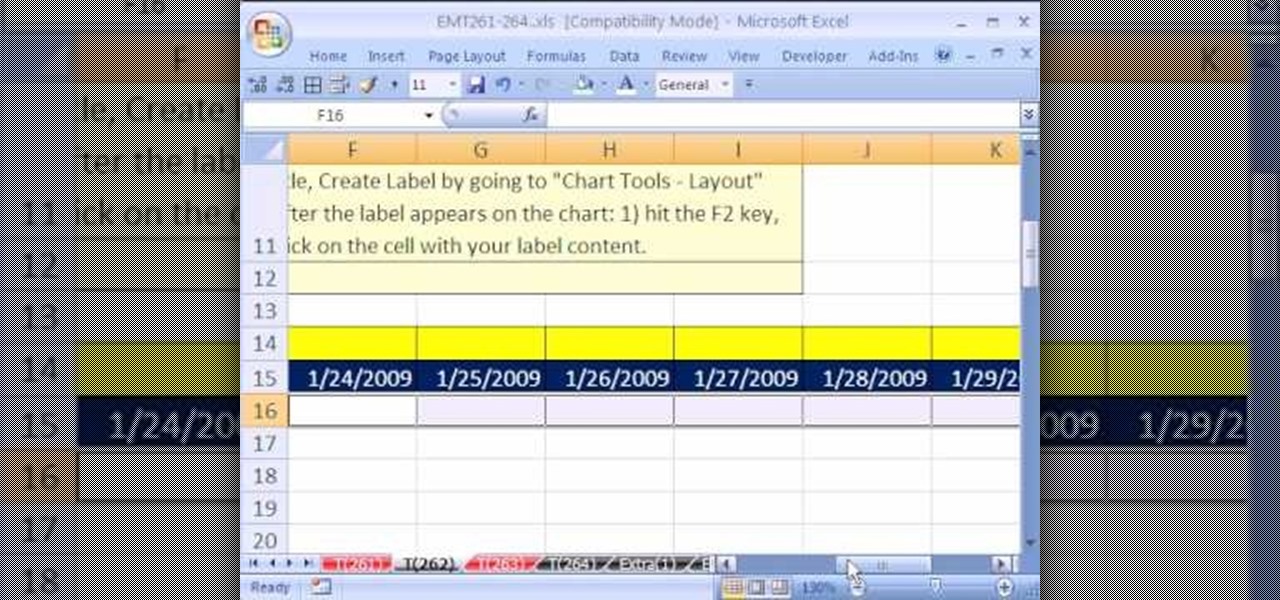
New to Excel? Looking for a tip? How about a tip so mind-blowingly useful as to qualify as a magic trick? You're in luck. In this Excel tutorial from ExcelIsFun, the 264th installment in their series of digital spreadsheet magic tricks, you'll learn how to use a recorded macro to take a data set and add a new column, concatenate data from 3 columns, and delete unwanted columns.

The new Pyro FX in Houdini 10 are very impressive with improved workflow. The Pyro FX are great for creating 3D fire and smoke effects. And in this video tutorial series, you will learn the Pyro FX workflow in-depth and the parameters used to create fire and smoke effects. You will also see how volumetric data is created and recorded, and how to visualize it.
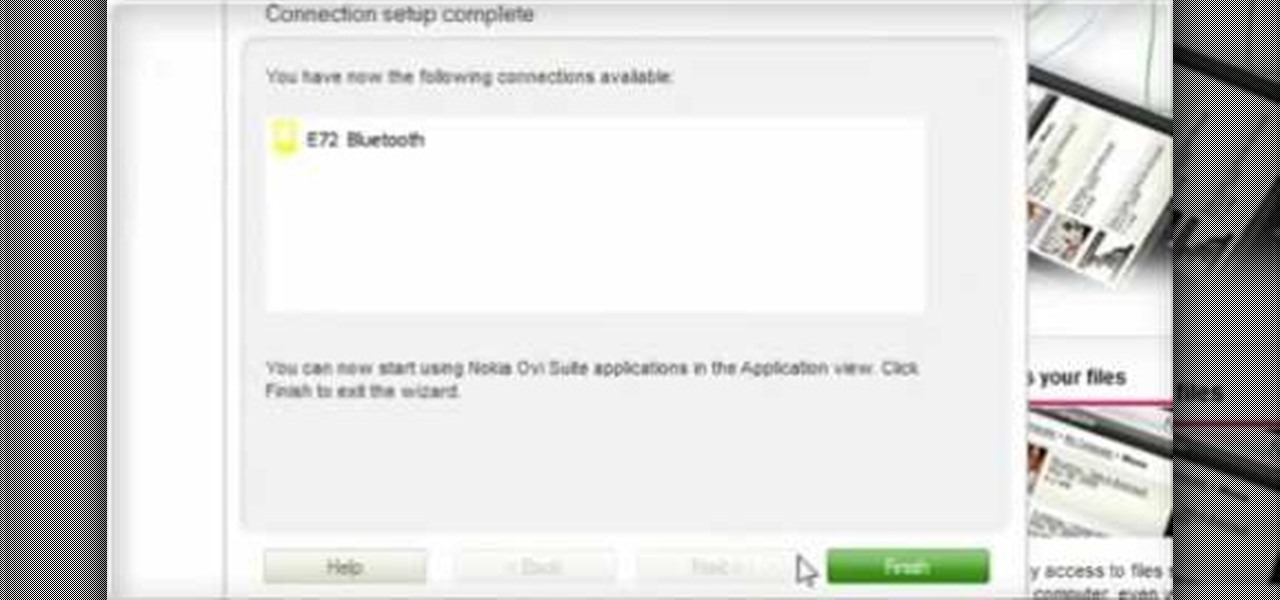
Calendar data, images, sounds, videos, and messages can be easily synchronized between your Nokia Booklet 3G netbook and supported mobile devices and phones when the two are connected using Bluetooth. To find out how to use Nokia's Ovi Suite software to synchronize your data, take a look at this tech support video from the company.

If you've had a hard drive go bad, you know the feeling of helplessness that comes from thinking you may have just lost all your data. This video will show you how to recover data from an Xbox 360 hard drive.
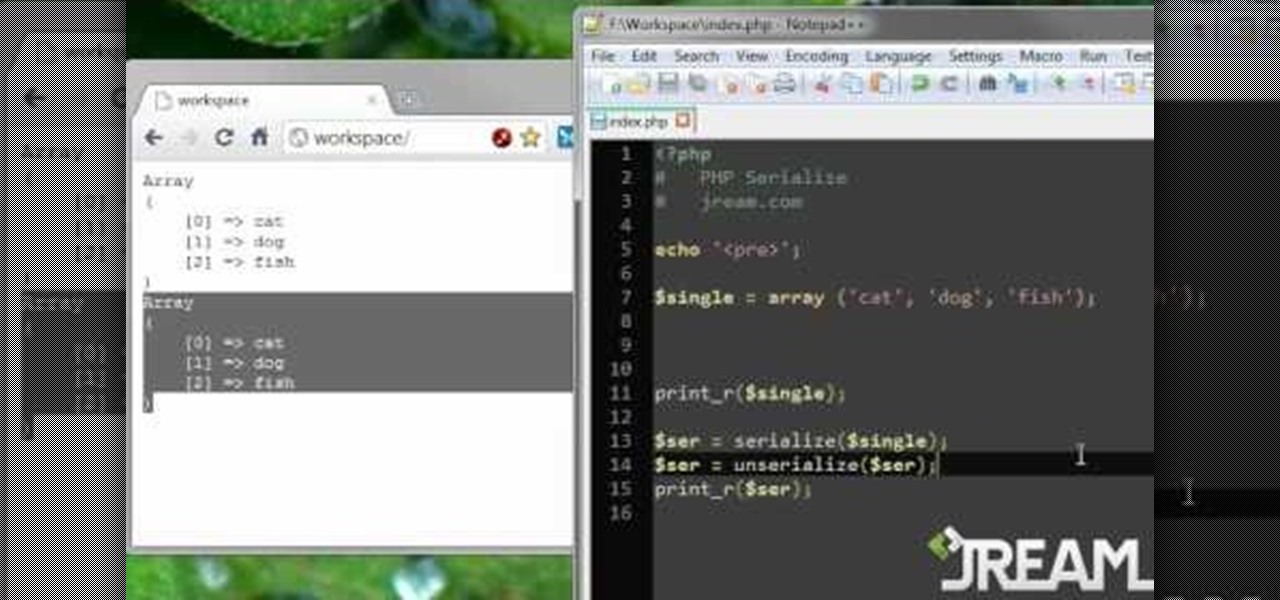
Learn to serialize your data and convert multidimensional arrays into a single string by following along with this informative video from JREAMdesign. Serializing your data essentially compacts it from an expanded array into a string series of values, a very handy PHP feature indeed.

Most of the most important information in the world is stored on computers, and if your part of it gets deleted in some way you're probably in trouble. There are lots of data recovery options out there, and this video will show you how to figure out what sort you need for your hard drive / data storage problem.
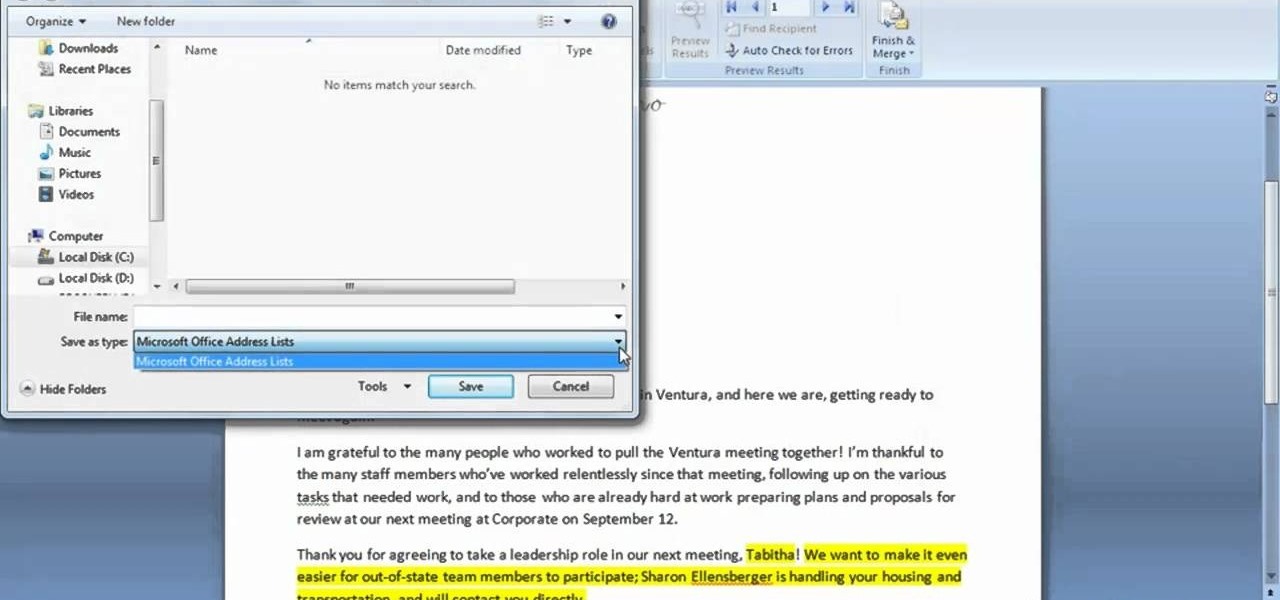
In this clip, you'll learn how to add a new data source when using the Mail Merge tool within MS Word 2007. Whether you're new to Microsoft's popular word processing application or a seasoned professional merely looking to pick up a few new tips and tricks, you're sure to benefit from this video tutorial. For complete instructions, and to get started creating new data sources yourself, take a look.
You can use your Apple product (iPod, iPhone or iPad) to store your data and then send it to a different computer using a wifi connection. You'll need to download the File Sharing program from the Apple store and make a note of the IP address you want to send your data to.
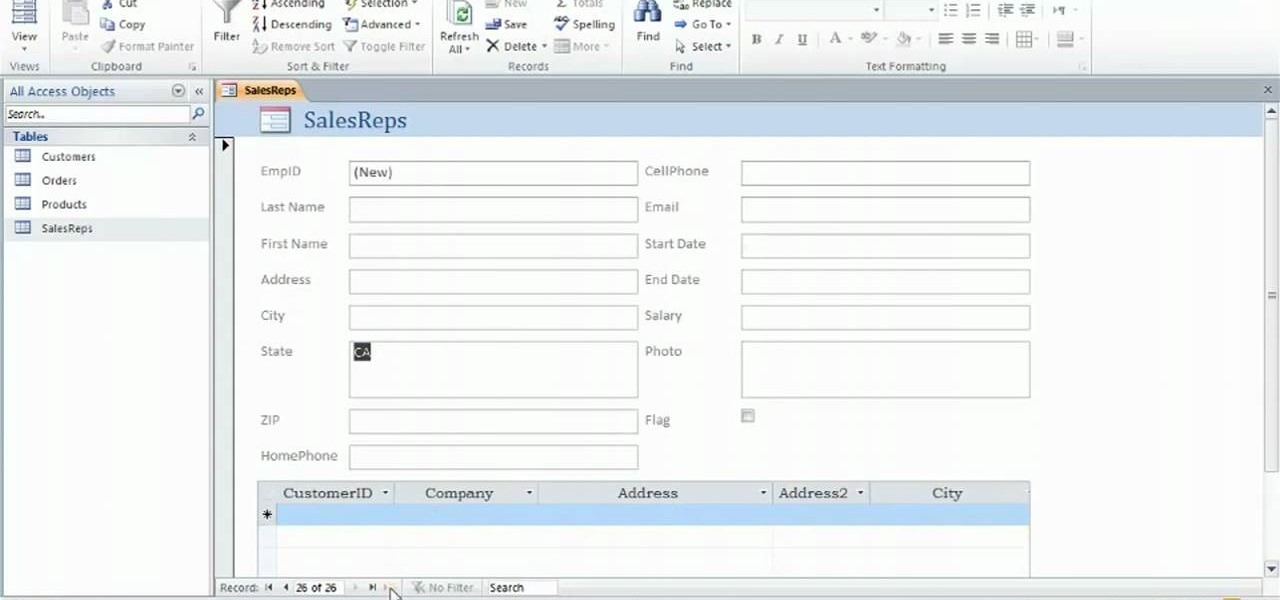
Learn how to create data-entry forms when working in Microsoft Access 2010. Whether you're new to Microsoft's popular database management application or a seasoned MS Office professional just looking to better acquaint yourself with the Access 2010 workflow, you're sure to be well served by this video tutorial. For more information, and to get started using data-entry forms in your own Access projects, watch this free video guide.

If you use Microsoft Excel on a regular basis, odds are you work with numbers. Put those numbers to work. Statistical analysis allows you to find patterns, trends and probabilities within your data. In this MS Excel tutorial from everyone's favorite Excel guru, YouTube's ExcelsFun, the 43rd installment in his "Excel Statistics" series of free video lessons, you'll learn how to use the Excel Data Analysis add-in descriptive statistics tool.

If you use Microsoft Excel on a regular basis, odds are you work with numbers. Put those numbers to work. Statistical analysis allows you to find patterns, trends and probabilities within your data. In this MS Excel tutorial from everyone's favorite Excel guru, YouTube's ExcelsFun, the 29th installment in his "Excel Statistics" series of free video lessons, you'll learn how to create quantitative data cross tabulation using a pivot table (PivotTable).

If you use Microsoft Excel on a regular basis, odds are you work with numbers. Put those numbers to work. Statistical analysis allows you to find patterns, trends and probabilities within your data. In this MS Excel tutorial from everyone's favorite Excel guru, YouTube's ExcelsFun, the 11th installment in his "Excel Statistics" series of free video lessons, you'll learn how to work with, and create charts for, cross-sectional and time-series data.

If you use Microsoft Excel on a regular basis, odds are you work with numbers. Put those numbers to work. Statistical analysis allows you to find patterns, trends and probabilities within your data. In this MS Excel tutorial from everyone's favorite Excel guru, YouTube's ExcelsFun, the 13th installment in his "Excel Statistics" series of free video lessons, you'll learn how to install the Excel 2007 Data Analysis add-in.

New to Microsoft Excel? Looking for a tip? How about a tip so mind-blowingly useful as to qualify as a magic trick? You're in luck. In this Excel tutorial from ExcelIsFun, the 574th installment in their series of digital spreadsheet magic tricks, you'll learn how to import data from Microsoft Access as well as how to use the VLOOKUP function to populate data into a printable form.

In this video Jesse Liberty dives deeper into data-binding, demonstrating in detail how to create business classes that represent data retrieved from a web service, and how to bind them to various controls using a combination of Blend and Visual Studio. This is a detailed, easy to follow video, to help you use the program, and all it entails.

This video is an instructional guide about Graph Linear Equations presented in algebraic form. It is an easy to follow, step by step guide to solving such equations using the graph intercept formula. The first example equation is Y = 2x -1 over y = mx + b. The video then shows you how to breakdown the equation into manageable sums using fractions to represent the data, and then presents the formula for interpreting the answer from these sums onto the graph co-ordinates. The second and third e...

A major plus in using Microsoft Excel is its ability to sort large amounts of data. What's the use of Excel, if you don't know how to sort? In this short video clip, learn how to go about sort your data in the order needed.
New to Excel? Looking for a tip? How about a tip so mind-blowingly advanced as to qualify as a magic trick? You're in luck.

In this video the instructor gives tips on how to erase a PC hard drive. An MIT study shows that 74 percent of the discarded hard drives contain private data on them that can be read and recovered by others. So you should learn how to completely erase all the data so that no one can recover or read from it later. Now formatting the drive or deleting a few files wont do it. For this you will need to have a proper software that meets or exceeds that US Department of Defense standards for data r...

In this video tutorial the instructor shows how to calculate the acceleration of a car on an inclined plane. He goes on to solve a problem he came across which is based on the acceleration of a car on an inclined plane. He shows how to solve this problem by showing how to extract the data from the question and draws a diagram to get a clear understanding of the problem. Now he marks the forces acting on the vehicle and goes on to specify his axes and how to split the components of force along...
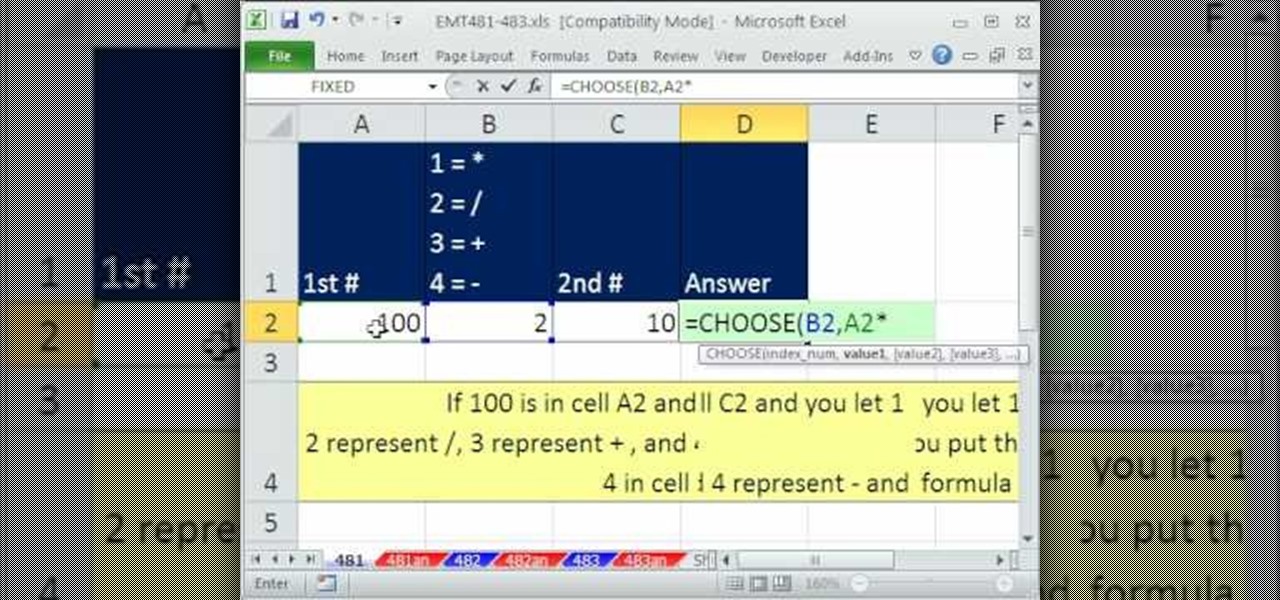
In this Excel magic trick video the tutor shows how to change operator in a formula from a drop down using Choose function. He shows a basic work book which can be downloaded from the internet for hands-on to the tutorial. In this trick the tutor shows how to include some operators in a drop down box of a cell and based on this drop down value change the operators in equations that are using this cell there by dynamically altering the equation and the value produced using the equation. For th...

MySQL is a database for serving data on the web. This video teaches viewers how to connect to a database and add data in PHP & MySQL. PHPMyAdmin is an interface that allows you to interact with MySQL more easily. Use the form in the program to create a database; choose the name for your database and select 'create'. Next you can create tables within your database, also using the forms provided. Within the tables you can set your variables; PHPMyAdmin has fields that allow you to choose the ty...

Create a black brute with changing cloth on http://tobeburtan.mybrute.com. Before you start you will need to have 1: Monzilla firefox 2: Temper data.
The Microsoft Office Access 2007 relational database manager enables information workers to quickly track and report information with ease thanks to its interactive design capabilities that do not require deep database knowledge. In this Microsoft Access video tutorial, you'll learn about sorting data using queries. For detailed instructions, and to get started using queries to sort data for yourself, watch this how-to.

Microsoft ASP.NET is a free technology that allows programmers to create dynamic web applications. ASP.NET can be used to create anything from small, personal websites through to large, enterprise-class web applications. All you need to get started with ASP.NET is the free .NET Framework and the free Visual Web Developer.this video tutorial will demonstrate the new ListView control in Visual Studio 2008. Because the ListView is data-driven, you will need a data source. You can use any data so...

Microsoft ASP.NET is a free technology that allows programmers to create dynamic web applications. ASP.NET can be used to create anything from small, personal websites through to large, enterprise-class web applications. All you need to get started with ASP.NET is the free .NET Framework and the free Visual Web Developer. By creating a new website, this video tutorial will demonstrate the new ListView control in Visual Studio 2008. Because the ListView is data driven, you will need a data sou...
Here is a quick video on how to convert Excel spreadsheet data to XML for import into Flash or Flex. Don't spend time typing all that data again, instead create a schema in Excel and convert it to XML.

In this helpful electronics tutorial video, you can learn how to erase data and information from your Apple iPhone. This how-to video makes erasing data from your iPhone easy and is especially helpful for new iPhone owners.
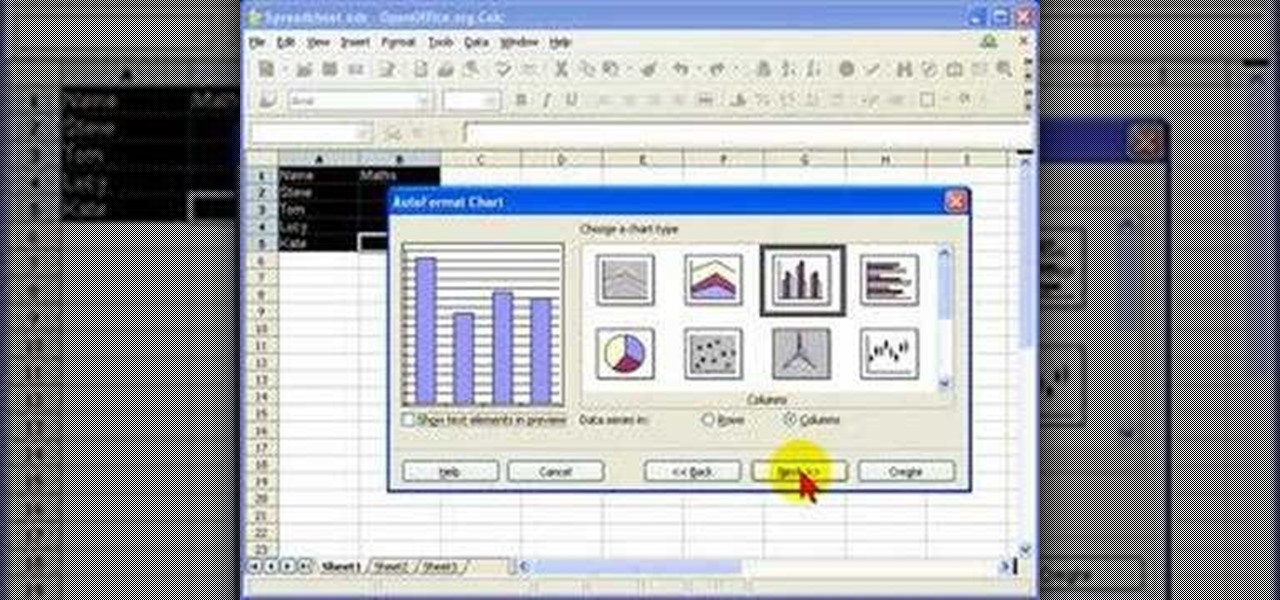
In this screencast tutorial, Steve shows you how to quickly and simply create a bar chart, from the data you have entered into your worksheet in Open Office Calc. If you're looking for a simple and clear way to represent your statistical data, then a simple bar chart is an option you should look at using. So check out this tutorial and start making OpenOffice Calc bar charts today.
Learn how to Import External Data (i.e data from web pages) dynamically into Excel in Microsoft's Office 2007.