In this clip, you'll learn how to both enable and disable Data Execution Prevention on a Microsoft Windows PC running either XP or Vista. It's easy! So easy, in fact, that this home-computing how-to from the folks at Britec can present a complete overview of the process in just over five minutes. For more information, including step-by-step instructions, take a look.
In this clip, you'll learn what it takes to copy and transfer data from a corrupted Windows profile to a new profile. It's easy! So easy, in fact, that this home-computing how-to from the folks at Britec can present a complete overview of the process in just over five minutes. For more information, including step-by-step instructions, take a look.

In this tutorial, we learn how to make your first graph in Microsoft Excel. First, open a new graph and enter in your data. Click and drag down from the original date you enter to have the other dates automatically entered in. Enter the rest of your information, then highlight all the data. Go to the menu and click "insert", then "chart". Now, go through the chart wizard to select what kind of chart you want to make. When you are finished entering all your preferences, change your values so t...
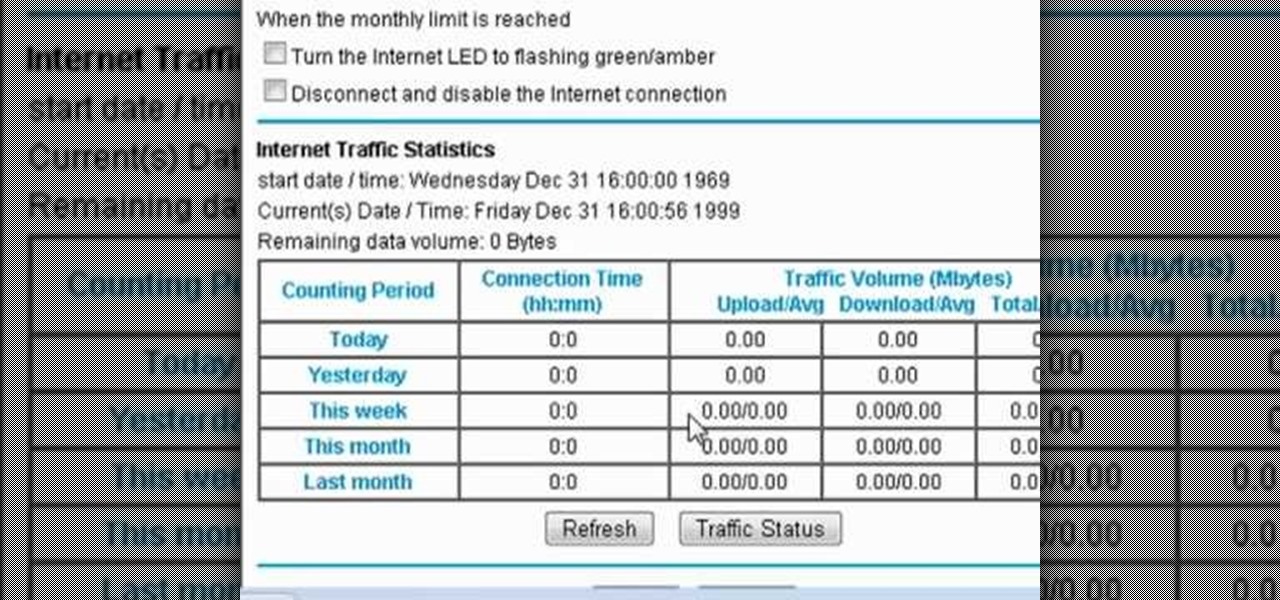
If your Internet plan includes a data limit, you might want to take certain precautions against accidentally exceeding it—like, for example, disabling your router This clip will show you how it's done. It's easy! So easy, that this video tutorial can present a complete, step-by-step overview of the process in about three minutes. For more information, including detailed, step-by-step instructions, watch this video guide.

Worried about the new capped data plans for iPhone and iPad? They may actually save you money. Here's how to check. Whether you're the proud owner of an Apple iPhone 3G or perhaps just considering picking one up second hand, you're sure to benefit from this free video tutorial. For more information, including a detailed overview, watch this iPhone user's guide.

This video tutorial discusses how to use SynthEyes camera tracking data within Cinema 4D or C4D. Whether you're new to MAXON's popular 3D modeling application or are just looking to get better acquainted with Cinema 4D and its various features and functions, you're sure to enjoy this free video software tutorial. For more information, and to get started using this trick in your own Cinema 4D projects, watch this 3D modeler's guide.

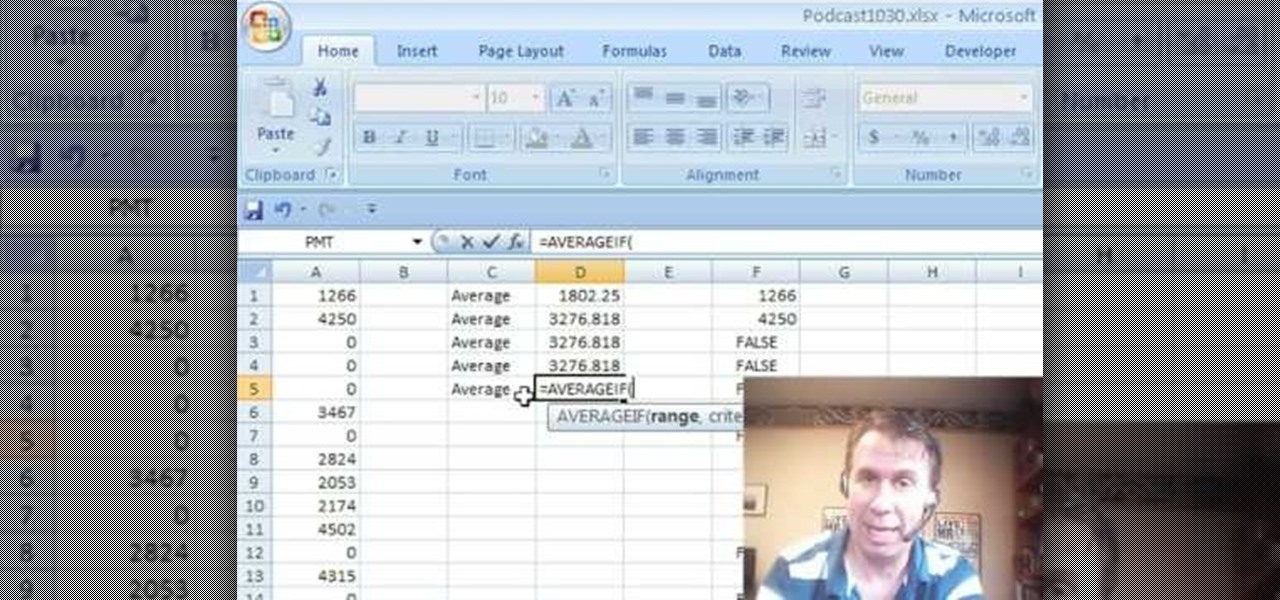
New to Microsoft Excel? Looking for a tip? How about a tip so mind-blowingly useful as to qualify as a magic trick? You're in luck. In this MS Excel tutorial from ExcelIsFun and Mr. Excel, the 13th installment in their joint series of digital spreadsheet magic tricks, you'll learn how to create formulas that will calculate the AVERAGE excluding zeros (0) in the original data set.
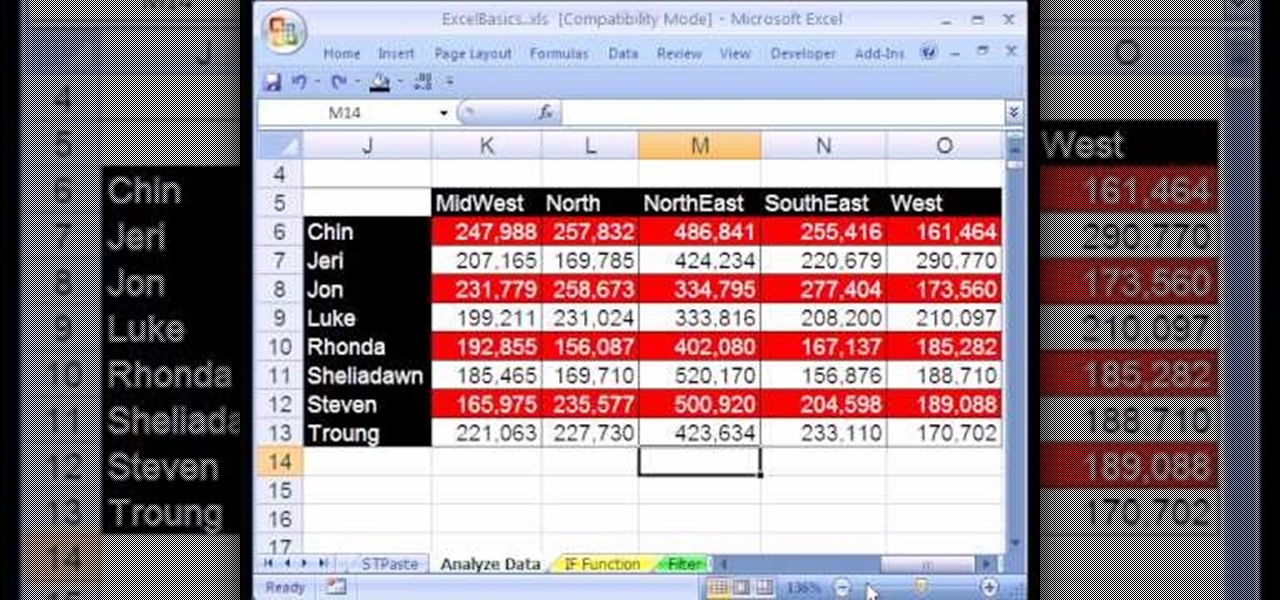
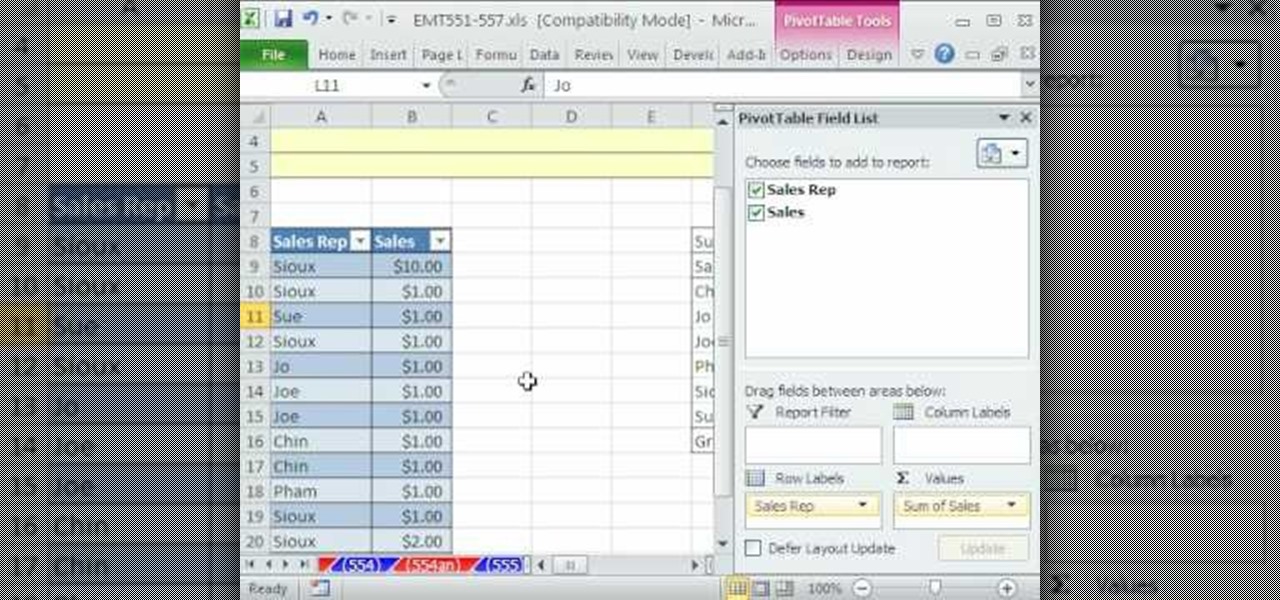
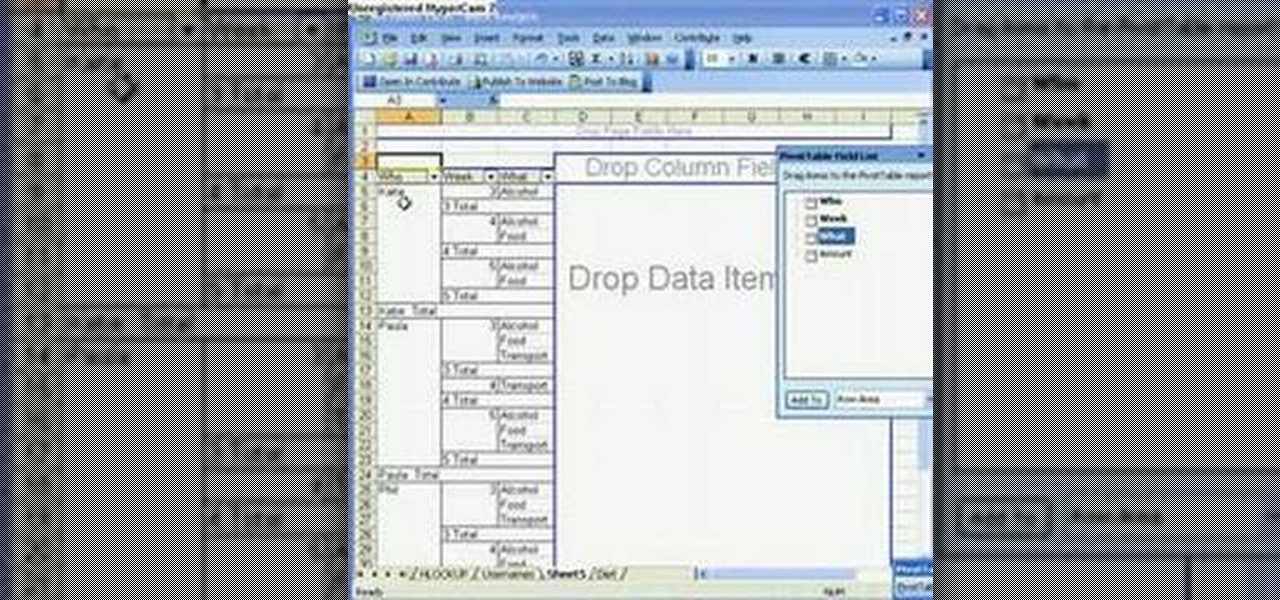
If you're looking to learn how to use Microsoft Excel, a video series from digital spreadsheet guru ExcelIsFun is a great place to start. But which of his many series should you choose? The one titled "Excel Basics," that's which! In this free video MS Excel lesson, the 20th installment in said basics series, you'll learn how to use pivot tables (PivotTables) to analyze and summarize data.
If you use Microsoft Excel on a regular basis, odds are you work with numbers. Put those numbers to work. Statistical analysis allows you to find patterns, trends and probabilities within your data. In this MS Excel tutorial from everyone's favorite Excel guru, YouTube's ExcelsFun, the 20th installment in his "Excel Statistics" series of free video lessons, you'll learn how to take raw quantitative (numerical) data and figure out how to group it into classes so that you can have categories an...
New to Microsoft Excel? Looking for a tip? How about a tip so mind-blowingly useful as to qualify as a magic trick? You're in luck. In this MS Excel tutorial from ExcelIsFun, the 90th installment in their series of digital spreadsheet magic tricks, you'll learn how to create a dynamic, two-way IF function lookup formula for pulling data from a different Workbook.
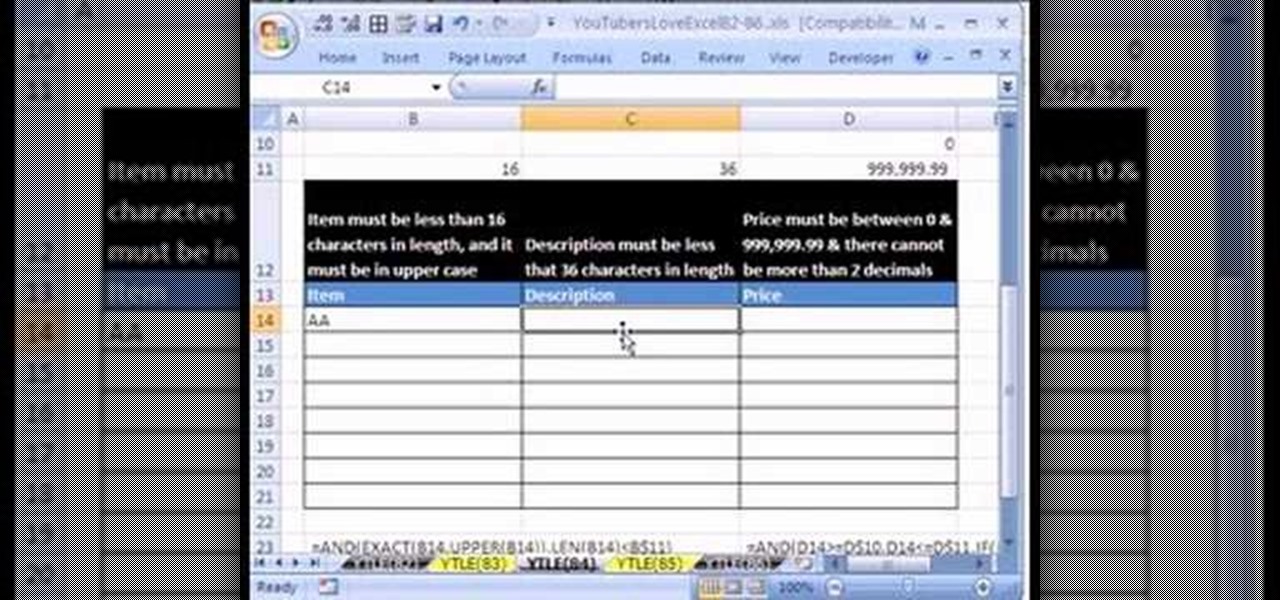
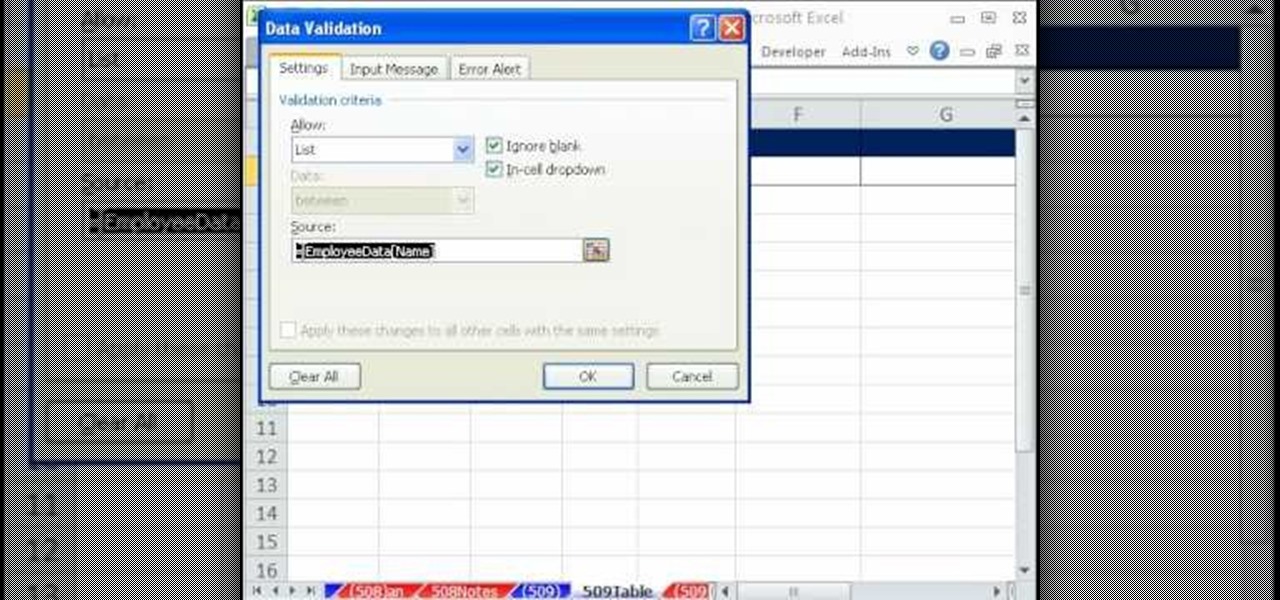
Love Microsoft Excel? This clip contains a tip that just might induce you to. With this free video tutorial from ExcelIsFun, the 84th installment of his "YouTubers Love Excel" or YTLE series of free video MS Excel lessons, you'll learn how to use custom true/false formulas for data validation and also see how to add an error message.
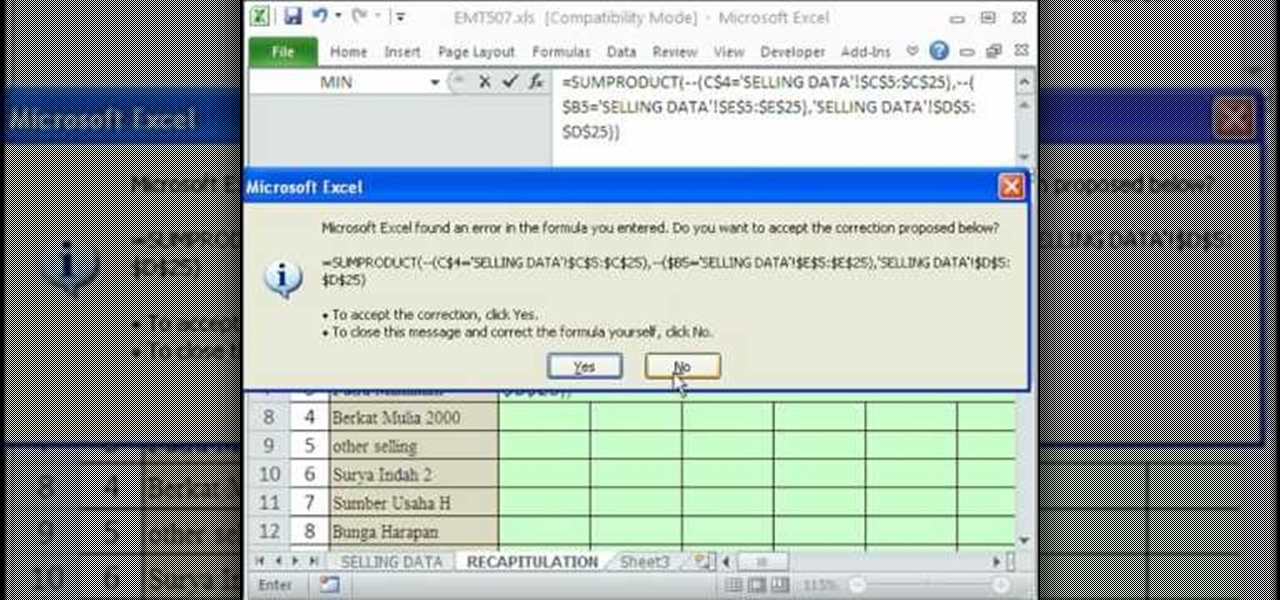
New to Microsoft Excel? Looking for a tip? How about a tip so mind-blowingly useful as to qualify as a magic trick? You're in luck. In this MS Excel tutorial from ExcelIsFun, the 507th installment in their series of digital spreadsheet magic tricks, you'll learn how to take badly setup data (not in database/table format) and summarize it by date and shipping name into table format report.
New to Microsoft Excel? Looking for a tip? How about a tip so mind-blowingly useful as to qualify as a magic trick? You're in luck. In this MS Excel tutorial from ExcelIsFun, the 556th installment in their series of digital spreadsheet magic tricks, you'll learn how to change the source data for a pivot table (PivotTable).
New to Microsoft Excel? Looking for a tip? How about a tip so mind-blowingly useful as to qualify as a magic trick? You're in luck. In this MS Excel tutorial from ExcelIsFun, the 258th installment in their series of digital spreadsheet magic tricks, you'll learn how to make charts from noncontiguous data in MS Excel.
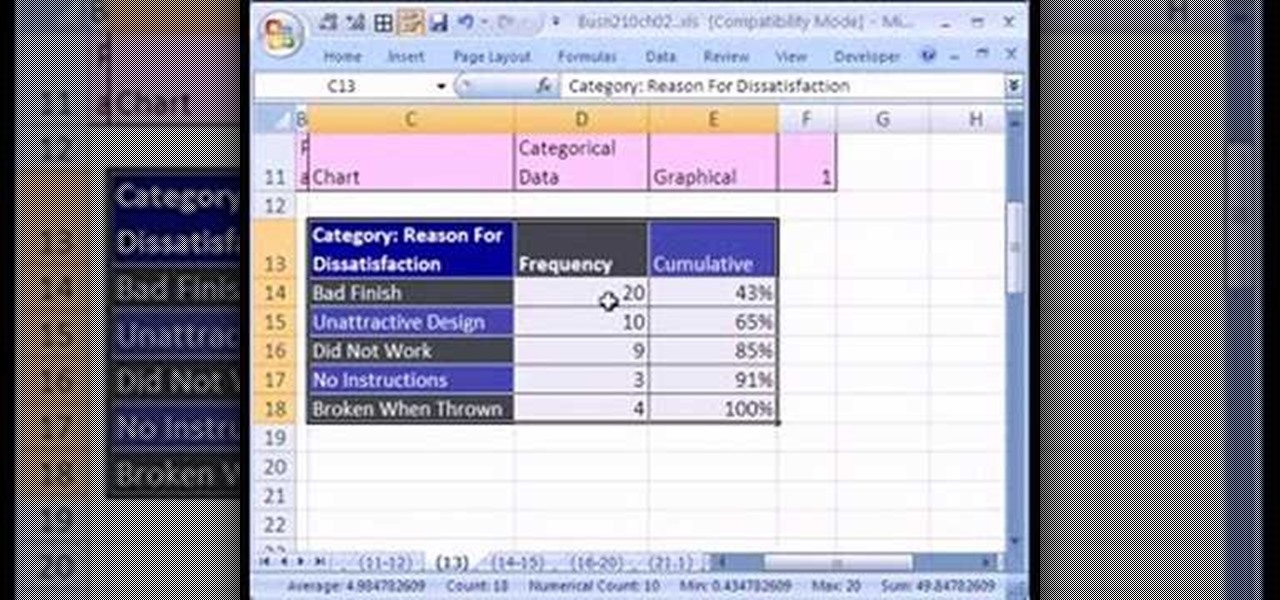
If you want to create a Pareto Chart for categorical data in MS Excel you should first have your data input into Excel already. From your data, you should highlight the cells that you want to count the frequency for and in the frequency box you should type in =COUNTIF and highlight the data you want the frequency for and put in F4 and then press , click on cell to the left and click enter. Now this will work all the way down. If you have not sorted it, you can right click and then click sort....
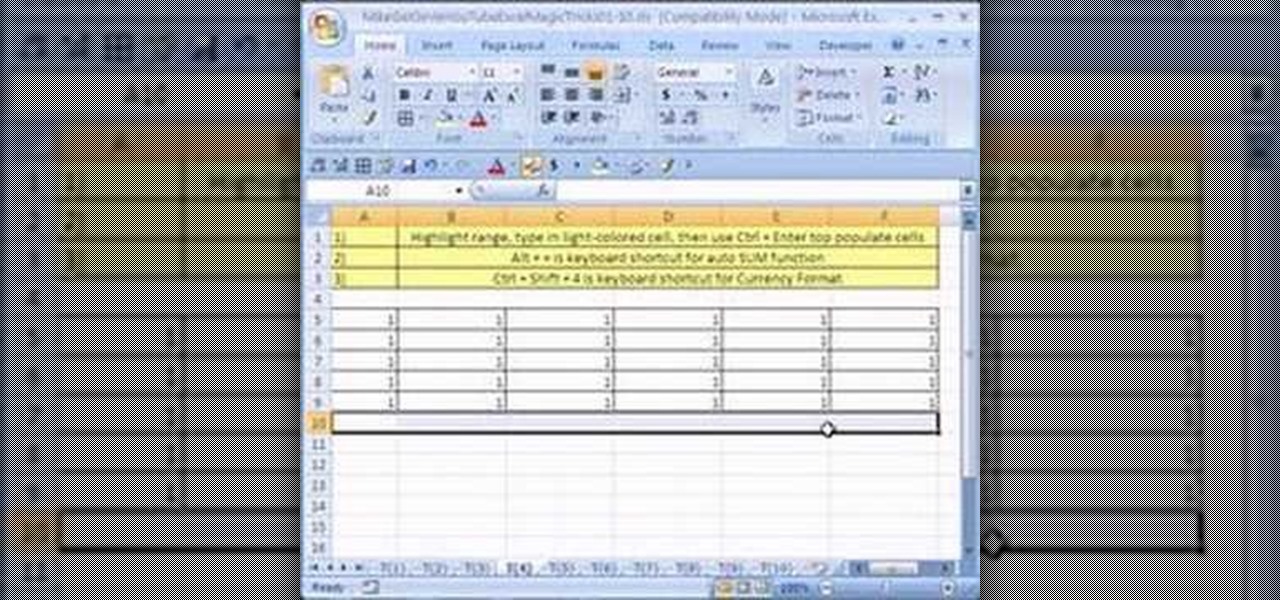
New to Microsoft Excel? Looking for a tip? How about a tip so mind-blowingly useful as to qualify as a magic trick? You're in luck. In this MS Excel tutorial from ExcelIsFun, the 4th installment in their series of digital spreadsheet magic tricks, you'll learn how to add data or a formula to a range of cells by using the Excel's ever-useful ctrl+enter keyboard shortcut.
New to Microsoft Excel? Looking for a tip? How about a tip so mind-blowingly useful as to qualify as a magic trick? You're in luck. In this MS Excel tutorial from ExcelIsFun, the 318th installment in their series of digital spreadsheet magic tricks, you'll learn how to extract data with the MID function and use VLOOKUP to retrieve a date.
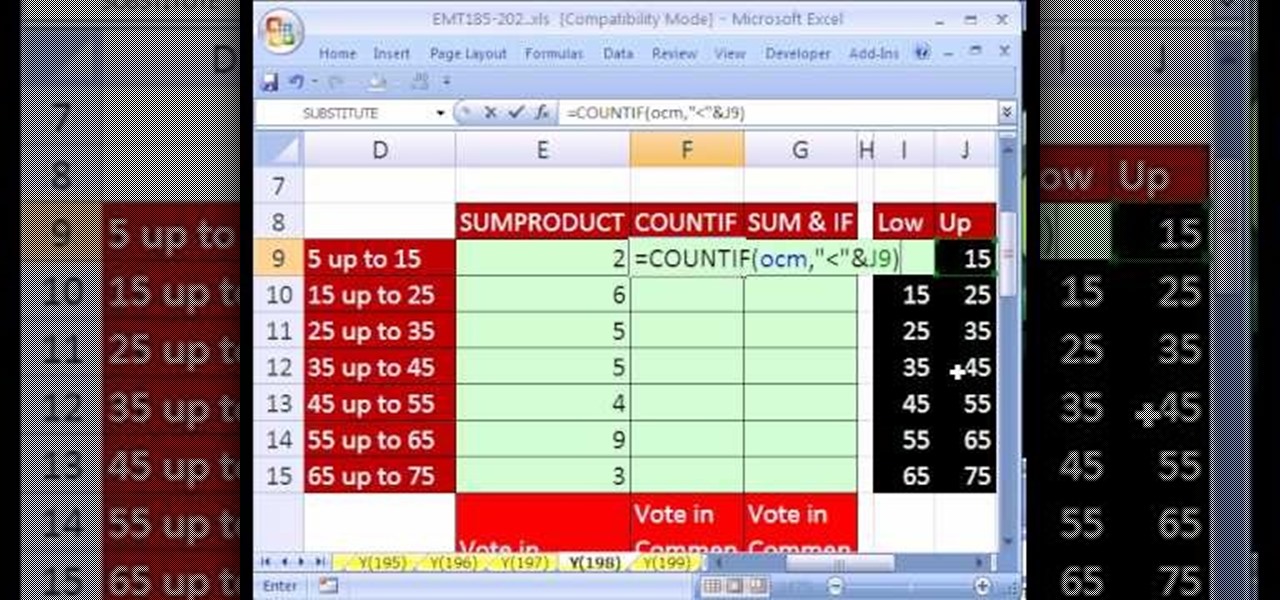
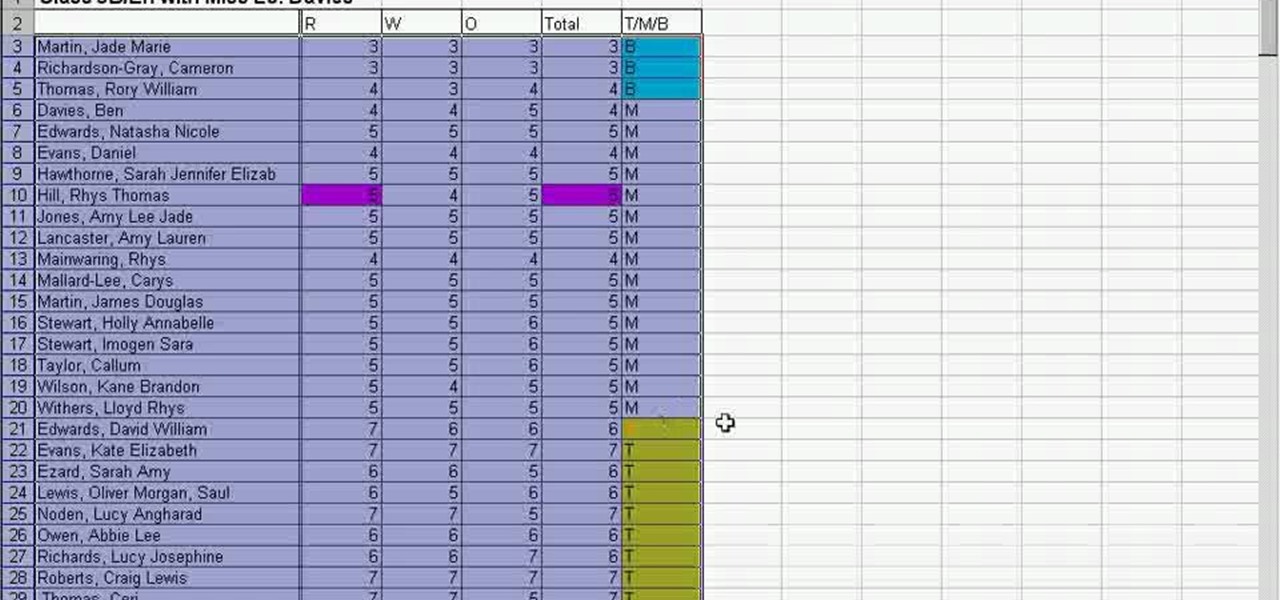
New to Microsoft Excel? Looking for a tip? How about a tip so mind-blowingly useful as to qualify as a magic trick? You're in luck. In this MS Excel tutorial from ExcelIsFun, the 198th installment in their series of digital spreadsheet magic tricks, you'll learn three different methods for counting quantitative data in categories that include a lower limit but not an upper limit.
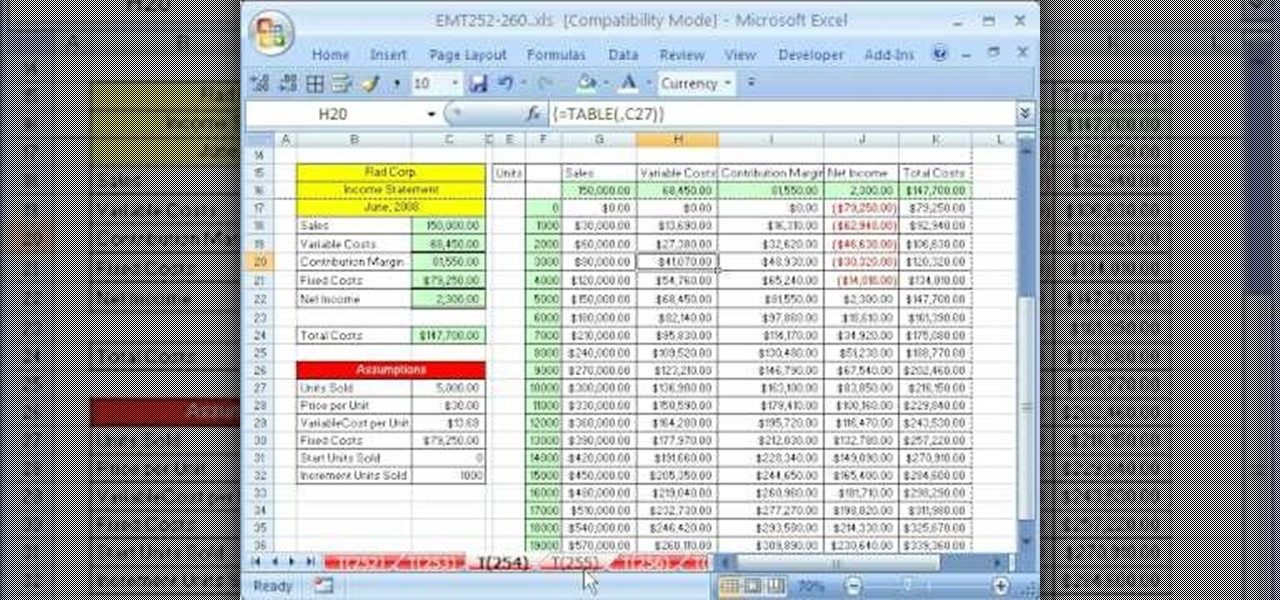
New to Microsoft Excel? Looking for a tip? How about a tip so mind-blowingly useful as to qualify as a magic trick? You're in luck. In this MS Excel tutorial from ExcelIsFun, the 254th installment in their series of digital spreadsheet magic tricks, you'll learn how to do contribution margin income statement analysis across various units using a one-variable data table.
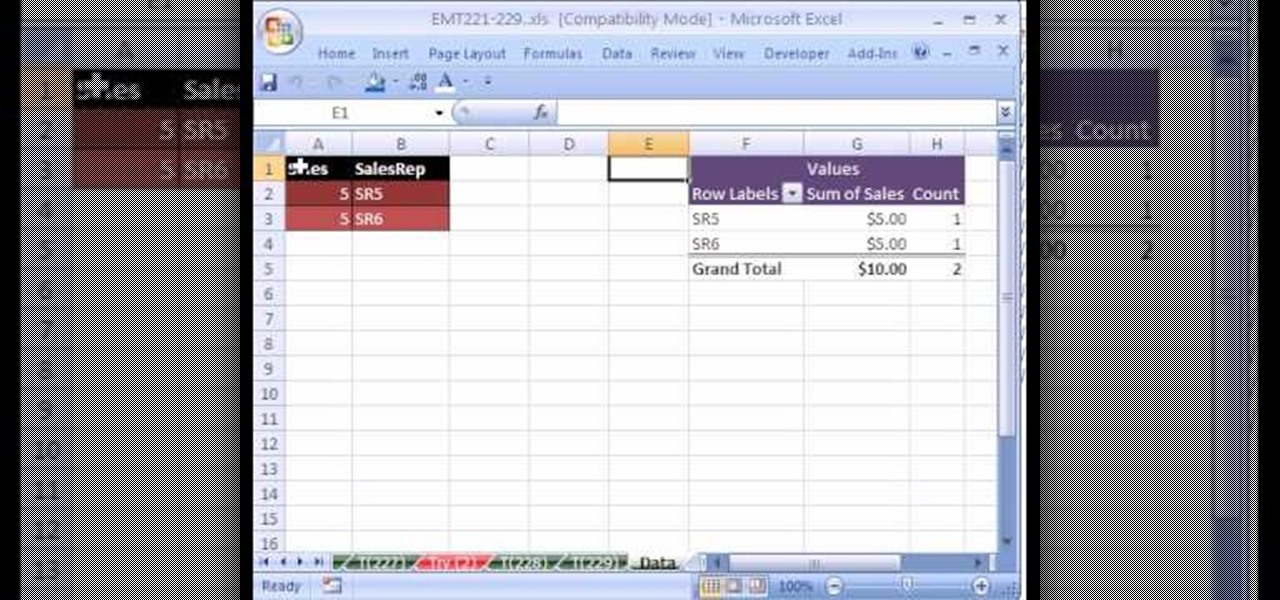
New to Microsoft Excel? Looking for a tip? How about a tip so mind-blowingly useful as to qualify as a magic trick? You're in luck. In this MS Excel tutorial from ExcelIsFun, the 229th installment in their series of digital spreadsheet magic tricks, you'll learn how to dump data from a pivot table by macro in Microsoft Excel.
Using Excel, sorting large or small pools of data has never been easier. In this Excel tutorial, learn how to sort a range of data in Excel and what steps to do so, from start to finish. Sort totals, percentages, or decimals in a range in descending or acsending order with help from this video.
In this video tutorial, viewers will learn how to create a table for the VLOOKUP function in Excel. Create a dynamic table for the VLOOKUP function as well as a dynamic lookup area so that as you add new data or columns to the Lookup table. Create dynamic ranges using the Excel Table feature and Table Formula Nomenclature for the Data Validation drop-down list, the VLOOKUP table and the MATCH table. See an IF function formula that creates new labels as new columns are added to the lookup tabl...
Here Danny Beales shows you how to quickly clear your Firefox cache and cookies. To clear your Firefox cache, do the following: Go to Tools Clear Private Data Select which data you would like to have cleared, and click on Clear Private Data. Your cookies and/or cache has been cleared. Remember to do this from time to time, because it will help speed up your browser's performance as well as keep harmful cookies from tracking your browsing.
This video describes how to edit and delete data in PHP and MYSQL. The video is about twenty minutes long and is perfect for anyone learning how to manage databases and websites with PHP or MYSQL. This video is part of a series on learning PHP and MYSQL. However, this video is not intended for anyone who is technically challenged or not a coder and should only be watched after having a good grasp on PHP syntax.
Want to get more from the raw data you're entering into your Excel worksheets? Now you can create two distinct pivot tables in Excel comparing, for example, monthly and quarterly sales data. Not familiar with the pivot table? Pivot tables summarize spreadsheet input by counting, sorting and totaling data within a list and providing at-a-glance computations within the same sheet. Become an expert on the subject within 5 minutes and 24 seconds by following easy to understand instructions narrat...
MotionTraining gives an overview for using Microsoft Excel for beginners in this video. This video gives a rundown and overview of the basics of this spreadsheet program: from typing in the columns and rows, adding dollar signs to data, and how to make basic calculations. MotionTraining will show how to make text stand out with bold and italics, adding colors to your data, and how to make a grid appear during the printing process. Creating various charts of the data in the spreadsheet is also...
Microsoft Office Excel 2007 spreadsheet manager is a powerful tool that enables information workers to format spreadsheets, as well as analyze and share information to make more informed decisions. In this MS Excel video tutorial, you'll learn about using a pivot table to summarize data.
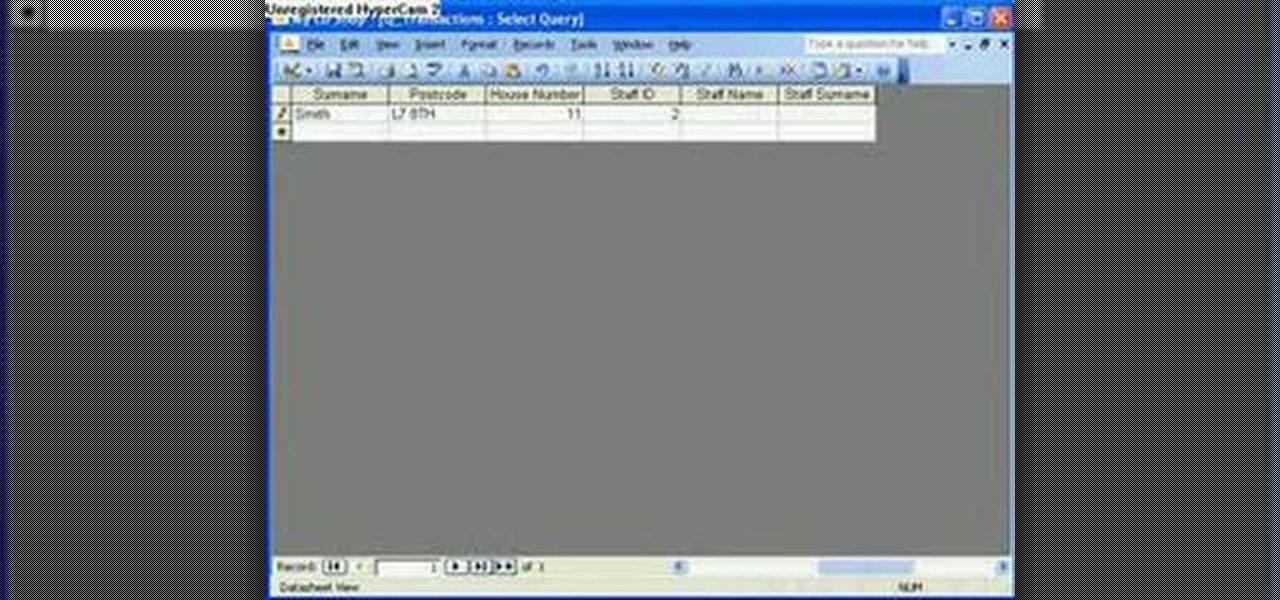
The Microsoft Office Access 2007 relational database manager enables information workers to quickly track and report information with ease thanks to its interactive design capabilities that do not require deep database knowledge. In this Microsoft Access video tutorial, you'll learn about using relationships and queries to pull data from tables. For more information, watch this Microsoft Office Access how-to.
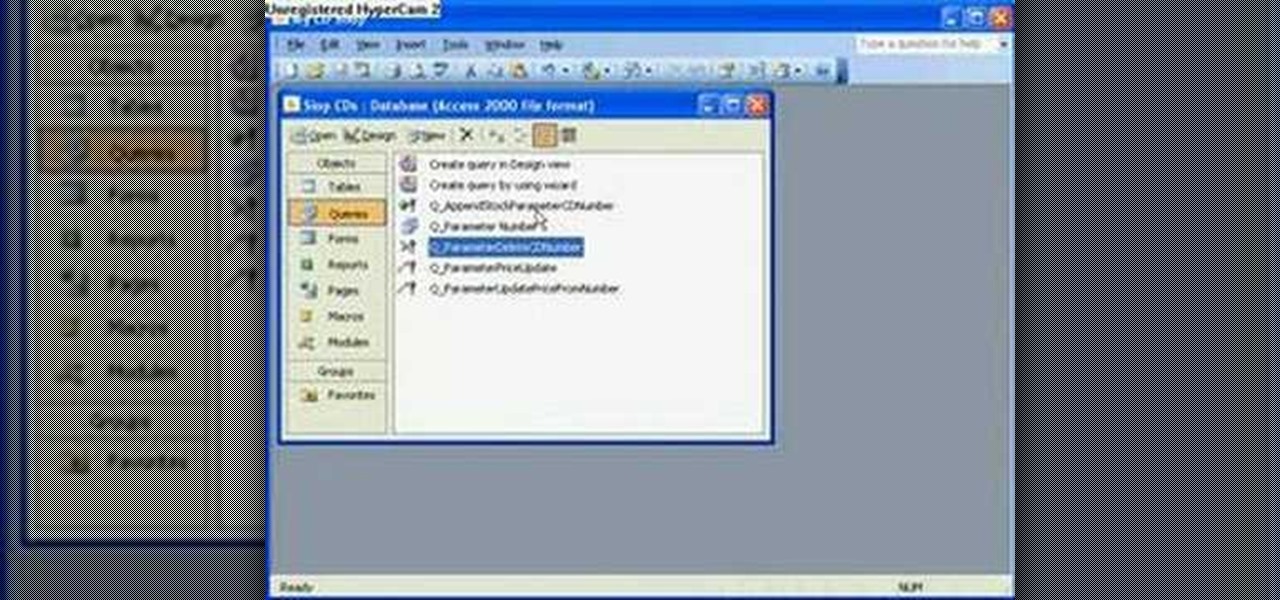
The Microsoft Office Access 2007 relational database manager enables information workers to quickly track and report information with ease thanks to its interactive design capabilities that do not require deep database knowledge. In this Microsoft Access video tutorial, you'll learn about using an append and delete query sequentially using a macro. For more on archiving data in Microsoft office, take a look.
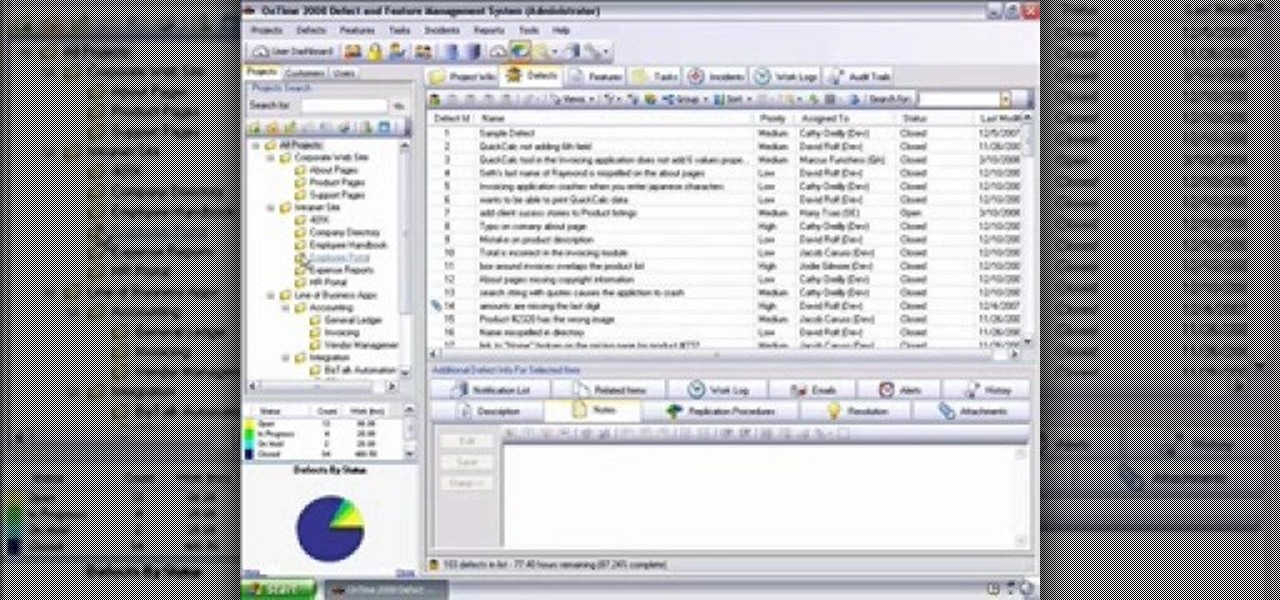
Need some help getting started running reports? This installment from Axosoft's own series of video tutorials on the OnTime Project Management Suite covers the basics of running reports and sending data to those reports. Did you know there are four ways you can manipulate what data is sent to a report without any direct report customization? Take a look!
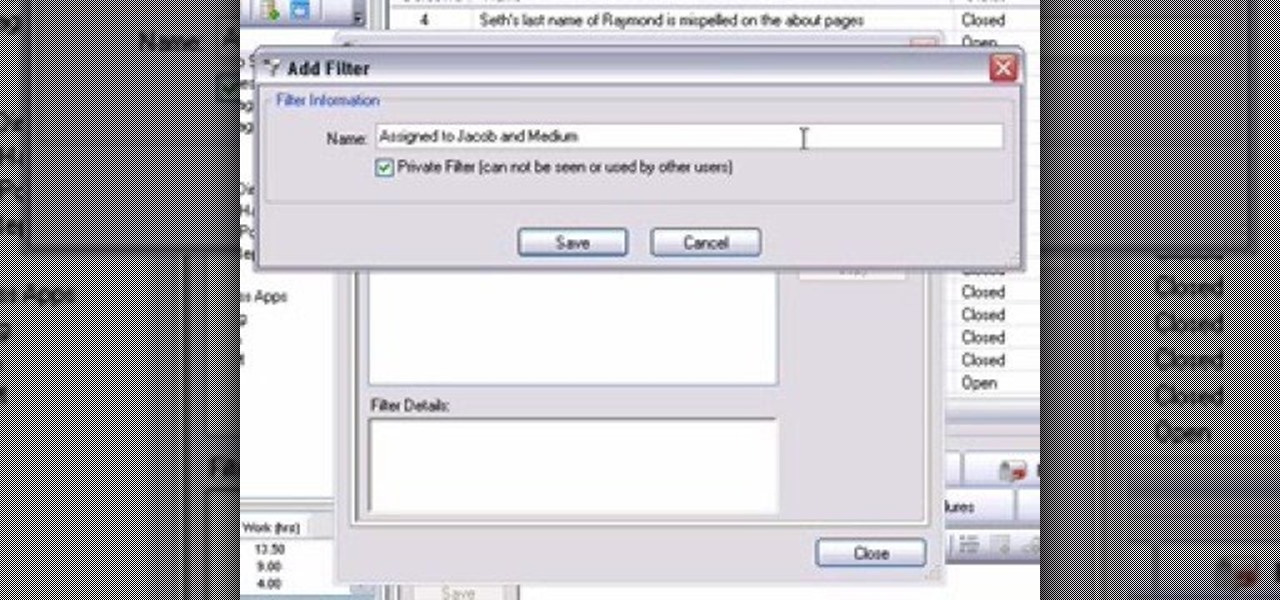
Filters are a powerful mechanism in OnTime used for searches and other forms of data manipulations. In this installment from Axosoft's own series of OnTime Project Management Suite video tutorials, you'll focus on the simplest application of filters: searching data in your main grid in OnTime 2008.
Microsoft ASP.NET is a free technology that allows programmers to create dynamic web applications. ASP.NET can be used to create anything from small, personal websites through to large, enterprise-class web applications. All you need to get started with ASP.NET is the free .NET Framework and the free Visual Web Developer. In this introductory video, Alex James will show you how to build a simple Entity Data Model in a short amount of time.
Microsoft ASP.NET is a free technology that allows programmers to create dynamic web applications. ASP.NET can be used to create anything from small, personal websites through to large, enterprise-class web applications. All you need to get started with ASP.NET is the free .NET Framework and the free Visual Web Developer. In this introductory video Diego Vega will show you how to use the Entity Data Source in an ASP.NET Application.
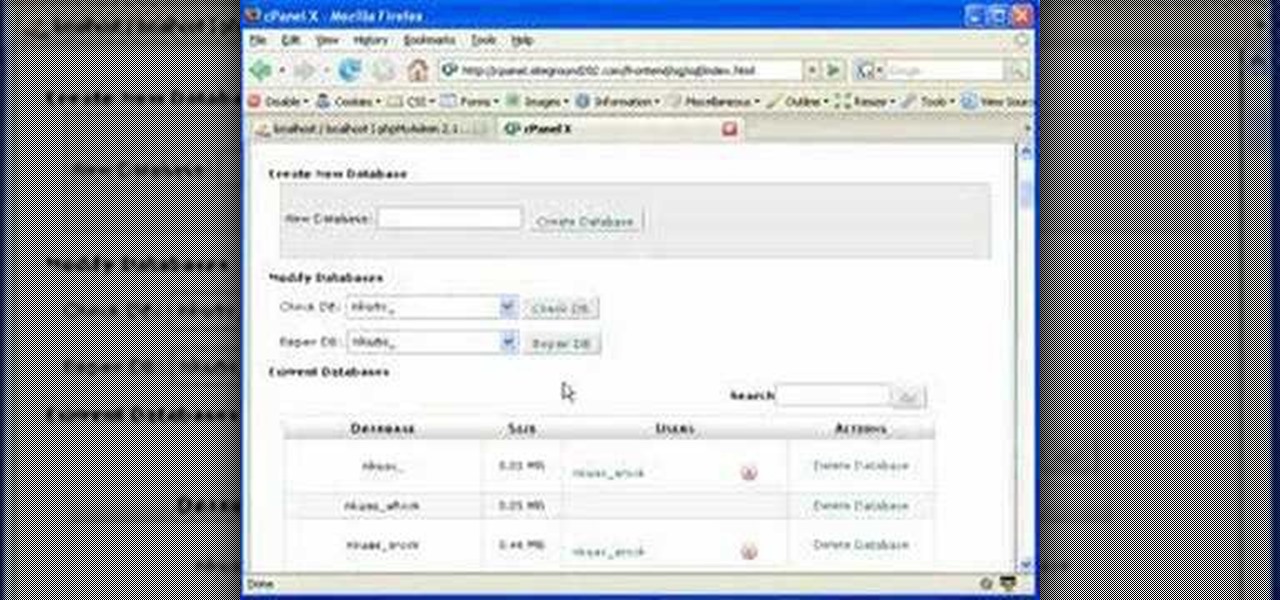
This data management tutorial shows you how to take a Microsoft Excel Spreadsheet and import it into a MySQL Database using CSV files and PHPMyAdmin in cPanel. Being able to move data from Excel to MySQL is an important part of database content management, so if you use cPanel to manage your databases, you'll want to watch and learn how to import Excel spreadsheets into your MysQL databases.
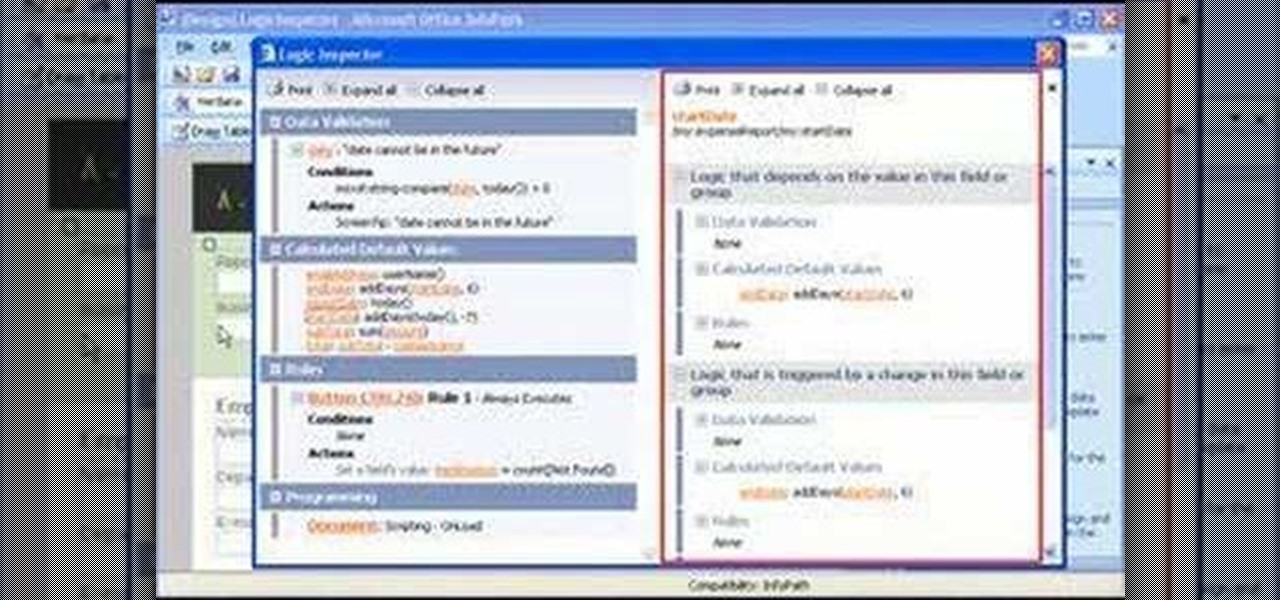
You don't have to check the settings for every control individually — you can use the Logic Inspector to see a form's business logic displayed in a single window, grouped by features such as data validation, calculated data values, rules, and programming. Take a look at this instructional video and learn how to view the logic in a form template with Microsoft InfoPath.
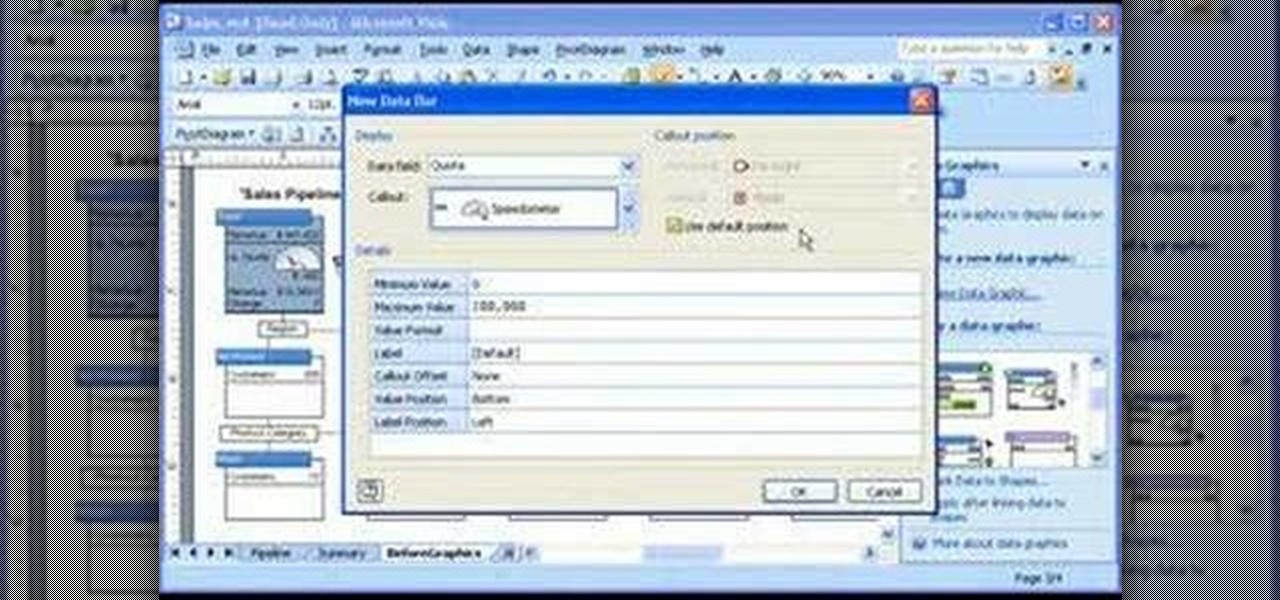
Take a look at this instructional video and learn how to customize progress meters, icons, color coding, and other graphical elements to emphasize sales trends, product performance, critical deadlines, or whatever information is contained in the data behind your diagram.
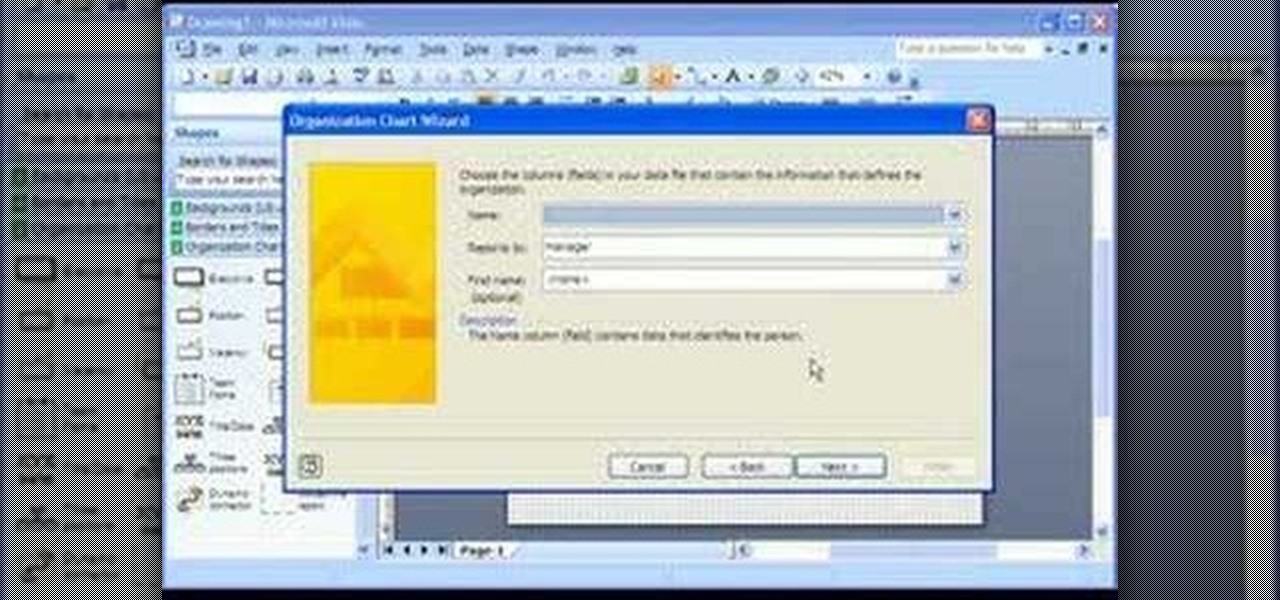
Take a look at this instructional video and learn how to use a Microsoft Office Excel worksheet that contains employee data to create shapes, connect them according to your organization's structure, and add data to each shape in your drawing automatically.
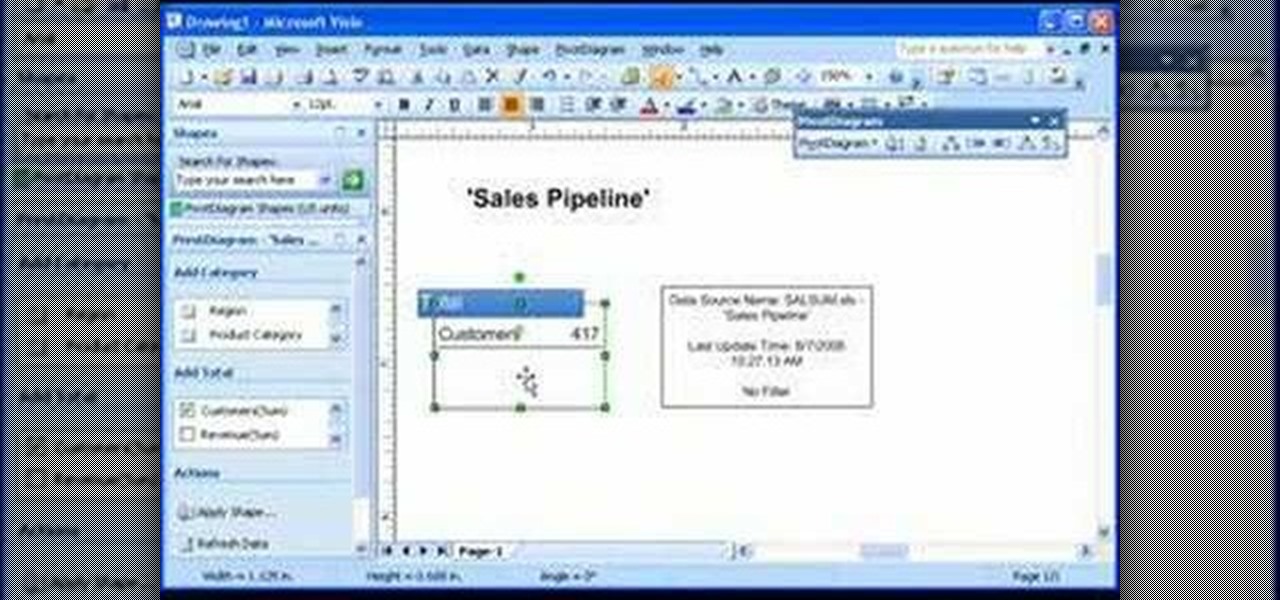
A PivotDiagram is similar to an Excel PivotTable report: It arranges data in a visual way. Check out this tutorial and learn how to look at the same data from different angles to establish and analyze relationships that you might miss in a table or a worksheet.
In this video tutorial, Scott Golightly shows how to implement a simple HttpModule that uses the BeginRequest and EndRequest events to store some data about the request and later display that data to the user. Scott also shows how to register the module in the Web.config file.
In this video tutorial, Chris Pels will show how to share data in between JavaScript and server-side code by using a hidden field in an ASP.NET page. Next, learn how to use the RegisterHiddenField method in server-side code to programmatically create a hidden field on the client. In addition, see how to programmatically create a HiddenField server control for sharing data on an ASP.NET page. Finally, use the RegisterArrayDeclaration method to create a container in server code for storing mult...