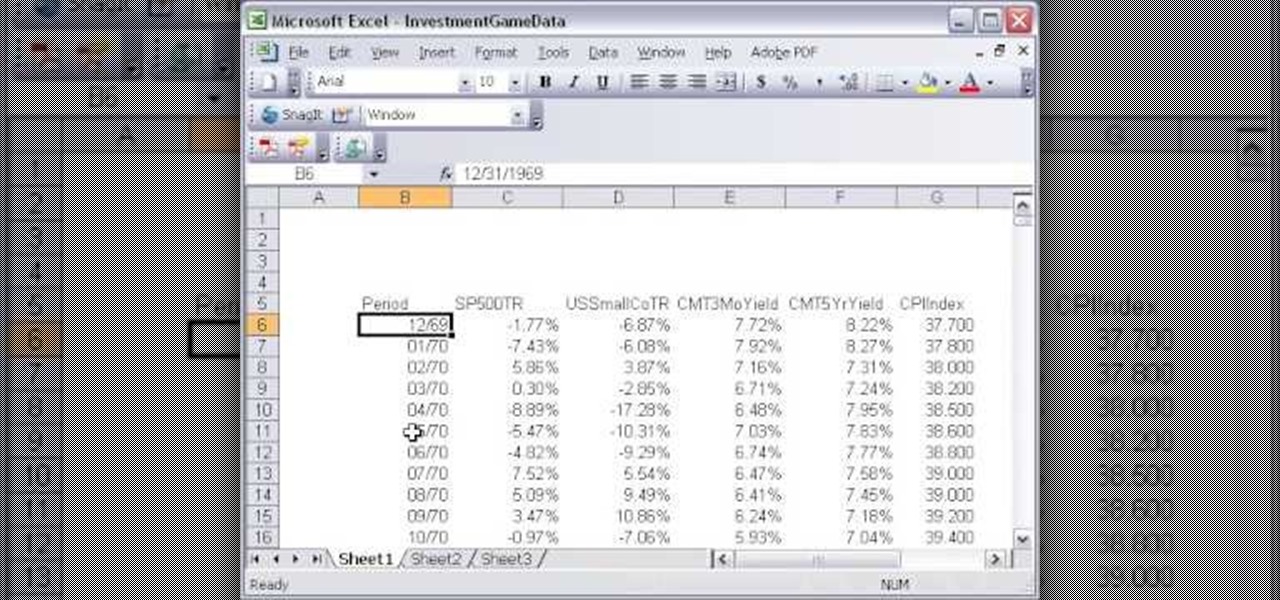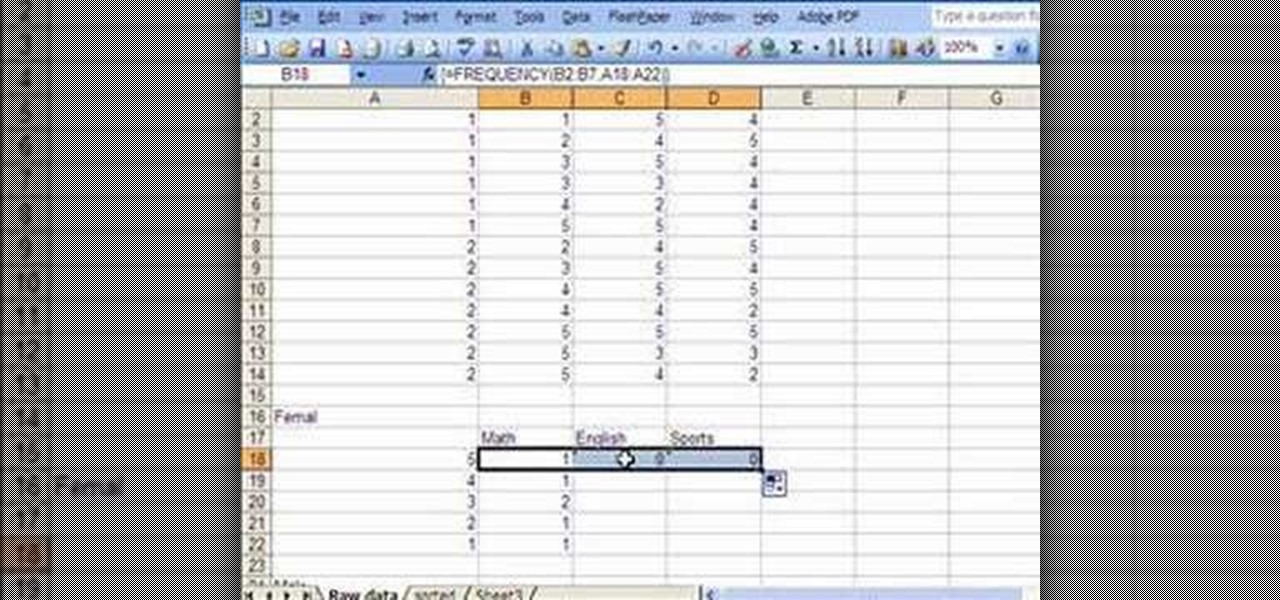
This video introduces how to use Excel to sort data, perform the Frequency function, and present data in line chart. See how to apply condition formatting when working in Microsoft Excel 2007. Whether you're new to Microsoft's popular word processing application application or a seasoned MS Office professional just looking to better acquaint yourself with the Word 2007 workflow, you're sure to be well served by this video tutorial. For more information, and to get started creating your own li...
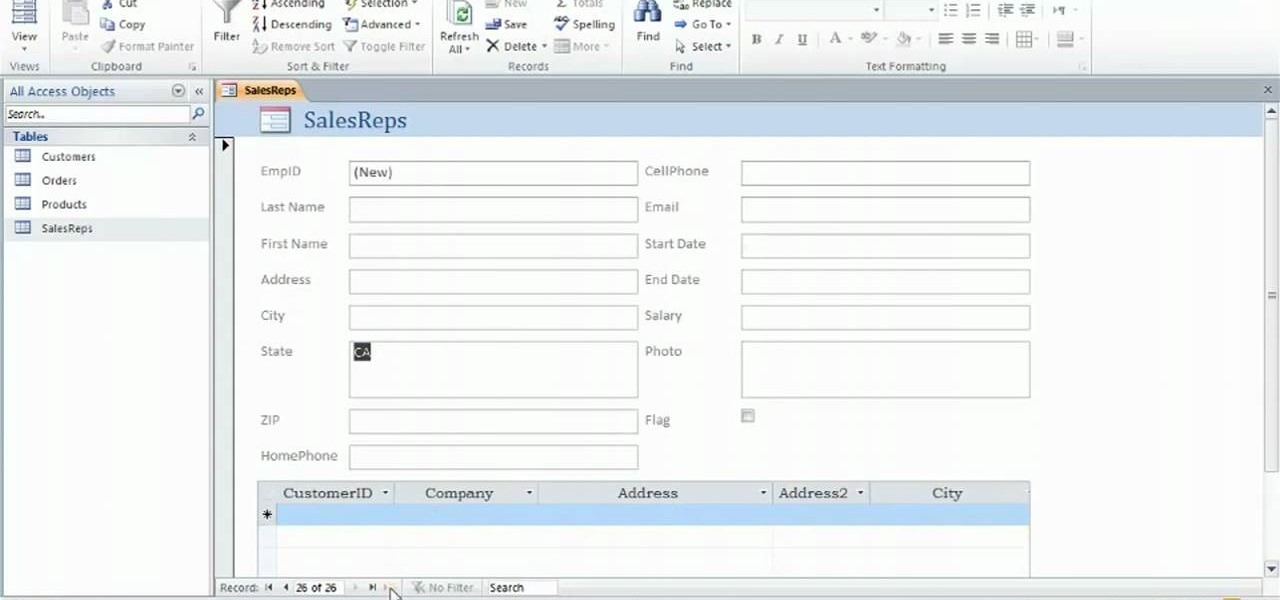
Learn how to create data-entry forms when working in Microsoft Access 2010. Whether you're new to Microsoft's popular database management application or a seasoned MS Office professional just looking to better acquaint yourself with the Access 2010 workflow, you're sure to be well served by this video tutorial. For more information, and to get started using data-entry forms in your own Access projects, watch this free video guide.
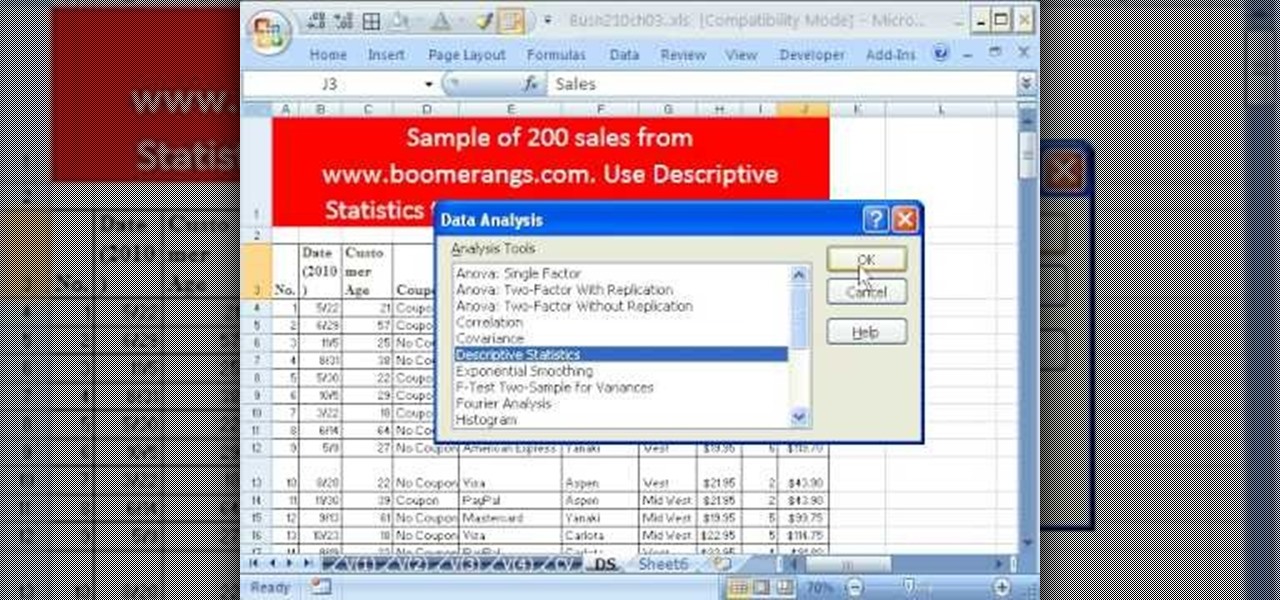
If you use Microsoft Excel on a regular basis, odds are you work with numbers. Put those numbers to work. Statistical analysis allows you to find patterns, trends and probabilities within your data. In this MS Excel tutorial from everyone's favorite Excel guru, YouTube's ExcelsFun, the 43rd installment in his "Excel Statistics" series of free video lessons, you'll learn how to use the Excel Data Analysis add-in descriptive statistics tool.
If you use Microsoft Excel on a regular basis, odds are you work with numbers. Put those numbers to work. Statistical analysis allows you to find patterns, trends and probabilities within your data. In this MS Excel tutorial from everyone's favorite Excel guru, YouTube's ExcelsFun, the 29th installment in his "Excel Statistics" series of free video lessons, you'll learn how to create quantitative data cross tabulation using a pivot table (PivotTable).
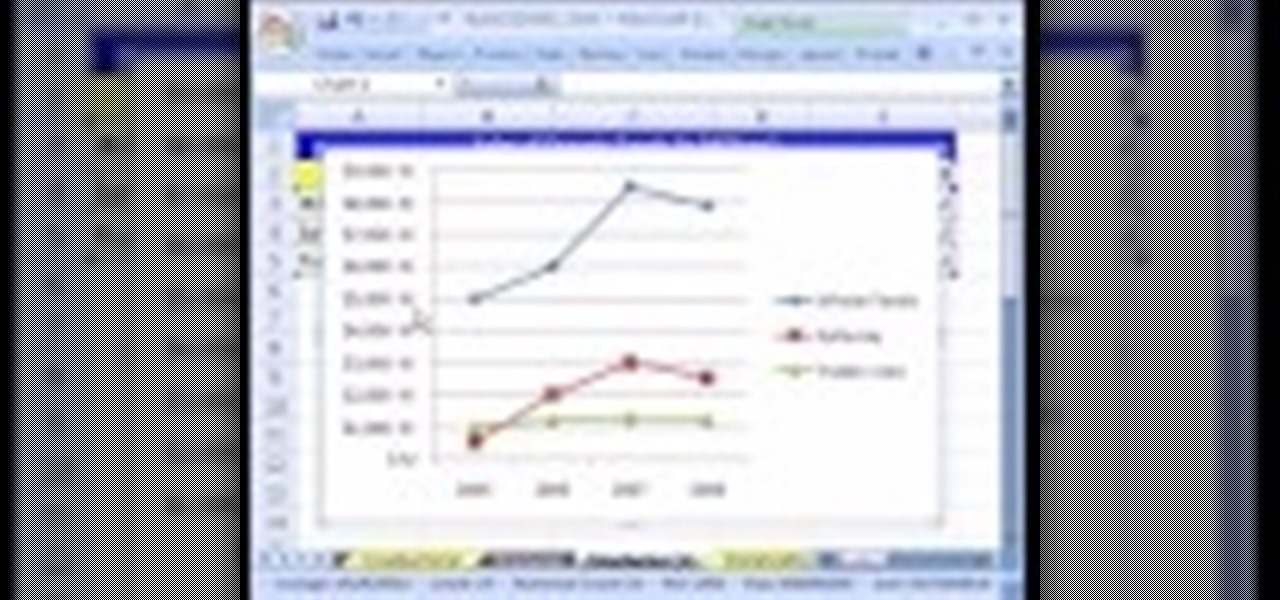
If you use Microsoft Excel on a regular basis, odds are you work with numbers. Put those numbers to work. Statistical analysis allows you to find patterns, trends and probabilities within your data. In this MS Excel tutorial from everyone's favorite Excel guru, YouTube's ExcelsFun, the 11th installment in his "Excel Statistics" series of free video lessons, you'll learn how to work with, and create charts for, cross-sectional and time-series data.
If you use Microsoft Excel on a regular basis, odds are you work with numbers. Put those numbers to work. Statistical analysis allows you to find patterns, trends and probabilities within your data. In this MS Excel tutorial from everyone's favorite Excel guru, YouTube's ExcelsFun, the 13th installment in his "Excel Statistics" series of free video lessons, you'll learn how to install the Excel 2007 Data Analysis add-in.

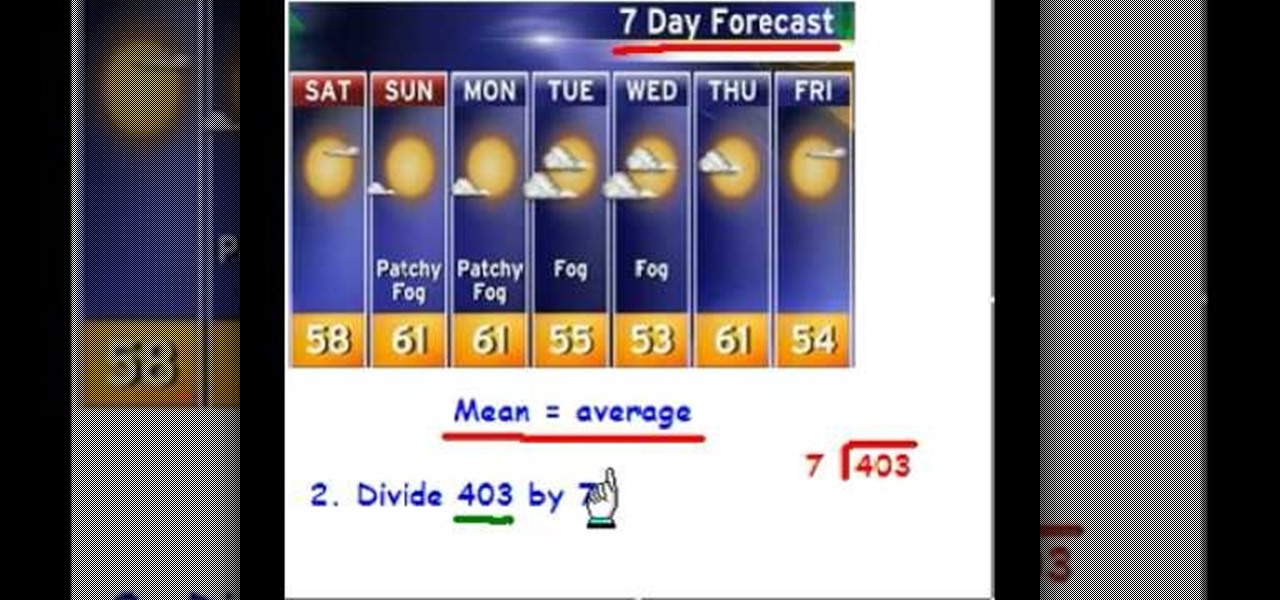
"Mean" is really the average on a set of numbers. The video uses the temperatures on a weather report as an example of a data set. Start by adding the temperature numbers of the week up. After you have the total, divide that number by 7, because you used 7 numbers in your data set. The answer that you get after dividing will have a few decimal places at the end of it. You can round the answer to the nearest whole number because all the numbers from your original data set do not have any decim...

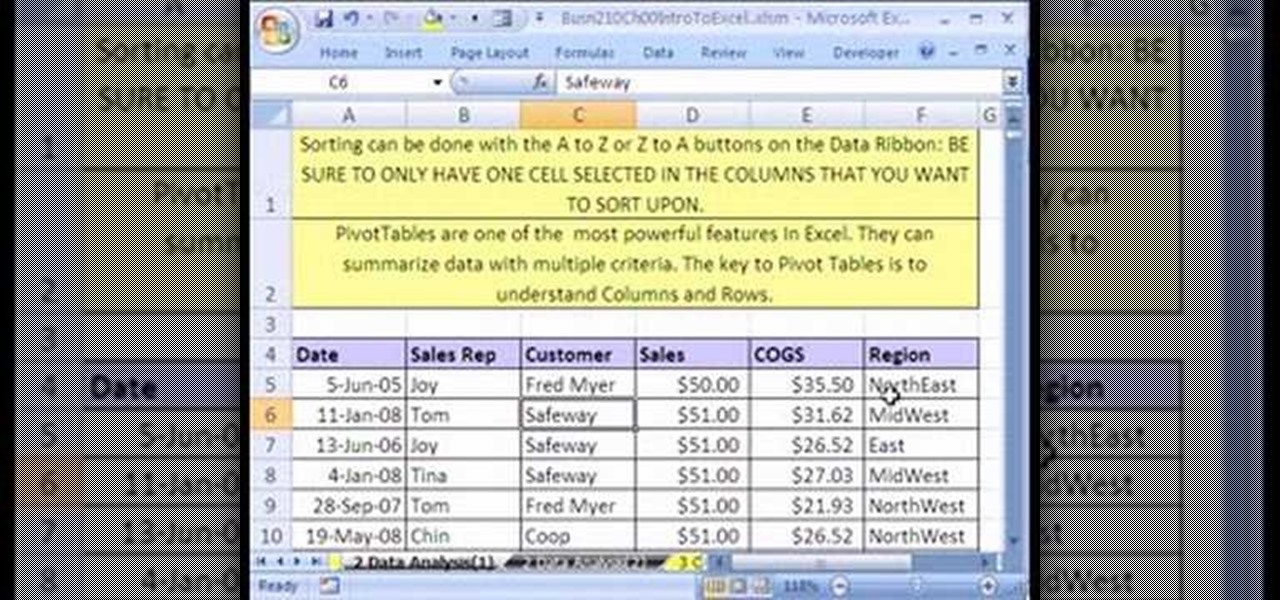
To sort data in Excel spreadsheets, have each category (for example, first and last names) in a single column. Click on any cell in the column you wish to sort. Be careful not to highlight the entire column, or results will be sorted only in that column. Click on DATA on the ribbon at the top. To sort in descending order, click on the z-a button. For more detail, click on the main SORT button, and you can specify which columns you want sorted and how. For instance, you can sort by descending ...

ShowMeAcademy.com shows how to sort data in Excel 2007. Excel has many options for sorting data according to any given column. To sort your data, right click on a cell in the column that you want to sort by. A menu comes up where you will see the “Sort” option. Hold your mouse over “Sort” and another menu comes up showing the different ways to sort. For example, if you select “Sort Smallest to Largest” it will take all the data and sort it from the row that has the lowest figure u...

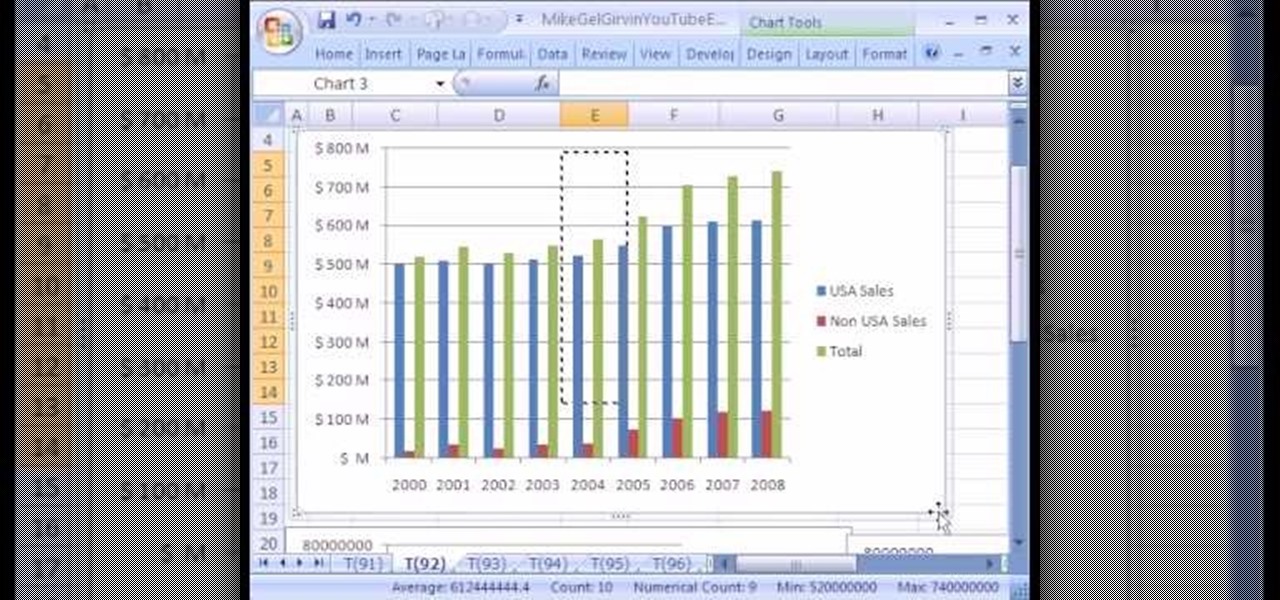
New to Microsoft Excel? Looking for a tip? How about a tip so mind-blowingly useful as to qualify as a magic trick? You're in luck. In this MS Excel tutorial from ExcelIsFun, the 92nd installment in their series of digital spreadsheet magic tricks, you'll learn how to add data series to a chart, change the chart type for just one data series and see an excellent copy data to chart trick.

New to Microsoft Excel? Looking for a tip? How about a tip so mind-blowingly useful as to qualify as a magic trick? You're in luck. In this Excel tutorial from ExcelIsFun, the 574th installment in their series of digital spreadsheet magic tricks, you'll learn how to import data from Microsoft Access as well as how to use the VLOOKUP function to populate data into a printable form.

Some data can be very confidential. In such case you need to encrypt the data so that it does not go into the wrong hands. There are lots of encryption software available to encrypt the data. But to use them first you need to install then and this can take lot of time. You can also use Windows built in compression client to encrypt information. To use this feature you need not install any software and it is a fairly simple process. So select a file that you want to encrypt, right click on it ...

In this video Jesse Liberty dives deeper into data-binding, demonstrating in detail how to create business classes that represent data retrieved from a web service, and how to bind them to various controls using a combination of Blend and Visual Studio. This is a detailed, easy to follow video, to help you use the program, and all it entails.

A major plus in using Microsoft Excel is its ability to sort large amounts of data. What's the use of Excel, if you don't know how to sort? In this short video clip, learn how to go about sort your data in the order needed.

This video shows you how to easily copy data to and from your Motorola Droid. The first step is to connect your Motorola Droid to PC, using the data cable. Now, simply drag down the bar in the upper side of the screen and select USB Connected. Then, click on Mount in the popped up window. This will allow your PC to see the SD Card in your Motorola Droid and browse through it. Now, open My Computer, in your PC and open the Removable Disk that appeared. Easily click and drag or copy-paste the f...

The Microsoft Office Access 2007 relational database manager enables information workers to quickly track and report information with ease thanks to its interactive design capabilities that do not require deep database knowledge. In this Microsoft Access video tutorial, you'll learn about sorting data using queries. For detailed instructions, and to get started using queries to sort data for yourself, watch this how-to.

Here is a quick video on how to convert Excel spreadsheet data to XML for import into Flash or Flex. Don't spend time typing all that data again, instead create a schema in Excel and convert it to XML.

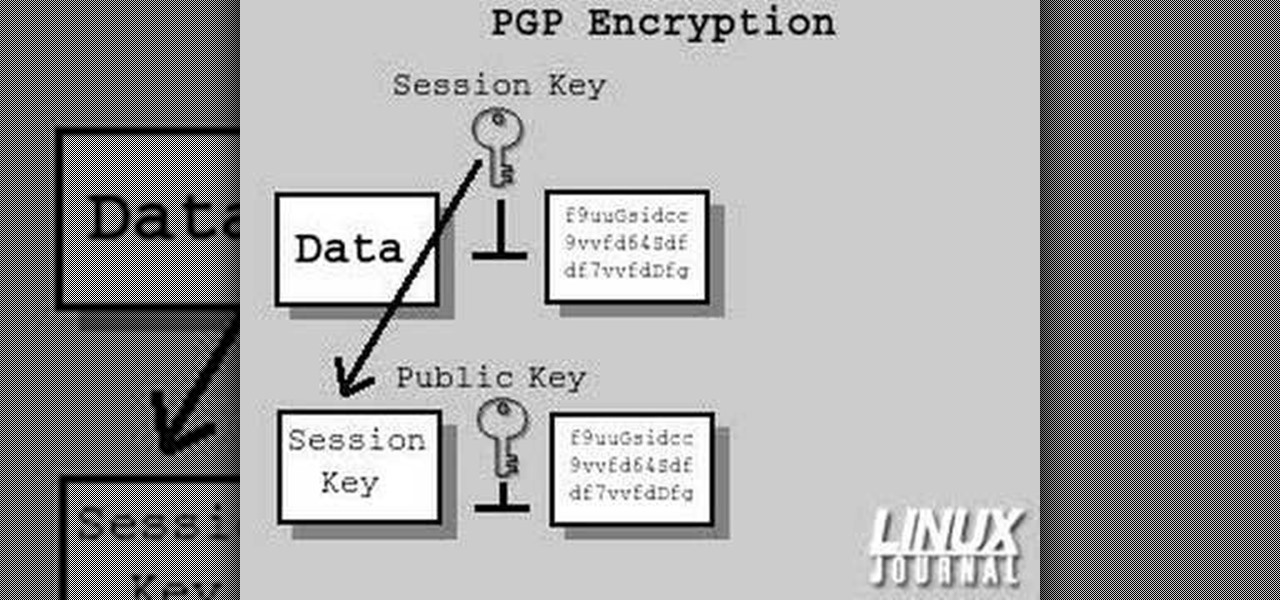
In today's time of rampant information crimes, including identity theft, security is more important to the average computer user than ever. This tutorial from Linux Journal Online shows how you can use GnuPG to secure and verify data on your Linux box. (This video was created using only free and open source software tools: TightVNC, pyvnc2swf, ardour2, audacity, jackd, LAME, kolourpaint, cinelerra-cv, mjpegtools, and ffmpeg.)

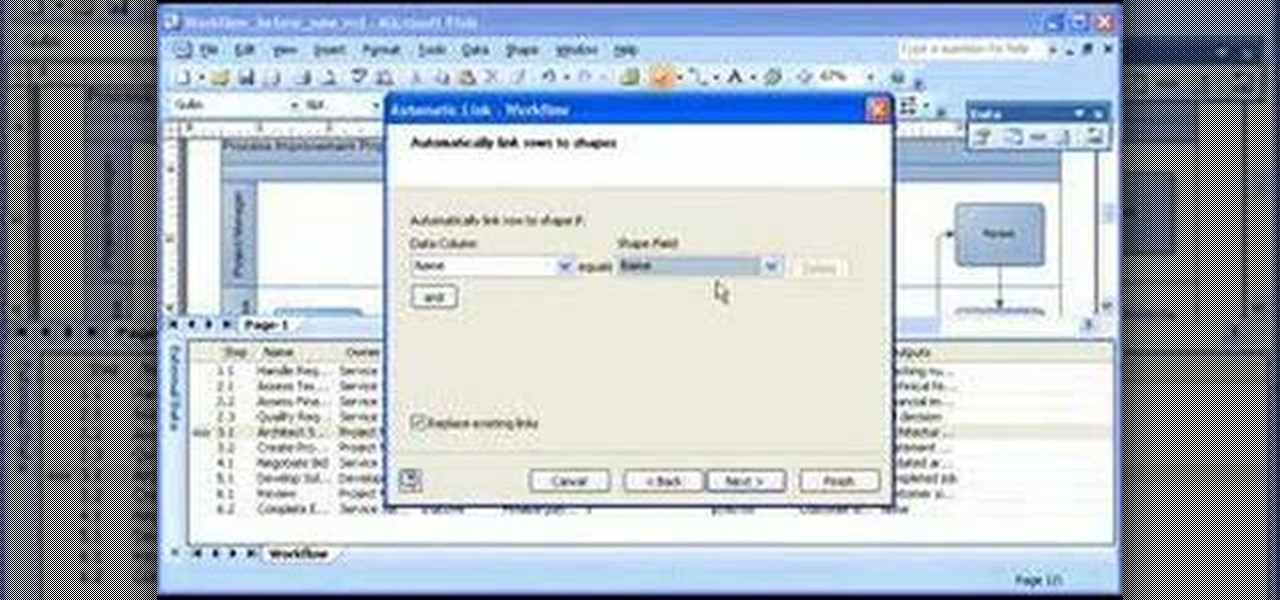
Take a look at this instructional video and learn how to analyze how a process or other area is actually performing by connecting data to the shapes in your diagram with Microsoft Visio 2007. You can also add different visual effects based on the data values. For example, you can link sales data from an Excel workbook to the shapes it relates to. When a phase of the sales process takes longer than guidelines recommend, the shape for that phase changes color or shows an icon that alerts you to...

In this helpful electronics tutorial video, you can learn how to erase data and information from your Apple iPhone. This how-to video makes erasing data from your iPhone easy and is especially helpful for new iPhone owners.

In this video tutorial, Chris Pels will show how to group items when displaying data in a ListView control. First, see the basics of item layout in the ListView control with the LayoutTemplate and the ItemTemplate. Then, learn how the GroupTemplate relates to the LayoutTemplate and ItemTemplate within a ListView to establish a group of data. See how to use floating DIV elements to create a flexible tabular layout since any of the templates used with the ListView can contain any HTML. This pro...

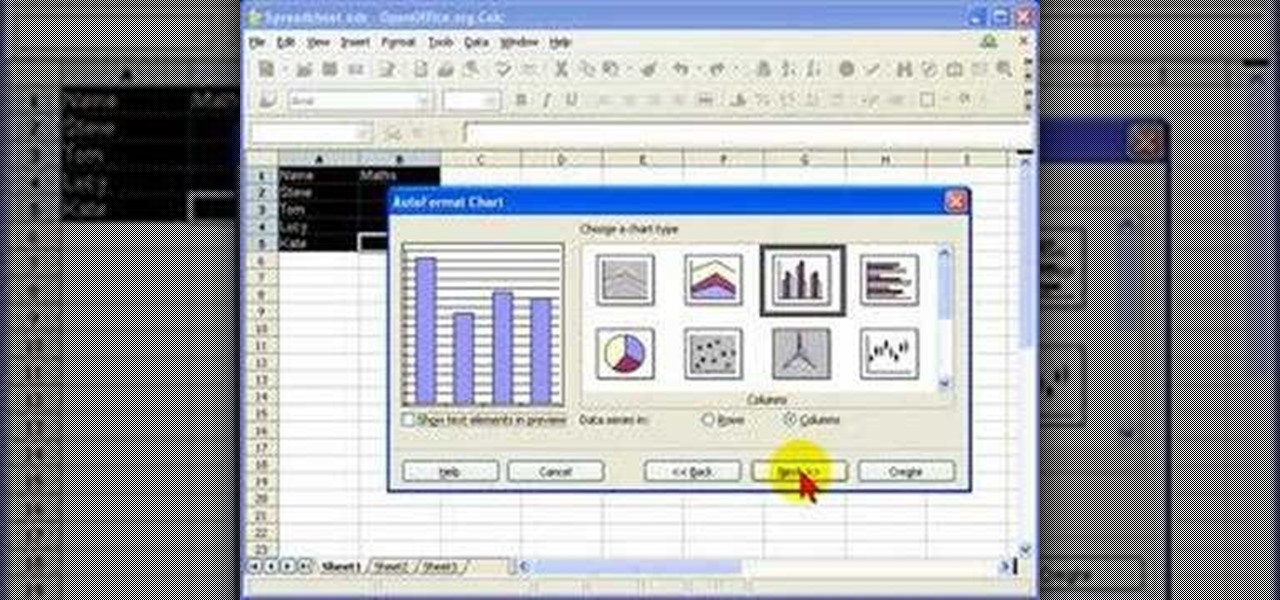
In this screencast tutorial, Steve shows you how to quickly and simply create a bar chart, from the data you have entered into your worksheet in Open Office Calc. If you're looking for a simple and clear way to represent your statistical data, then a simple bar chart is an option you should look at using. So check out this tutorial and start making OpenOffice Calc bar charts today.

Learn how to Import External Data (i.e data from web pages) dynamically into Excel in Microsoft's Office 2007.

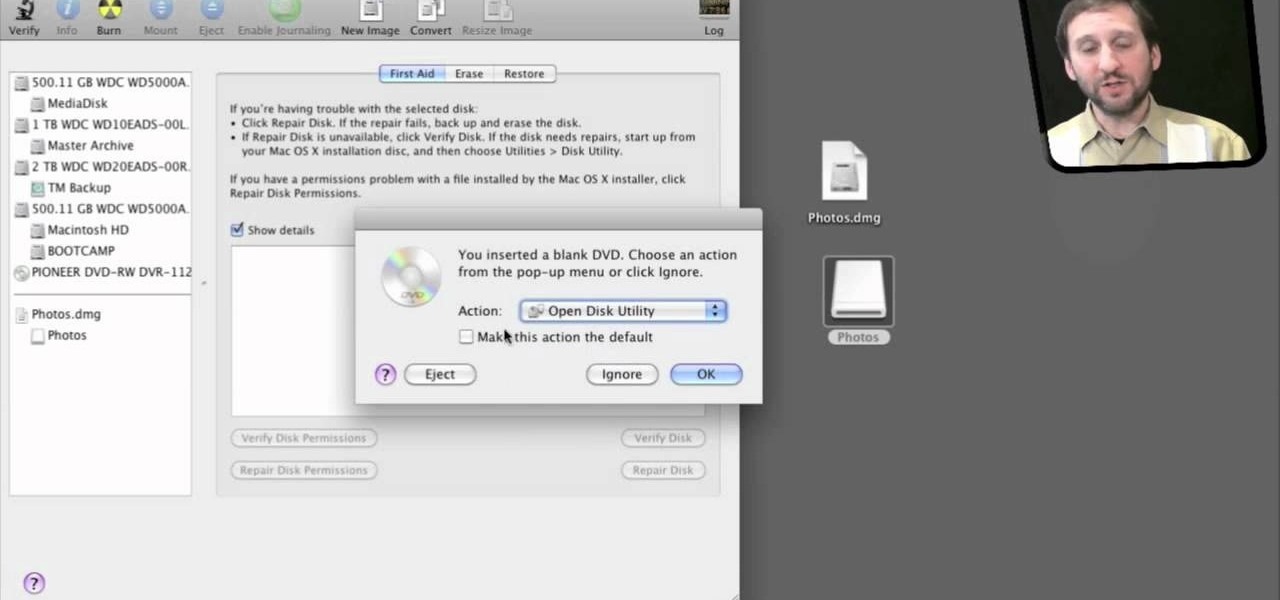
Here's something everyone needs to know: how to copy a data disk (CD, DVD) using disk utility on OS X when you only have one optical drive. You will need to create a temporary disk image on your hard drive. Then use that disk image to create physical copies of your disc.

Back up your computer data and save your time, money and valuable information using these helpful tips. There are several options to backing up and storing your important data, ranging from tiny keychain USB drives to backing up your files online. This informative and lighthearted video from Kipkay shows you how.

If you want to import data or recover files from your AppleTV back to iTunes on your computer, this shows you how. First you are shown how to gently take apart your Apple TV to access the hard drive, then hook it up to a Macintosh, and you can access your files and data structure from there!

Want to know how to use Google Data? This clip will show you how it's done. It's easy! So easy, in fact, that this handy home-computing how-to from the folks at Tekzilla can present a complete overview of the process in about two minutes' time. For more information, including detailed, step-by-step instructions, take a look.

Looking for a guide on how to enter data into nonadjacent cells in MS Excel 2010? This clip will show you how it's done. Whether you're new to Microsoft's popular digital spreadsheet application or a seasoned professional looking to become better acquainted with the features and functions of Excel 2010, you're sure to benefit from this free video software lesson. Take a look.

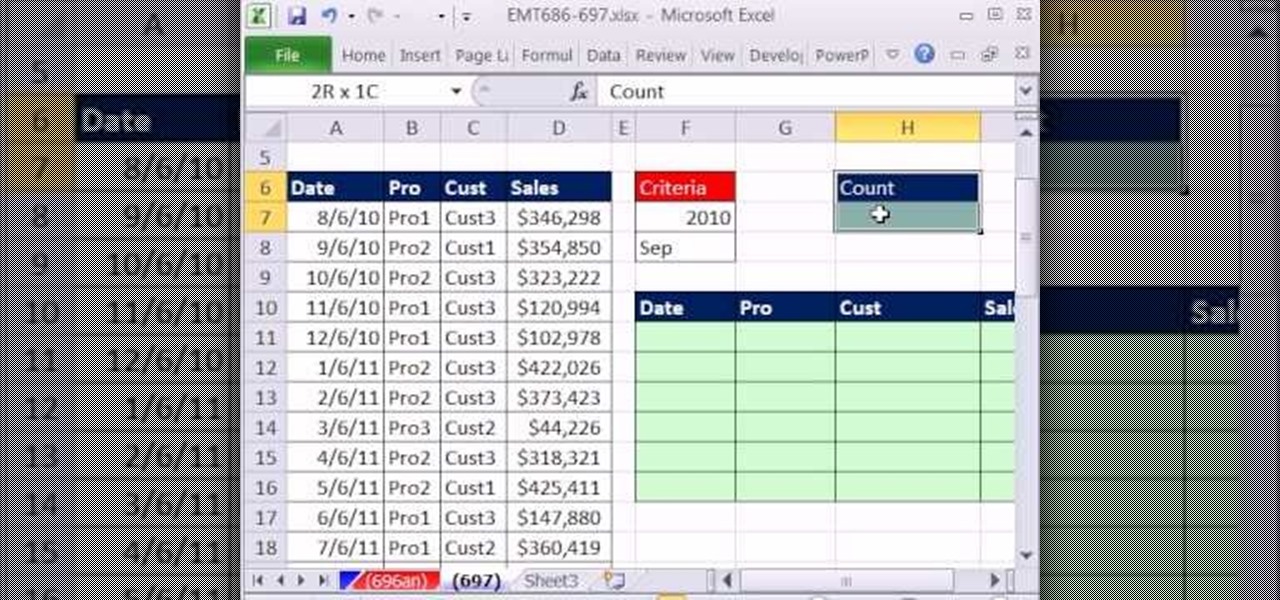
New to Microsoft Excel? Looking for a tip? How about a tip so mind-blowingly useful as to qualify as a magic trick? You're in luck. In this MS Excel tutorial from ExcelIsFun, the 697th installment in their series of digital spreadsheet magic tricks, you'll learn how to extract month and year data from transactional records by filtering, array formula and non-array formula.

This is a basic lesson with an intro for arrays in the C# programming language. You'll learn how to create and declare and add date to a C# array. An array is a data structure, or object, that contains several variables of the same type. Learn all about it!

New to Microsoft Excel? Looking for a tip? How about a tip so mind-blowingly useful as to qualify as a magic trick? You're in luck. In this MS Excel tutorial from ExcelIsFun, the 675th installment in their series of digital spreadsheet magic tricks, you'll learn how to do data validation using a custom logical formula with 2 VLOOKUP functions that will change when different products are entered. For example, if shirt product is entered, the data validation will let only values between $50 and...

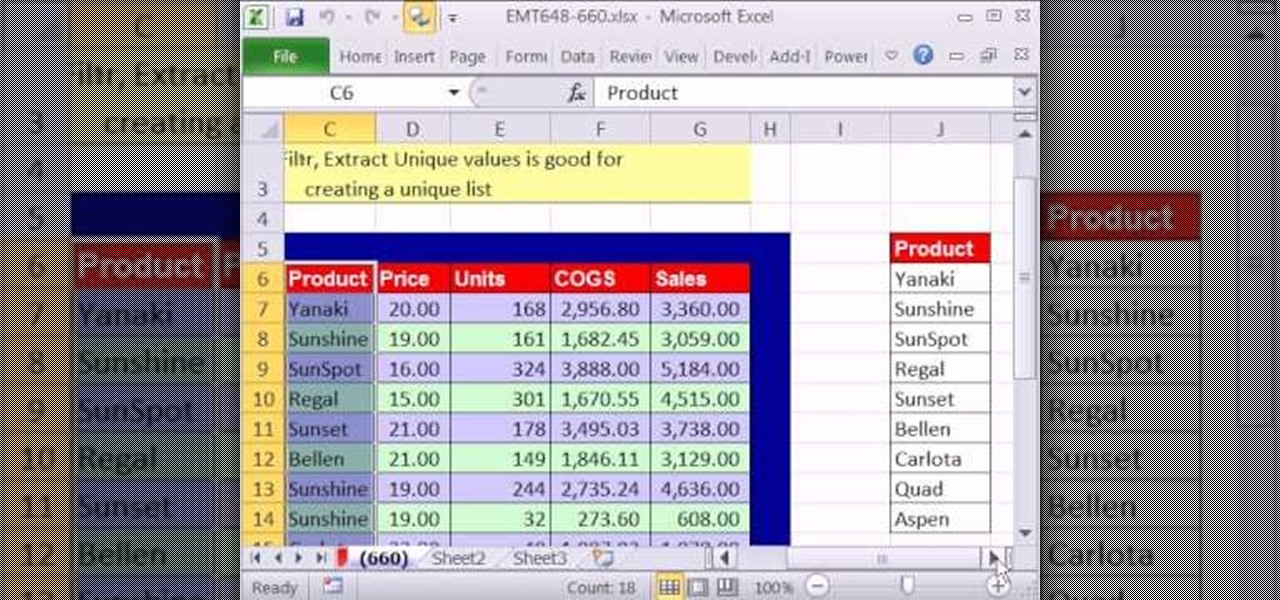
New to Microsoft Excel? Looking for a tip? How about a tip so mind-blowingly useful as to qualify as a magic trick? You're in luck. In this MS Excel tutorial from ExcelIsFun, the 660th installment in their series of digital spreadsheet magic tricks, you'll learn how to extract a unique list from a data set using Advanced Filter.

New to Microsoft Excel? Looking for a tip? How about a tip so mind-blowingly useful as to qualify as a magic trick? You're in luck. In this MS Excel tutorial from ExcelIsFun, the 648th installment in their series of digital spreadsheet magic tricks, you'll learn see the functions ROWS, COLUMNS, and CHAR in a formula that will create a data set.

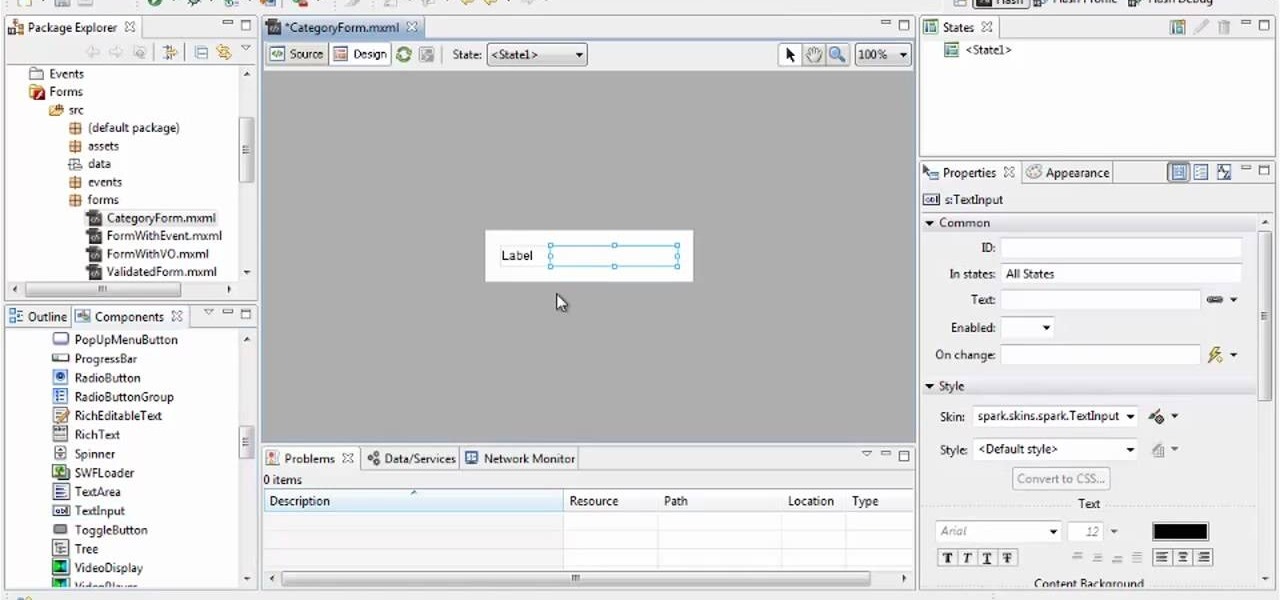
Need a little bit of help figuring out how to build custom data entry form components in Flash Builder 4? This clip will show you what to do. Whether you're new to Adobe's popular Flash IDE (previously titled Adobe Flex Builder) or simply wish to become better acquainted with the program, you're sure to find benefit in this free video software tutorial. For more information, including specific, step-by-step instructions, take a look.

Learn how to quickly import data into Microsoft OneNote 2010 with the Quick Filing tool. Whether you're new to Microsoft's popular note-taking application or a seasoned MS Office professional just looking to better acquaint yourself with the OneNote 2010 workflow, you're sure to be well served by this video tutorial. For more information, and to get started quickly importing data into your own OneNote projects, watch this free video guide.

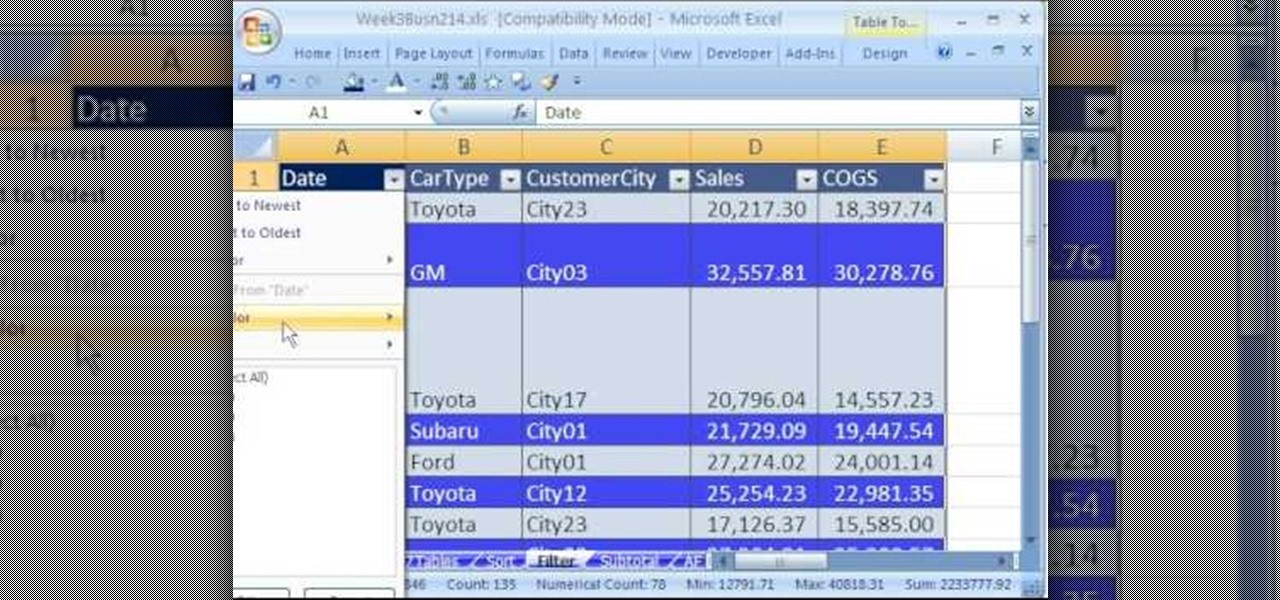
hether you're interested in learning Microsoft Excel from the bottom up or just looking to pick up a few tips and tricks, you've come to the right place. In this tutorial from everyone's favorite digital spreadsheet guru, ExcelIsFun, the 17th installment in his "Highline Excel Class" series of free video Excel lessons, you'll learn how to filter spreadsheet data using eight different methods.

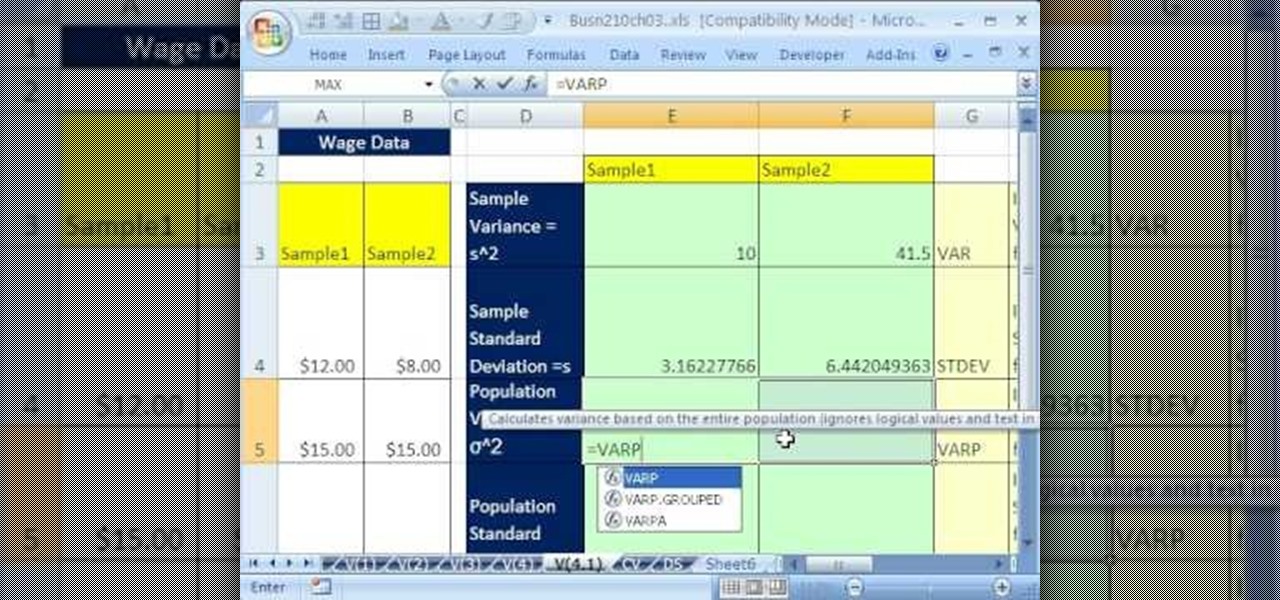
If you use Microsoft Excel on a regular basis, odds are you work with numbers. Put those numbers to work. Statistical analysis allows you to find patterns, trends and probabilities within your data. In this MS Excel tutorial from everyone's favorite Excel guru, YouTube's ExcelsFun, the 41st installment in his "Excel Statistics" series of free video lessons, you'll learn how to calculate deviations, variance and standard deviation for a sample and a population using Excel tables and the VAR, S...

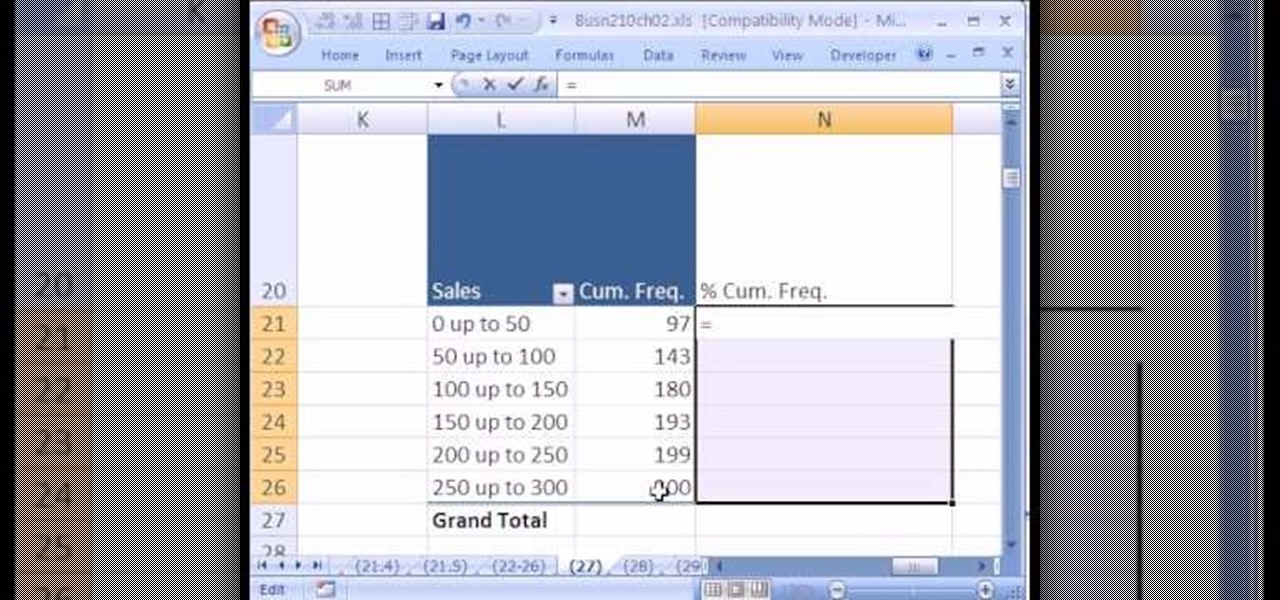
If you use Microsoft Excel on a regular basis, odds are you work with numbers. Put those numbers to work. Statistical analysis allows you to find patterns, trends and probabilities within your data. In this MS Excel tutorial from everyone's favorite Excel guru, YouTube's ExcelsFun, the 26th installment in his "Excel Statistics" series of free video lessons, you'll learn how to create quantitative data cumulative frequency distributions with pivot tables.

If you use Microsoft Excel on a regular basis, odds are you work with numbers. Put those numbers to work. Statistical analysis allows you to find patterns, trends and probabilities within your data. In this MS Excel tutorial from everyone's favorite Excel guru, YouTube's ExcelsFun, the 3rd installment in his "Excel Statistics" series of free video lessons, you'll learn how to use Excel's sorting and pivot tables (PivotTables) data analysis tools.

Love Microsoft Excel? This clip contains a tip that just might induce you to. With this free video tutorial from ExcelIsFun, the 74th installment of his "YouTubers Love Excel" or YTLE series of free video MS Excel lessons, you'll learn how to fix bad data with the CLEAN & TRIM functions.


