Well, everyone knows about palm-reading from the front. How about a switch then? In this video, you'll learn how to palm-read the back of the hand. Would that still count as "palm" reading? You'll actually be reading the fingers and knuckles of your hands. This can give you some great insights.
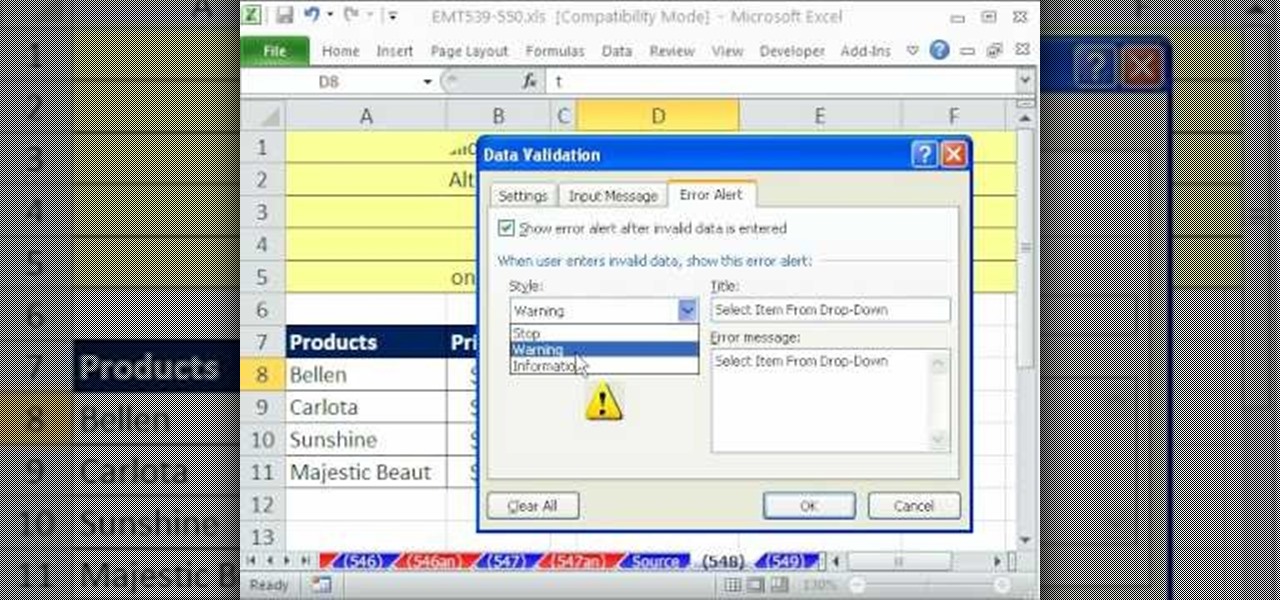
If you want to manage what sort of data is entered into your Excel spreadsheet, data validation will help you to accomplish just that. In this Excel tutorial from ExcelIsFun, the 549th installment in their series of Excel magic tricks, you'll learn how to use data validation to full effect in your Microsoft Office projects.
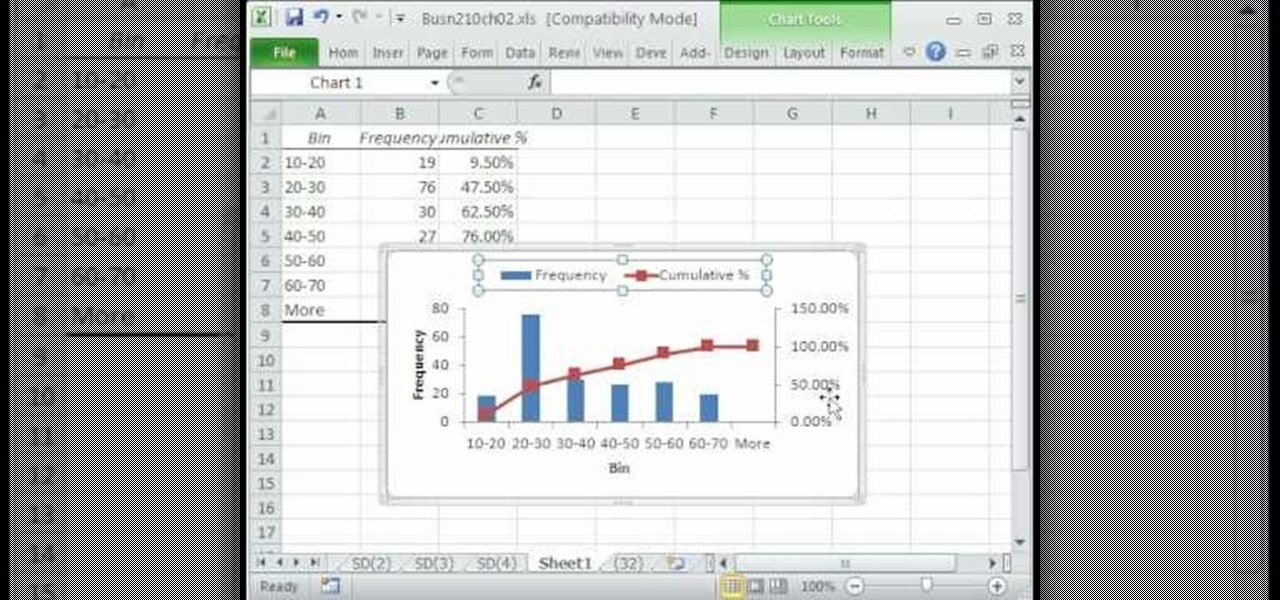
A histogram is a summary graph showing a count of data points that fall in various ranges. Histograms are used in statistics and other forms of mathematics. In this video, learn how to create your own histogram using data analysis on the computer. This tutorial will show you how to create a frequency distribution, a cumulative frequency distribution, a histogram chart and an ogive chart with the data analysis add-in.

When done properly, Ujjayi (translated as "victorious") breathing should be both energizing and relaxing. But it really is confusing at first. In this how to video, Garry Alesio shares some insight and tips into making this effective breathing exercise a natural stress-reducing solution. Watch this tutorial and you will be breathing your way to a less stressful life in no time.

Watch this instructional video in basic Buddhist Vipassana (Insight) Meditation. In this how-to video there is an explanation of the four foundations of mindfulness and a guided walking meditation based on creating a clear thought centred on the present reality. Learn all about how to practice walking meditation.
See how simple it is to create data-driven web sites using ASP.NET 2.0, Visual Web Developer 2005 Express Edition, and SQL Server 2005 Express Edition. Watch this video tutorial to learn how to create a database, add its data, and display that data on a web page.

Linguist Bud Brown shares some insights and advice about learning Vietnamese. This video talks about how to say the imperative (command) form.

Linguist Bud Brown share his insights on tag questions in Vietnamese. Bud first explains what are tag questions, then teaches how to form the tag question in Vietnamese. It's fun and easy, isn't it?

Linguist Bud Brown shares his insights into the Vietnamese language. This video talks about how to say "I'm glad to meet you" after being introduced and different ways to say "You're Welcome" after someone says "Thank you."

Linguist, Bud Brown shares his insights into the personal possessive forms "my" and "your". You gotta know these words and how to use them for everyday conversation for tagalog.

I travel to Sri Lanka and give a quick tour of a Sri Lankan spice garden to give viewers a better insight into where fresh ingredients come from. Then I make two dishes with guest chef Karuna - aubergine curry and Sri Lankan hoppers, which are like a cross between a crepe and a crumpet.

Looking to find the standard deviation of your set of values? Standard deviation quantifies how diverse the values of your data set are, and is useful in determining how different your numbers are from each other.

In Halo: Reach for the Xbox 360, there is so much to do! The campaign, the multiplayer, the achievements! But One tough one to get is all 19 hidden data pads. Luckily for you, the first nine can be acquired on any difficulty, and in this video you will learn the locations of all nine of the initial data pads on levels such as Winter Contingency and Pillar of Autumn!

We all have our reasons for erasing personal data from a phone. Whether you just ended a bad relationship whose face you never want to see again (lots of text messages) or just want to restore your privacy on the cell phone, erasing may be your only option.

If you use Microsoft Excel on a regular basis, odds are you work with numbers. Put those numbers to work. Statistical analysis allows you to find patterns, trends and probabilities within your data. In this MS Excel tutorial from everyone's favorite Excel guru, YouTube's ExcelsFun, the 27th installment in his "Excel Statistics" series of free video lessons, you'll learn how to create a quantitative data dot plot chart using the REPT and COUNTIF functions.

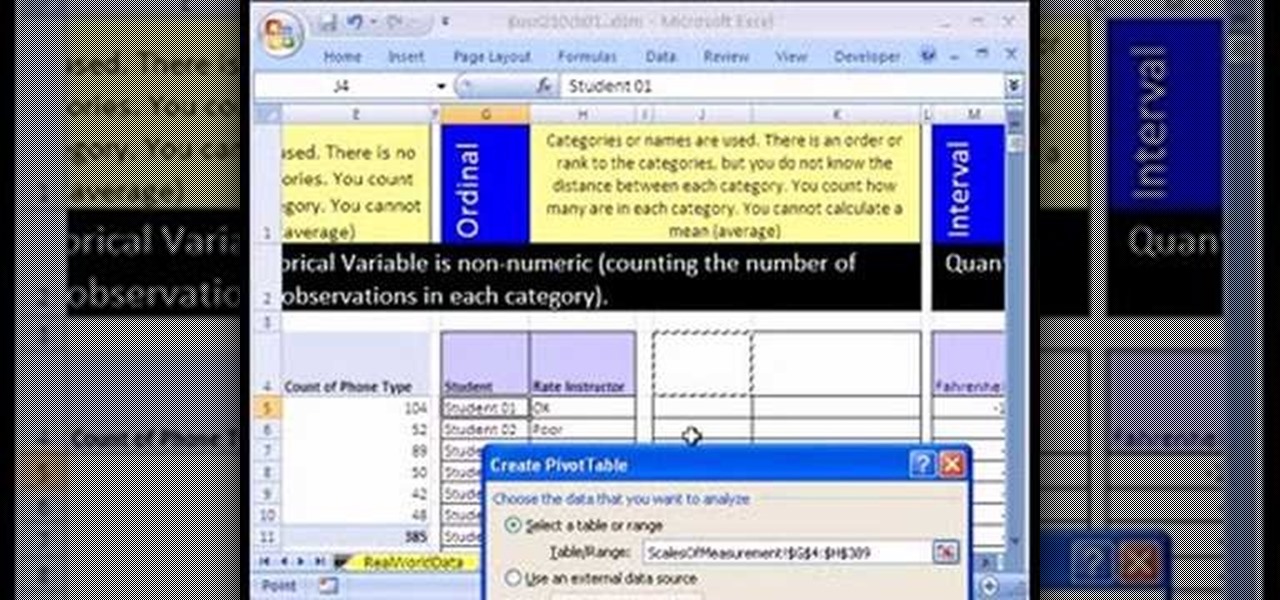
If you use Microsoft Excel on a regular basis, odds are you work with numbers. Put those numbers to work. Statistical analysis allows you to find patterns, trends and probabilities within your data. In this MS Excel tutorial from everyone's favorite Excel guru, YouTube's ExcelsFun, the 16th installment in his "Excel Statistics" series of free video lessons, you'll learn how to cross tabulate & do percentage cross tabulation for categorical data using a pivot table (PivotTable).

If you use Microsoft Excel on a regular basis, odds are you work with numbers. Put those numbers to work. Statistical analysis allows you to find patterns, trends and probabilities within your data. In this MS Excel tutorial from everyone's favorite Excel guru, YouTube's ExcelsFun, the 17th installment in his "Excel Statistics" series of free video lessons, you'll learn how to cross tabulate & do percentage cross tabulation for categorical data using formulas rather than pivot tables.

If you use Microsoft Excel on a regular basis, odds are you work with numbers. Put those numbers to work. Statistical analysis allows you to find patterns, trends and probabilities within your data. In this MS Excel tutorial from everyone's favorite Excel guru, YouTube's ExcelsFun, the 10th installment in his "Excel Statistics" series of free video lessons, you'll learn how about data sets and the nominal, ordinal, interval and ration scales/levels of measurement and see two Pivot Tables that...

Data is king. Nearly every carrier and MVNO offers unlimited talk and text with their cellular plans. Where they differ is the amount of data available, so that's the part that can save or cost you the most money.

Oysters are a bit of an acquired taste, you really need to try a few times to really begin appreciating them. Then once you get into it, you realise there are so many different types that you need to get to know them one by one.

Time for your colonoscopy? Got a friend turning fifty? Take a "wild ride on a flying scope" with this digestive ditty sure to make your toes and bowels move! The divine Ms. Butt Meddler, known for her cheeky and probing insight, will bring you laughter and the intestinal fortitude you need for your own personal periscopic procedure with this charming bowel ballad.

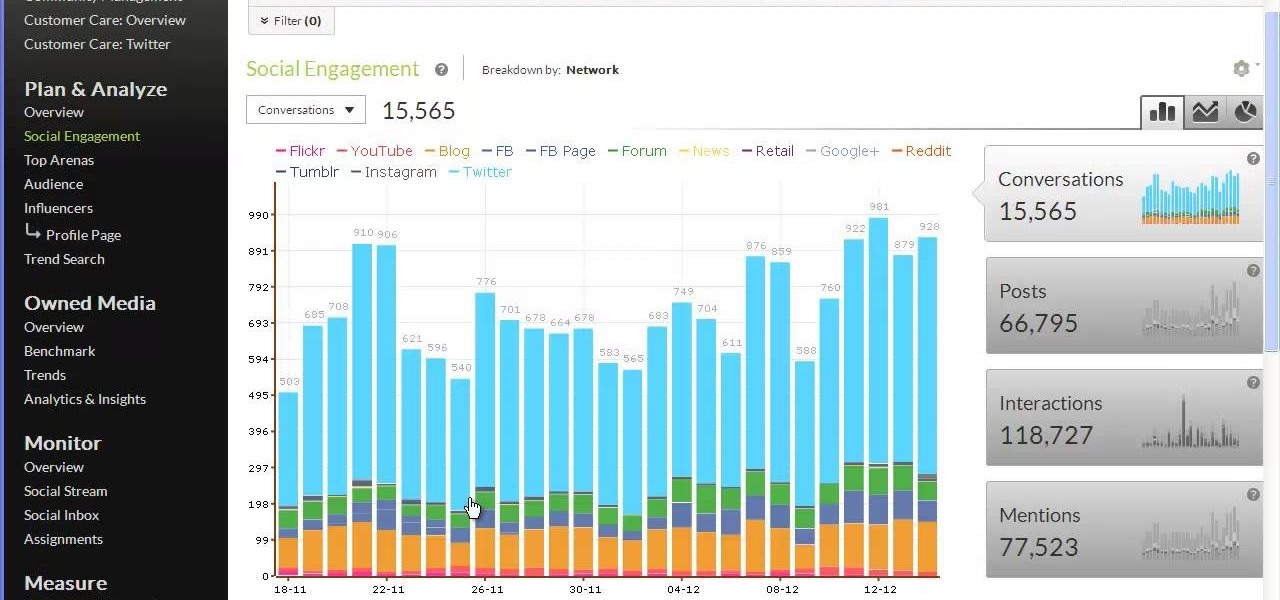
Tracx is a social intelligence software platform that allows enterprises to manage, share and extract actionable insights, threats and opportunities from the social web —in real time.

Tim Carter shares some insights about vapor barriers and how to install them on your next project. This easy-to-understand video will show how to install new water infiltration barriers which will protect your house.

Smartphones are becoming pocket computers, jammed full of data essential to our personal and professional lives. With AT&T's 360 Backup app you can protect your important information with the push of a few buttons.

If you picked up a new Xbox 360 Slim, the first thing you're going to want to do is transfer all your old saved game data from your old Xbox 360 to the new internal hard drive in the Slim 360.

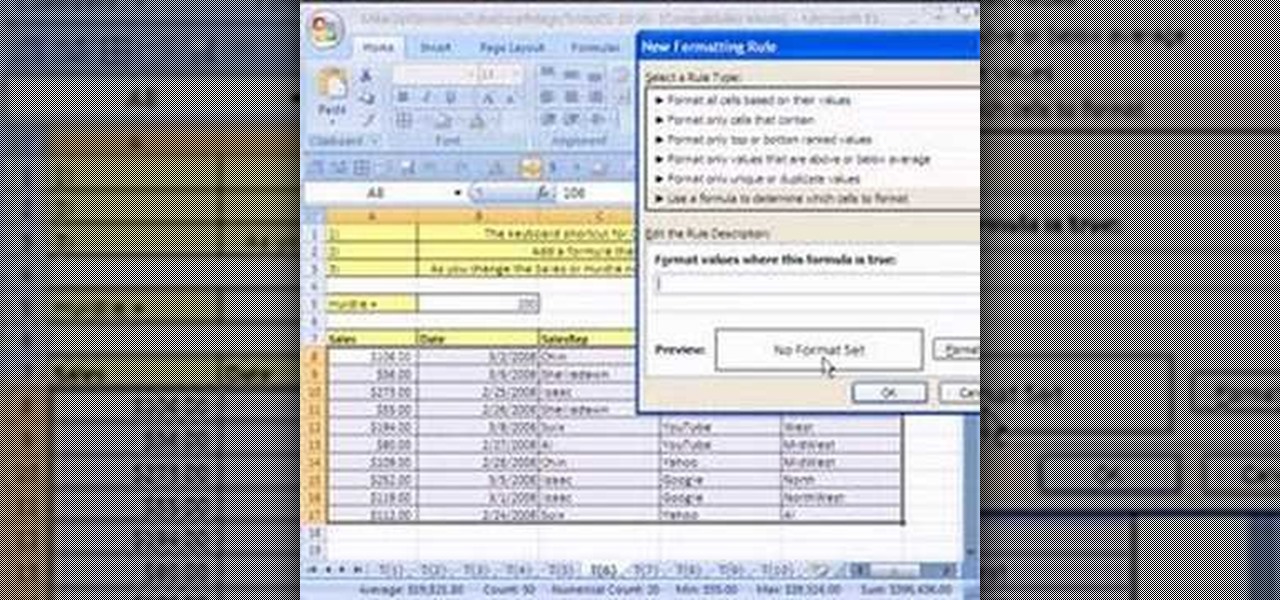
New to Microsoft Excel? Looking for a tip? How about a tip so mind-blowingly useful as to qualify as a magic trick? You're in luck. In this MS Excel tutorial from ExcelIsFun, the 6th installment in their series of digital spreadsheet magic tricks, you'll learn how to add conditional formatting to a whole row of data in an Excel sheet.

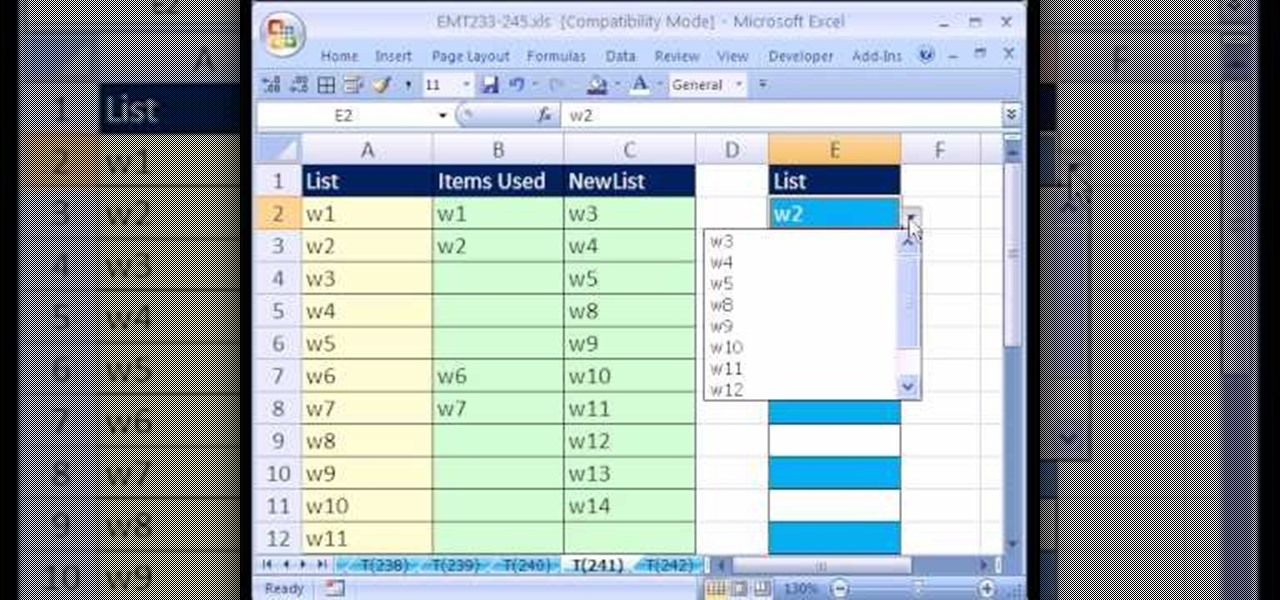
New to Microsoft Excel? Looking for a tip? How about a tip so mind-blowingly useful as to qualify as a magic trick? You're in luck. In this MS Excel tutorial from ExcelIsFun, the 241st installment in their series of digital spreadsheet magic tricks, you'll learn how to create a data validation drop-down cell list where the list shrinks as you select values.

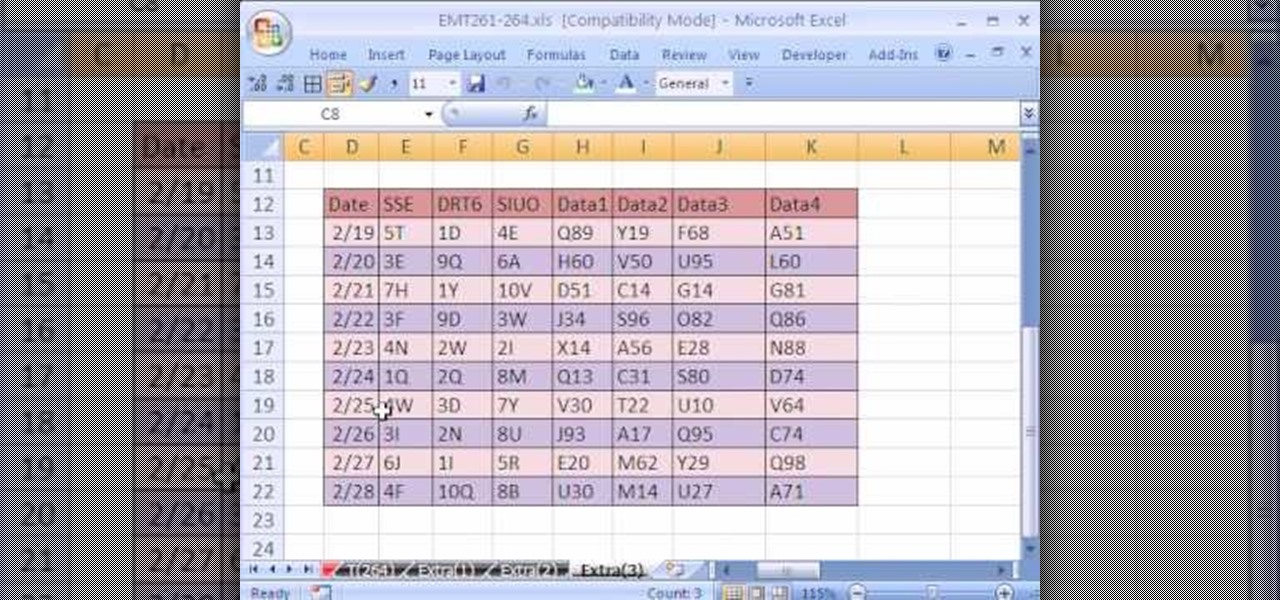
New to Excel? Looking for a tip? How about a tip so mind-blowingly useful as to qualify as a magic trick? You're in luck. In this Excel tutorial from ExcelIsFun, the 264th installment in their series of digital spreadsheet magic tricks, you'll learn how to use a recorded macro to take a data set and add a new column, concatenate data from 3 columns, and delete unwanted columns.

The new Pyro FX in Houdini 10 are very impressive with improved workflow. The Pyro FX are great for creating 3D fire and smoke effects. And in this video tutorial series, you will learn the Pyro FX workflow in-depth and the parameters used to create fire and smoke effects. You will also see how volumetric data is created and recorded, and how to visualize it.

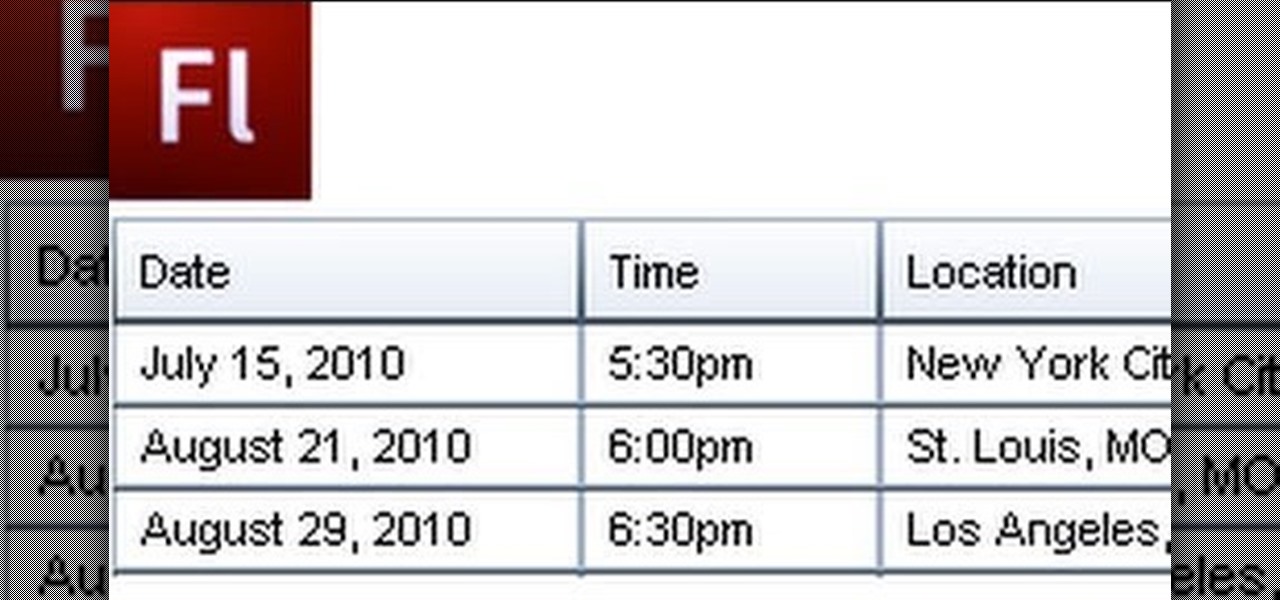
A Data Grid lets you organize information on your website or other Flash project. Create lists or schedules, like concert dates, by using the Data Grid component included in Adobe Flash CS4, and then modify it using Action Script 3.

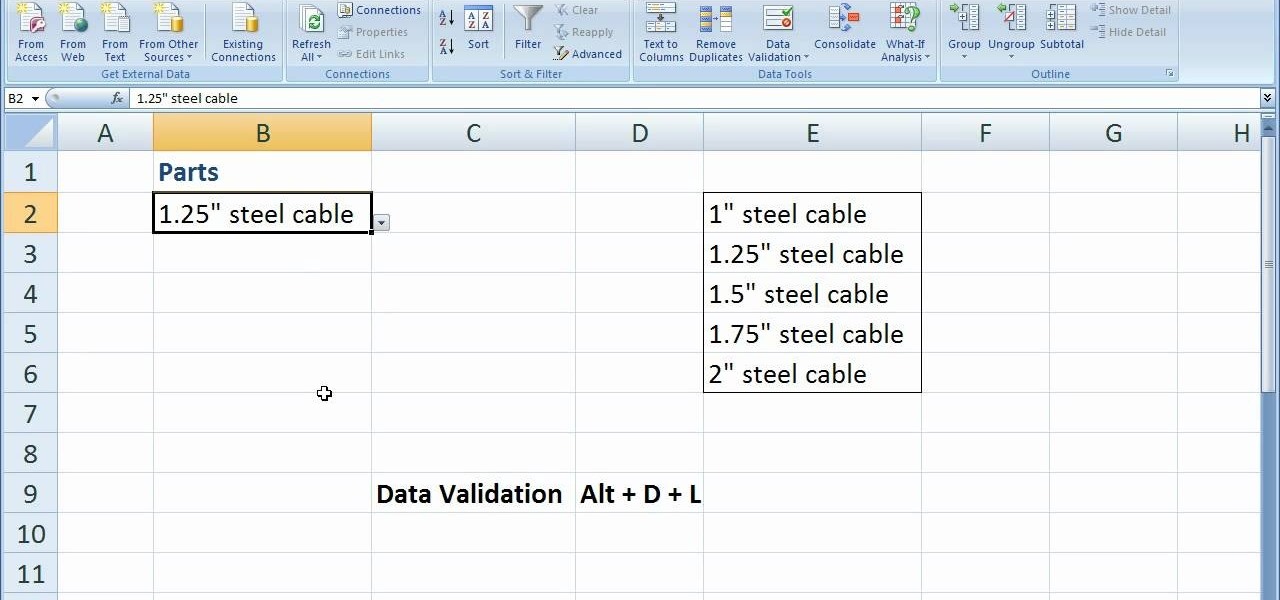
In this software video tutorial you will learn how to create drop down menus in Excel using Data Validation. This example will show you how to display a list of parts in a drop down menu. Create the list of parts somewhere in your worksheet. Then in the cell underneath the one where you want to display the parts, go to the data validation window and enter the data. For this select the cell and then press 'Alt + D + L' to bring up the data validation box. Here you click on 'settings' and selec...

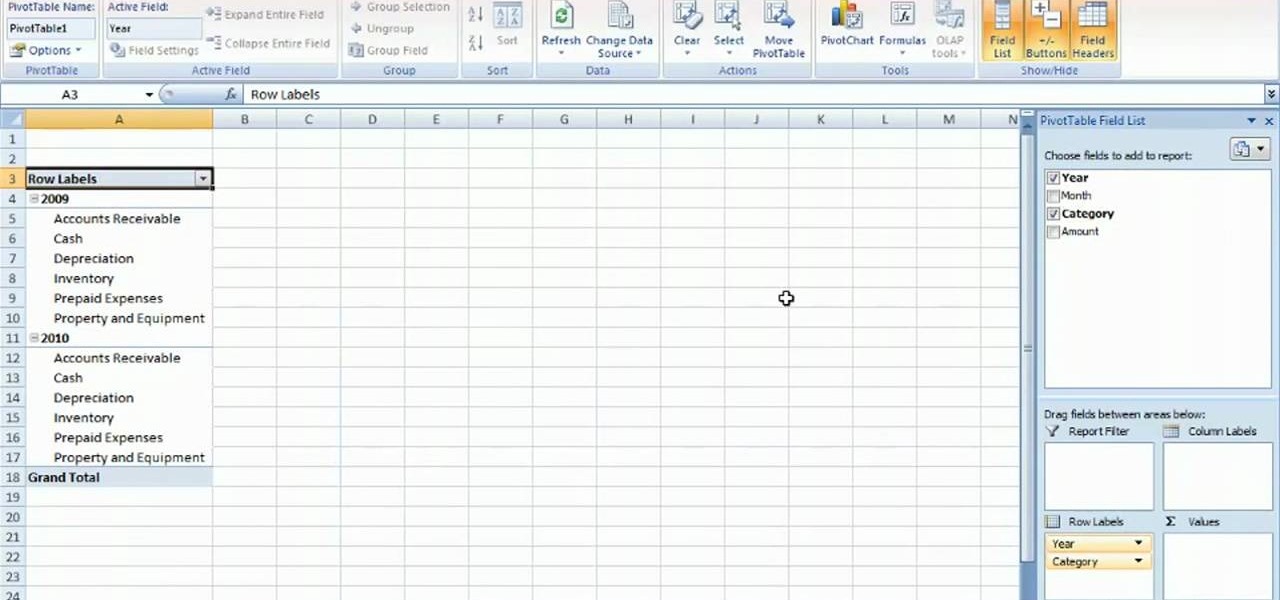
Learn how to create a summary of your budget data. Whether you're new to Microsoft's popular digital spreadsheet application or a seasoned business professional just looking to better acquaint yourself with the Excel 2010 workflow, you're sure to be well served by this video tutorial. For more information, and to get started summarizing your own budget data, watch this free video guide.

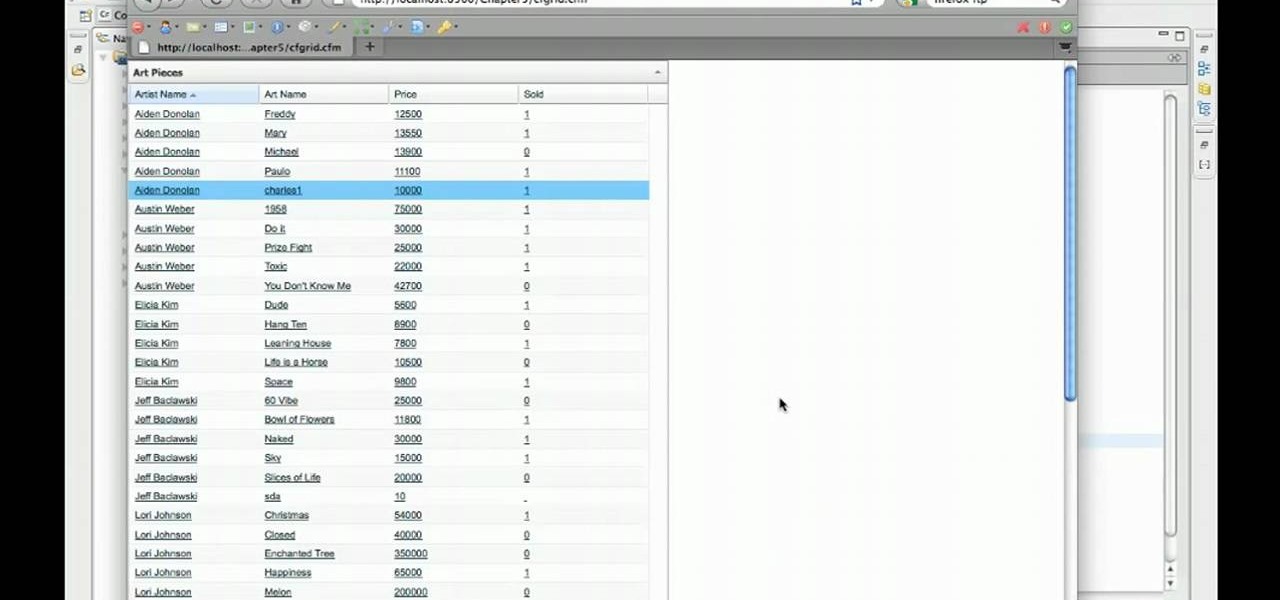
Quickly and intelligently organize your information through use of ColdFusion 9's ever-useful data grid feature. Whether you're new to Adobe's popular rapid Internet application development platform or simply wish to become better acquainted with the program, you're sure to find benefit in this free video software tutorial. For more information, including specific, step-by-step instructions, take a look.

Want to know how to back up your data to an external hard drive? Protect yourself against data loss and heartbreak with this free home computing how-to from the folks at CNET TV, which offers complete instructions on how to back up your important files either manually or automatically. For specifics, and to get started backing up your own stuff, watch this handy how-to.

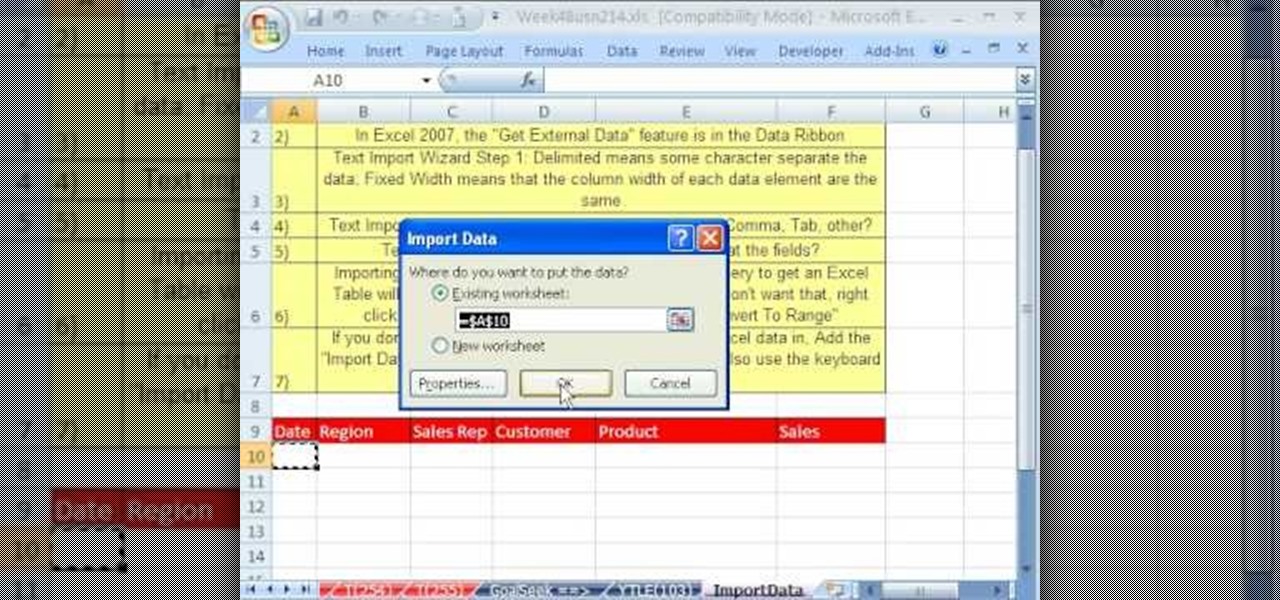
Whether you're interested in learning Microsoft Excel from the bottom up or just looking to pick up a few tips and tricks, you're in the right place. In this tutorial from everyone's favorite digital spreadsheet guru, ExcelIsFun, the 23rd installment in his "Highline Excel Class" series of free video Excel lessons, you'll learn how to import data into Excel from text files, web sites, Excel files and Microsoft Office Access files. Also see how to import currency rates and major indicies from ...

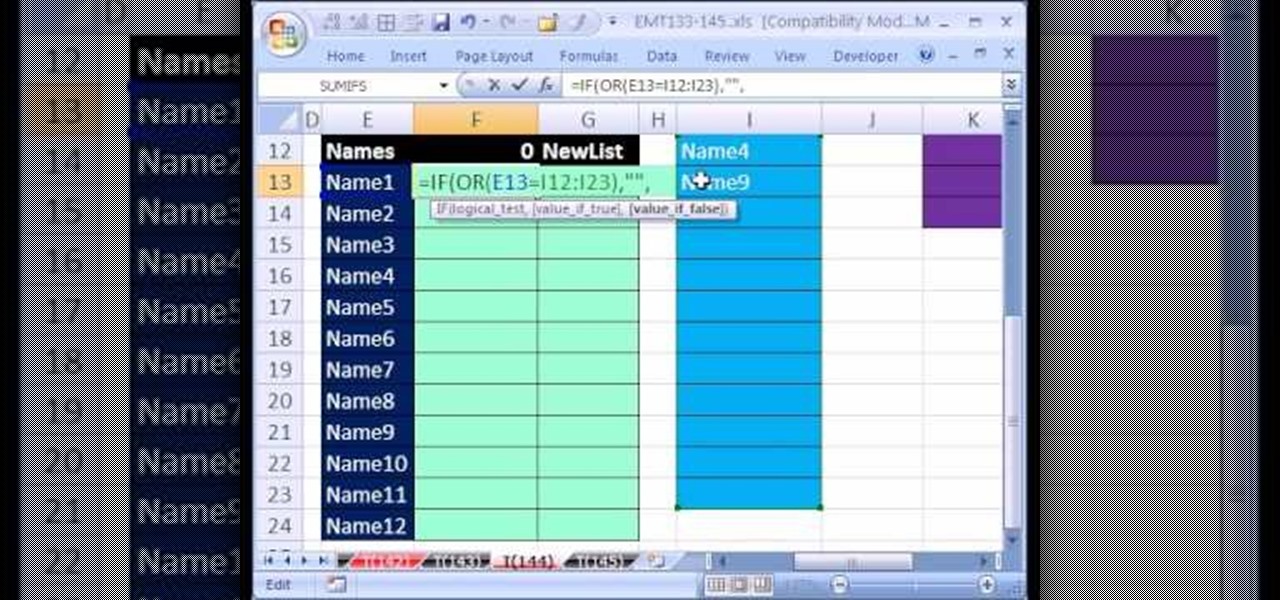
Love Microsoft Excel? This clip contains a tip that just might induce you to. With this free video tutorial from ExcelIsFun, the 144th installment of his "YouTubers Love Excel" or YTLE series of free video MS Excel lessons, you'll learn how to work around data validation's one-rule limit by creating a second shrinking list that looses values as they are used in the data validation area.

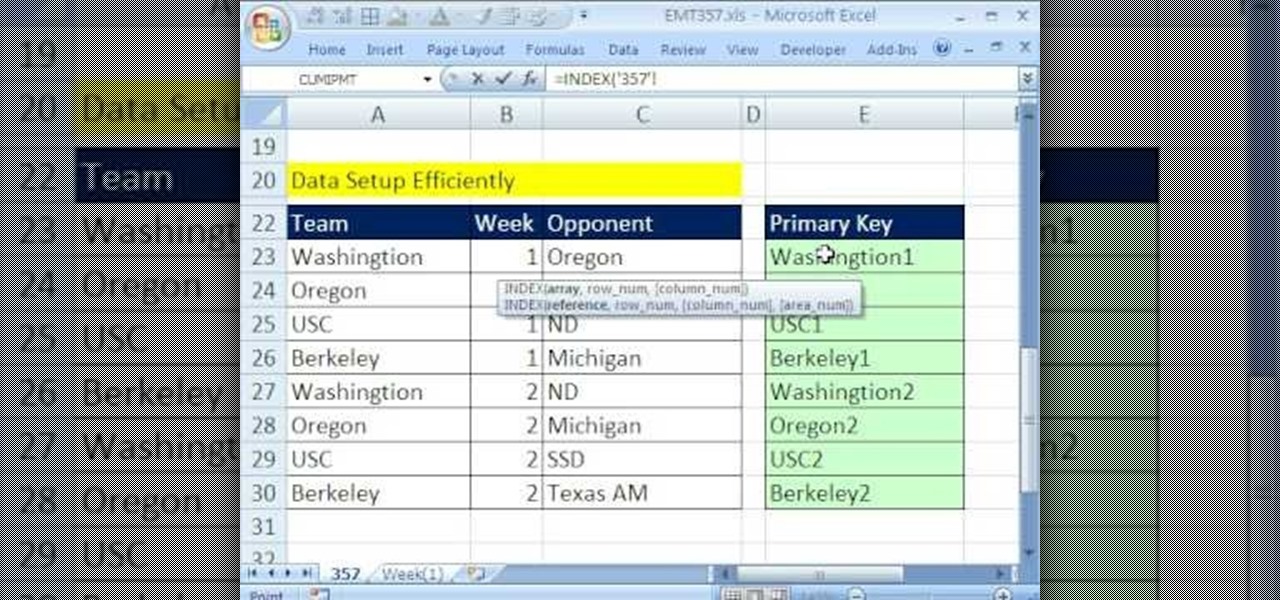
New to Microsoft Excel? Looking for a tip? How about a tip so mind-blowingly useful as to qualify as a magic trick? You're in luck. In this MS Excel tutorial from ExcelIsFun, the 357th installment in their series of digital spreadsheet magic tricks, you'll learn how to pull data from individual sheets to a single master sheet given improper data setup.

This lynda.com video tutorial shows how to use container fields with FileMaker Pro 10. When you want to create fields in FileMaker database you have the choice on what kind of fields you want to make. Many general fields are self explanatory like text, date etc., but there is a special kind of field called the container field. FileMaker Pro container field is a versatile data type in that it can store any kind of binary data. Container fields can be used to hold binary data in four broad clas...

This tutorial on the companion Tech Ease for Mac site shows you how to use Inspiredata to collect, organize, and visualize data using several types of diagrams supported by the program. The movies were recorded on a Mac, but Inspiredata is a cross-platform program so the steps shown should work on the Windows version of the program as well. Inspiredata works like a database system that allows you to add notes and more.

Your data is your most important asset on your computer. Learn how to keep your data safe using Carbonite.com


