Accidentally deleting important files can happen as easily as swiping left on something and watching it disappear into the ether. Of course, Apple allows automatic backups through iCloud, which ensures that your data is always stored safely in the cloud in case of emergency.

Welcome back, my fledgling hackers! With this first article, I am initiating a new series intended to convey to my readers the skills necessary to develop your own exploits.

T-Mobile continues to make waves in the U.S. wireless market behind CEO John Legere's UnCarrier program. At the latest installment in a series of industry-challenging announcements, Uncarrier 5.0 unveiled Test Drive. The new program is set to allow would-be customers to try out the "latest generation" iPhone for seven days on T-Mobile's network without any financial commitments.

Not having internet sucks! We do a ton online these days, from working, shopping, studying, and collaborating, to watching fail videos and endlessly clicking through memes.

For people that live outside of the United States, how many times has this happened when surfing through U.S. streaming services? If you're outside of the U.S. market and want to stream stateside services like Hulu, MTV, CBS, Pandora, and others—you're in luck. Tunlr is an application that re-addresses certain data envelopes, tricking the receiver into thinking the data originated from within the U.S. by using its own DNS server's IP address. You can even watch some non-US shows stateside, li...

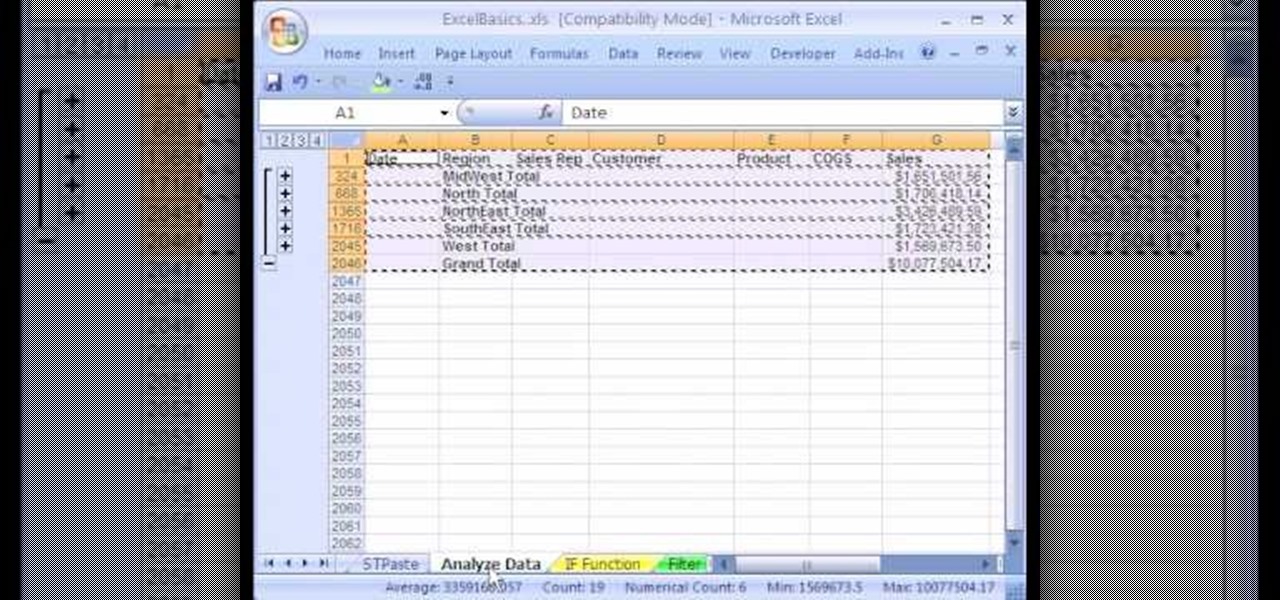
1. The following instruction describes how to generate sub totals in Microsoft Excel Sheet. 2. Take Region as a Primary column and Sales Rep as a Secondary Column. 3. First method to sort: Select a cell in Region and goto Data select A to Z. 4. Second method to sort: Select a cell in Region and Right click and select Sort A to Z 5. Then click a cell in Region and select Data->OutLine->SubTotal 6. In the SubTotal Window select 1.Each Change in: Region 2.Use function:Sum 3.Add subTotal to:Sales...

Verizon Wireless has a data cap on the 4G LTE connection that the Motorola Droid Bionic uses to connect to the internet and download information from its apps. If you want to stop your phone from hitting these caps and causing you overage fees, you can turn off the 4G connection by looking at this guide. It will save your smartphone's battery life as well!

If you are looking for a data storage solution that's portable, but also durable, you should watch this video to learn how to build a USB hard drive. Take apart your external hard drive to find out what kind it is and then build a new one.

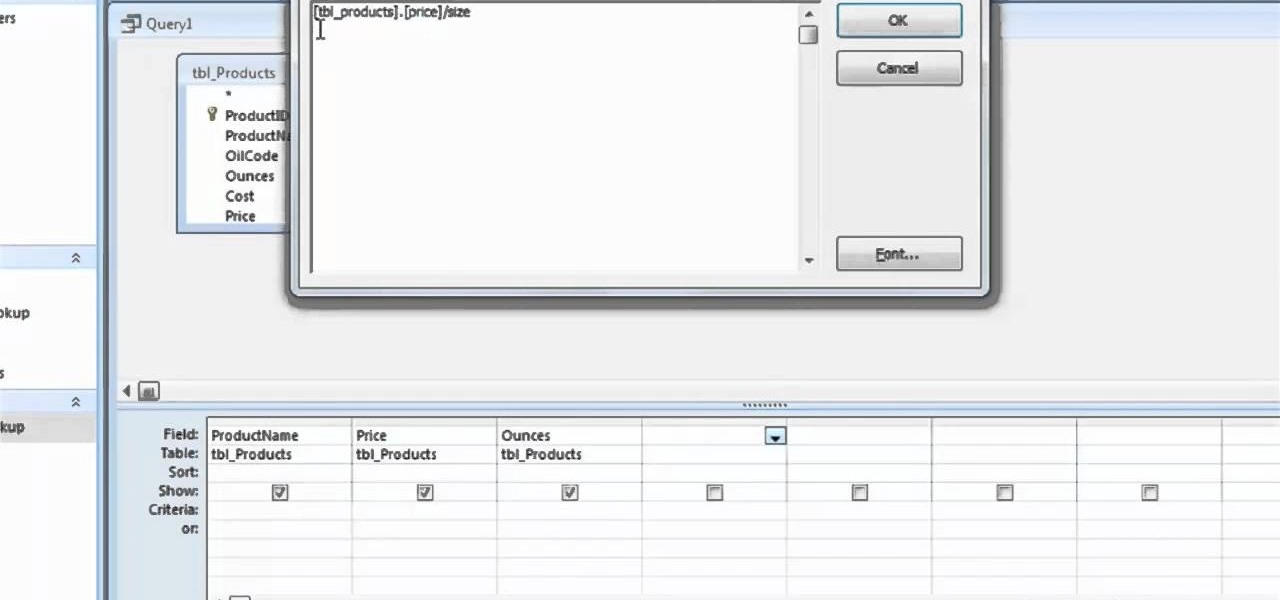
In this clip, you'll learn how to employ mathematical operators when running queries in MS Access 2007. Whether you're new to Microsoft's popular data management application or a seasoned MS Office professional just looking to better acquaint yourself with the Access 2007 workflow, you're sure to be well served by this video tutorial. For more information, including step-by-step instructions, watch this free video guide.

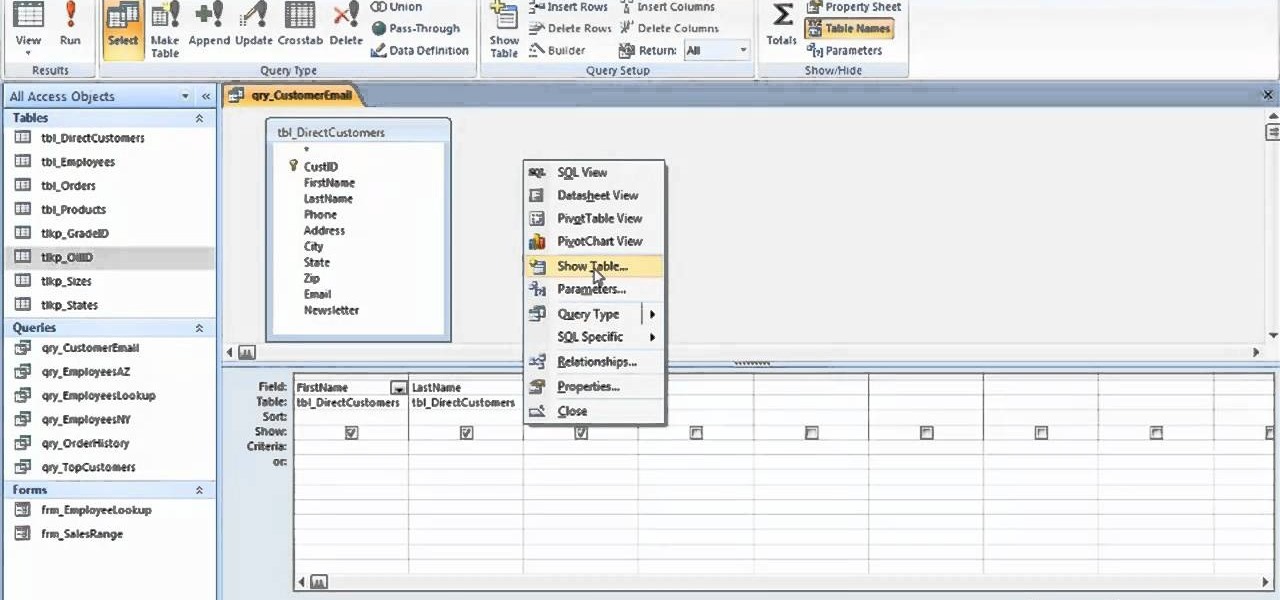
In this clip, you'll learn how to take advantage of the Microsoft Access QBE interface. Whether you're new to Microsoft's popular data management application or a seasoned MS Office professional just looking to better acquaint yourself with the Access 2007 workflow, you're sure to be well served by this video tutorial. For more information, including step-by-step instructions, watch this free video guide.

A great tool for any system administrators, the iPhone (or other Apple wifi device) app Ping a Majig allows you to enter in the IP addresses of websites. Then you can keep checking on them to make sure they are running smoothly and operating correctly. You can click on the website for more data regarding pings and site health.

Cordell Connect is useful software for managing projects for your business. One of the functions of this program is being able export your reports to either an Excel spreadsheet or a PDF document for a greater ease of data manipulation and communication.

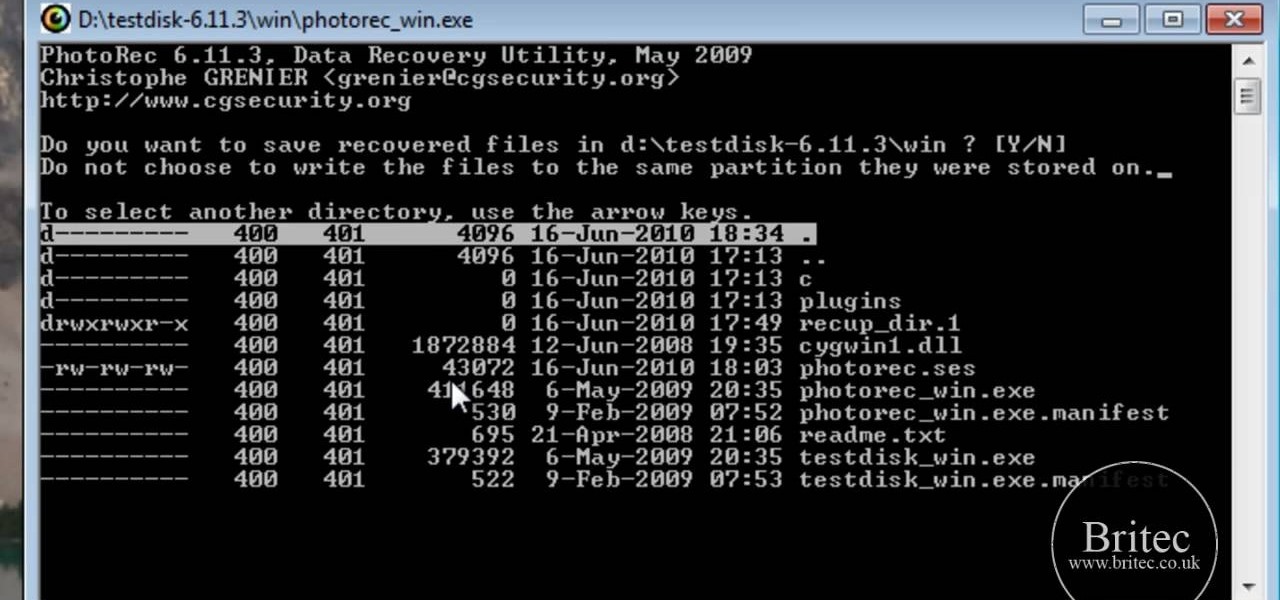
Looking for instructions on how to use TestDisk to recover files from a formatted hard drive on a Microsoft Windows PC? It's easy! So easy, in fact, that this home-computing how-to from the folks at Britec can present a complete overview of the process in just over six minutes. For more information, including step-by-step instructions, take a look.

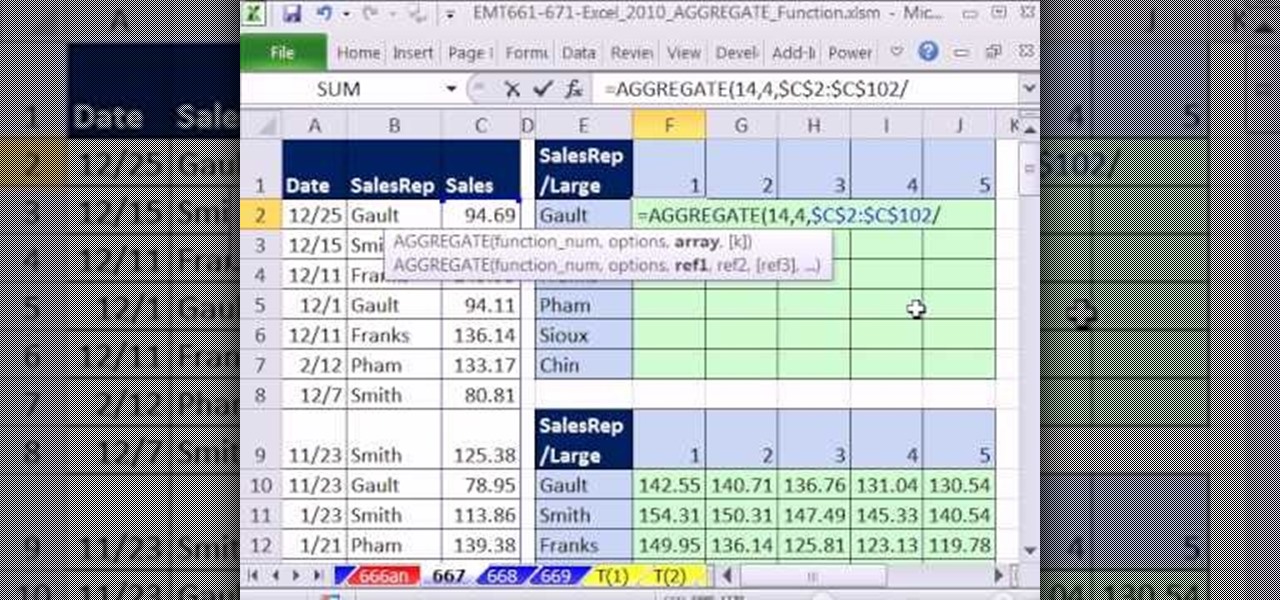
New to Microsoft Excel? Looking for a tip? How about a tip so mind-blowingly useful as to qualify as a magic trick? You're in luck. In this MS Excel tutorial from ExcelIsFun, the 568th installment in their series of digital spreadsheet magic tricks, you'll learn how to calculate the five largest values for each a data set using the new AGGREGATE function.

Want to delete your data once and for all? This clip will show you how it's done. It's easy! So easy, in fact, that this home-computing how-to from the folks at Butterscotch can present a complete overview of the process in about three minutes' time. For details, and to get started erasing your own PC hard drive, take a look.

In this clip, learn how to trade phones and iPads back and forth by customizing your SIM card. This video will walk you through how to size and cut your SIM into the right shape for different devices. By customizing your chip, you will be able to move your data from one device to another with no problem. Use your old 3G SIM in your new iPhone 4 with this awesome hack.

In this tutorial, you'll see how easy it is to bring your footage into PFTrack and then quickly take that data into Cinema 4D to begin to add your elements. Whether you're new to MAXON's popular 3D modeling application or are just looking to get better acquainted with Cinema 4D and its various features and functions, you're sure to enjoy this free video software tutorial. For more information, including complete instructions, watch this 3D modeler's guide.

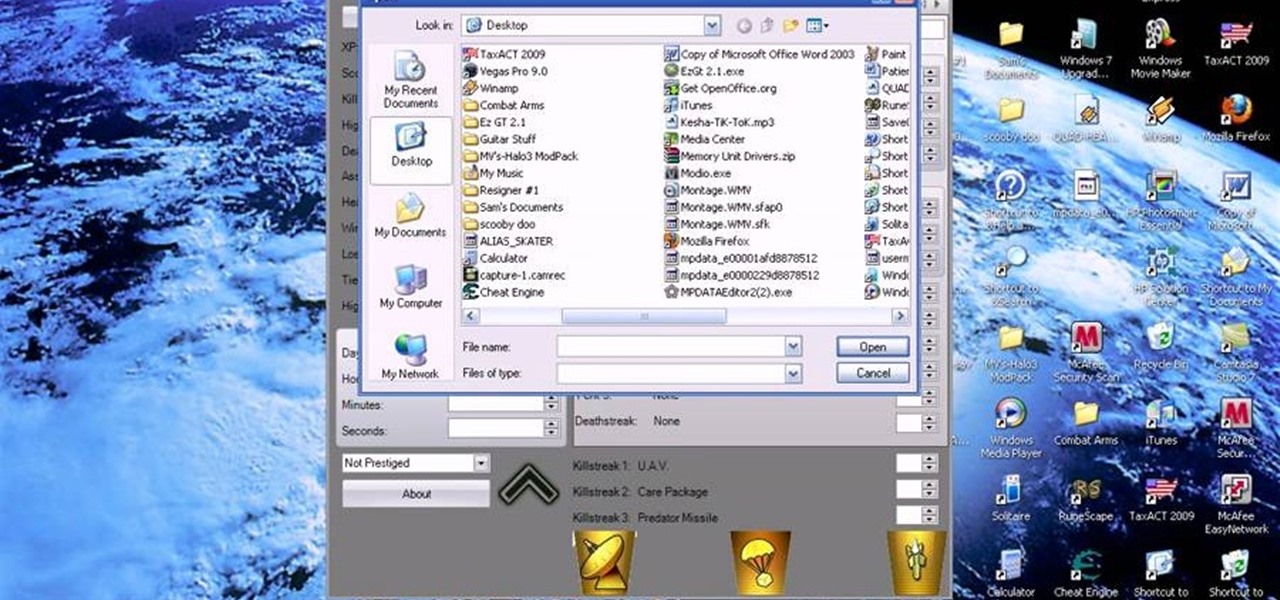
In this tutorial, learn how to mod your MW2 game into split screen using your PC and a data transfer cord. This clip will show you step by step how to get up and running with this neat modification.

Want to share your Windows Mobile phone's high-speed data connection with your laptop over Bluetooth? It's easy! So easy, in fact, that this home computing how-to from the folks at CNET TV can present a complete (and somewhat talky) overview of the process in just over a minute's time. For the specifics, and to get started tethering your own Windows or Mac laptop to your Windows Mobile phone, just watch this handy how-to.

Learn how to use CSS (cascading style sheets) to style pages created in Adobe Dreamweaver CS5. Whether you're new to Microsoft's popular data management application or a seasoned MS Office professional just looking to better acquaint yourself with the Access 2007 workflow, you're sure to be well served by this video tutorial. For more information, and to get started applying CSS formatting to your own pages, watch this free video guide.

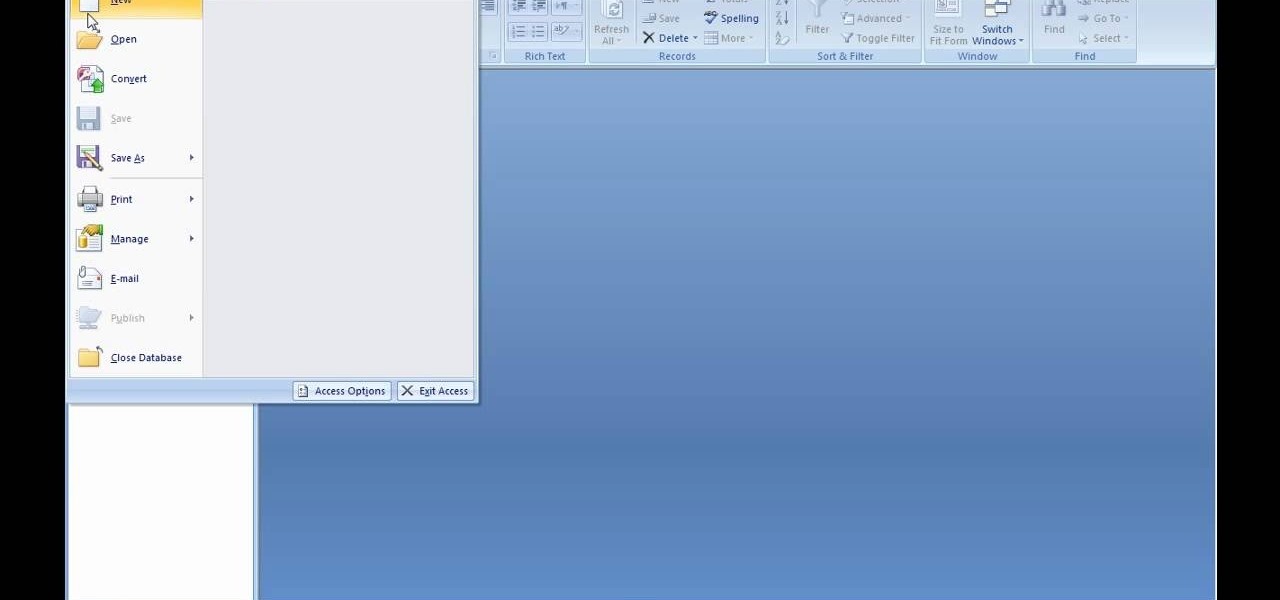
Interested in upgrading from Microsoft Access 2003 to MS Access 2007? Whether you're new to Microsoft's popular data management application or a seasoned MS Office professional just looking to better acquaint yourself with the Access 2007 workflow, you're sure to be well served by this video tutorial. For more information, and to get started making the switch from Access 2003 to 2007 yourself, watch this free video guide.

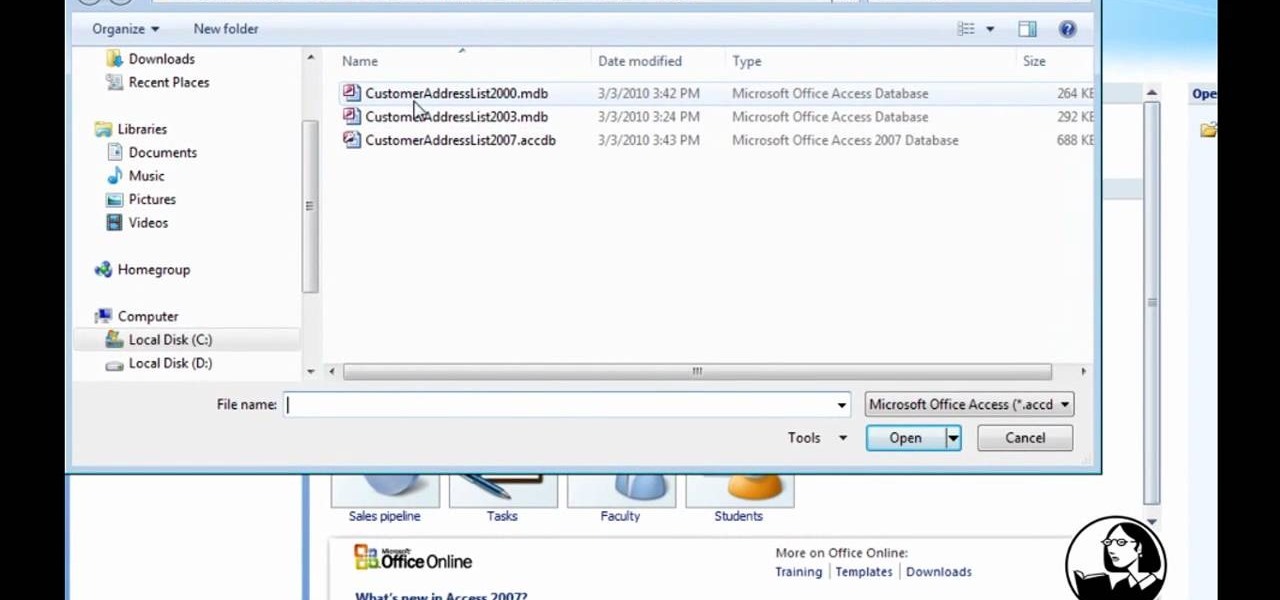
Learn how to modify your old databases for use in Microsoft Access 2007. Whether you're new to Microsoft's popular data management application or a seasoned MS Office professional just looking to better acquaint yourself with the Access 2007 workflow, you're sure to be well served by this video tutorial. For more information, and to get started using old databases in Access 2007 yourself, watch this free video guide.

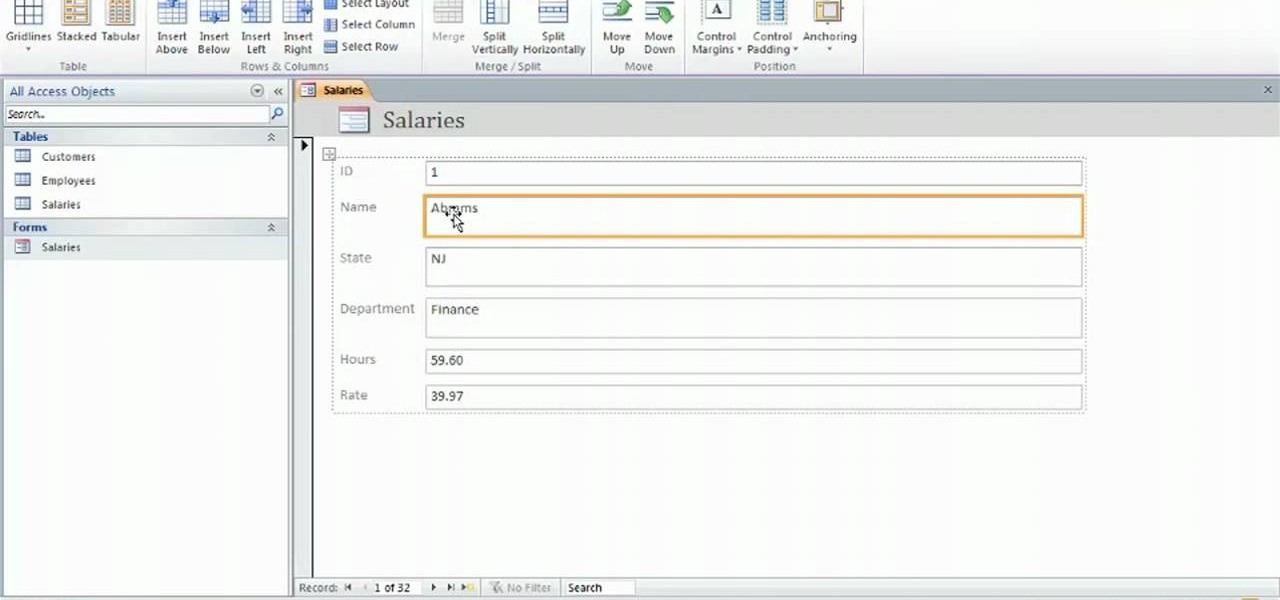
Learn how to use the Layout view when working in Microsoft Access 2010. Whether you're new to Microsoft's popular data management application or a seasoned MS Office professional just looking to better acquaint yourself with the Access 2010 workflow, you're sure to be well served by this video tutorial. For more information, and to get started using the Layout view in your own Access projects, watch this free video guide.

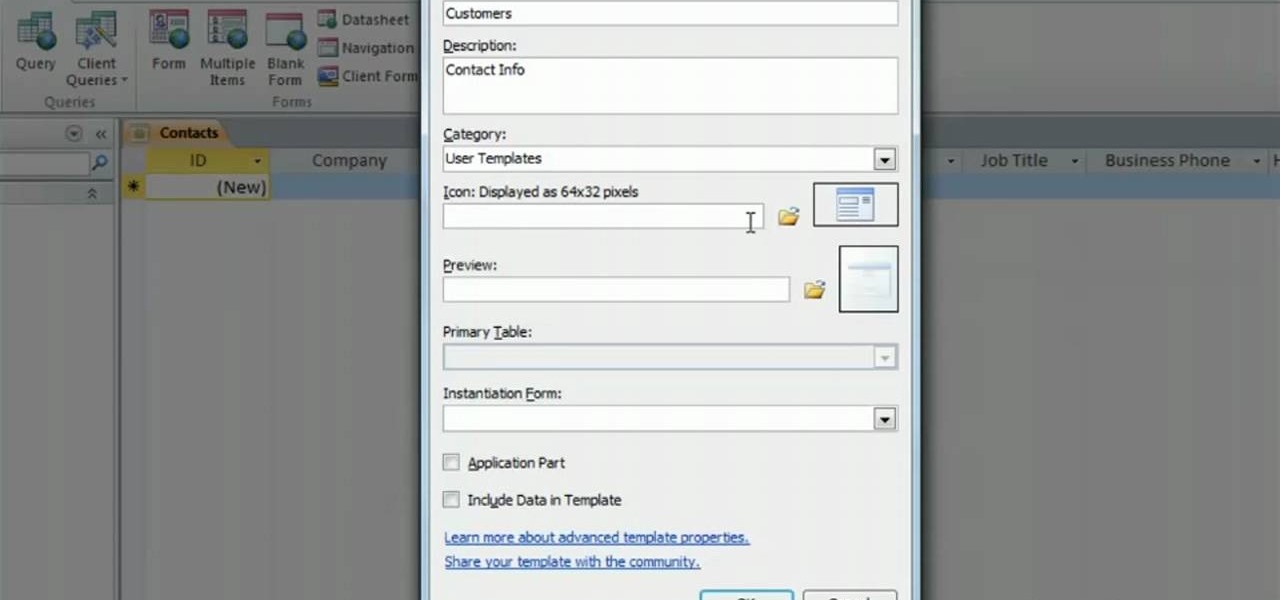
Learn how to work with Application Parts when using Microsoft Access 2010. Whether you're new to Microsoft's popular data management application or a seasoned MS Office professional just looking to better acquaint yourself with the Access 2010 workflow, you're sure to be well served by this video tutorial. For more information, and to get started working with Application Parts in your own Access projects, watch this free video guide.

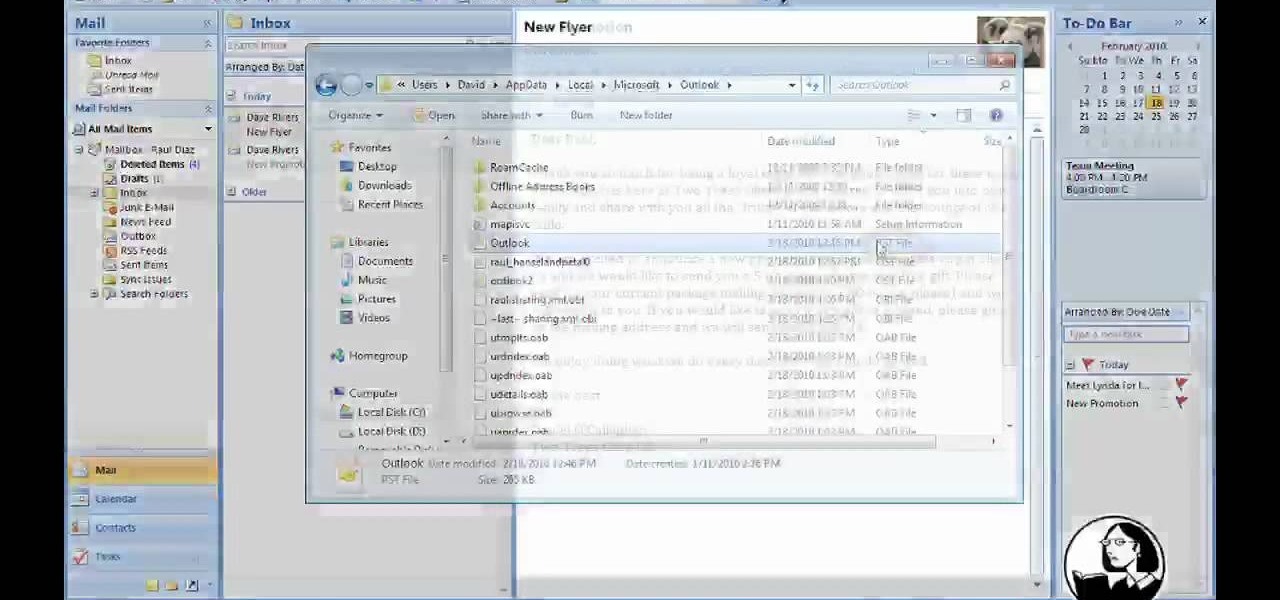
Need help making the switch from Outlook 2003 to 2007? Give this guide a gander. This free video tutorial presents an easy-to-follow overview of everything you'll need to know to migrate your data from one program to the other. For more information, and to get started using Microsoft Outlook 2007, watch this free video guide.

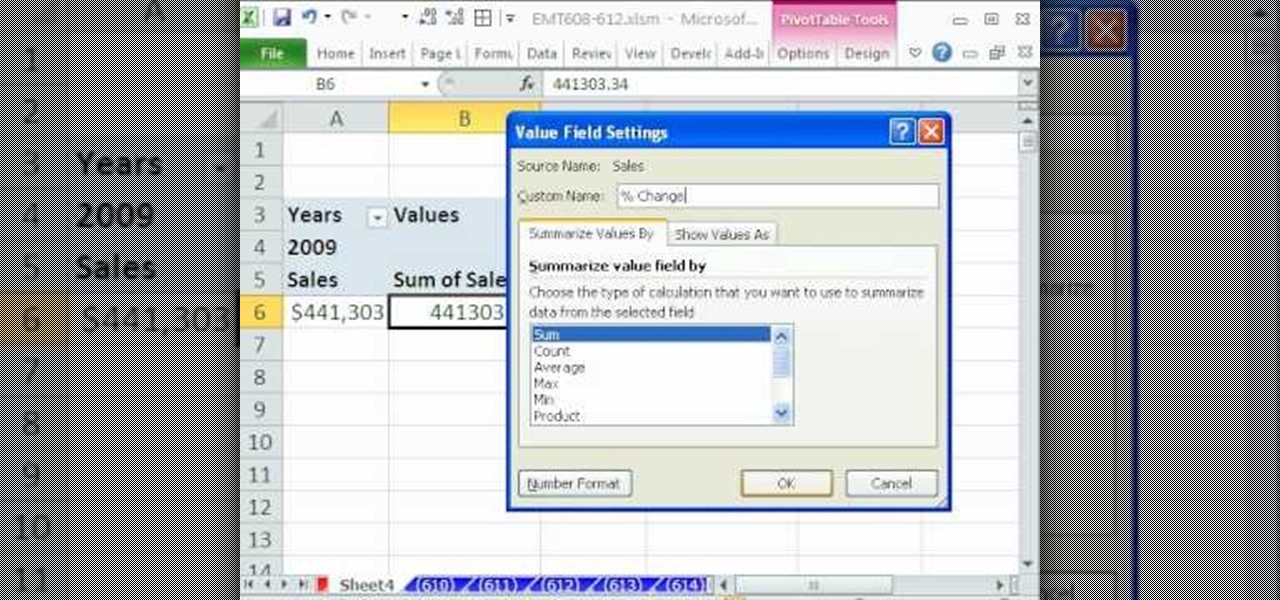
New to Microsoft Excel? Looking for a tip? How about a tip so mind-blowingly useful as to qualify as a magic trick? You're in luck. In this MS Excel tutorial from ExcelIsFun, the 609th installment in their series of digital spreadsheet magic tricks, you'll learn how to build a pivot table to calculate year over year sales showing percentage change.

Password protect your files and folders in Mac OS X. This free video tutorial from CNET TV will show you how. Thwart would-be snoopers with this home cryptography guide, which presents easy-to-follow, step-by-step instructions on how to protect your privacy by encrypting your sensitive data.

Password protect your files and folders in Microsoft Windows XP or Vista. This free video tutorial from CNET TV will show you how. Thwart would-be snoopers with this home cryptography guide, which presents easy-to-follow, step-by-step instructions on how to protect your privacy by encrypting your sensitive data.

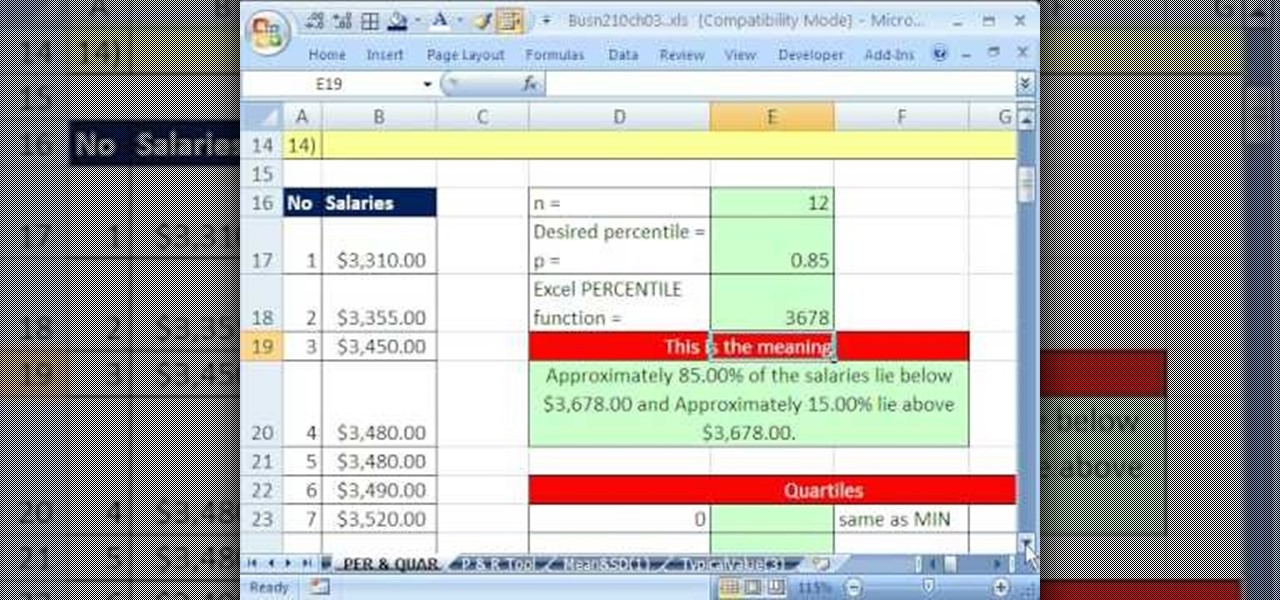
f you use Microsoft Excel on a regular basis, odds are you work with numbers. Put those numbers to work. Statistical analysis allows you to find patterns, trends and probabilities within your data. In this MS Excel tutorial from everyone's favorite Excel guru, YouTube's ExcelsFun, the 37th installment in his "Excel Statistics" series of free video lessons, you'll learn how to use the PERCENTILE and QUARTILE functions.

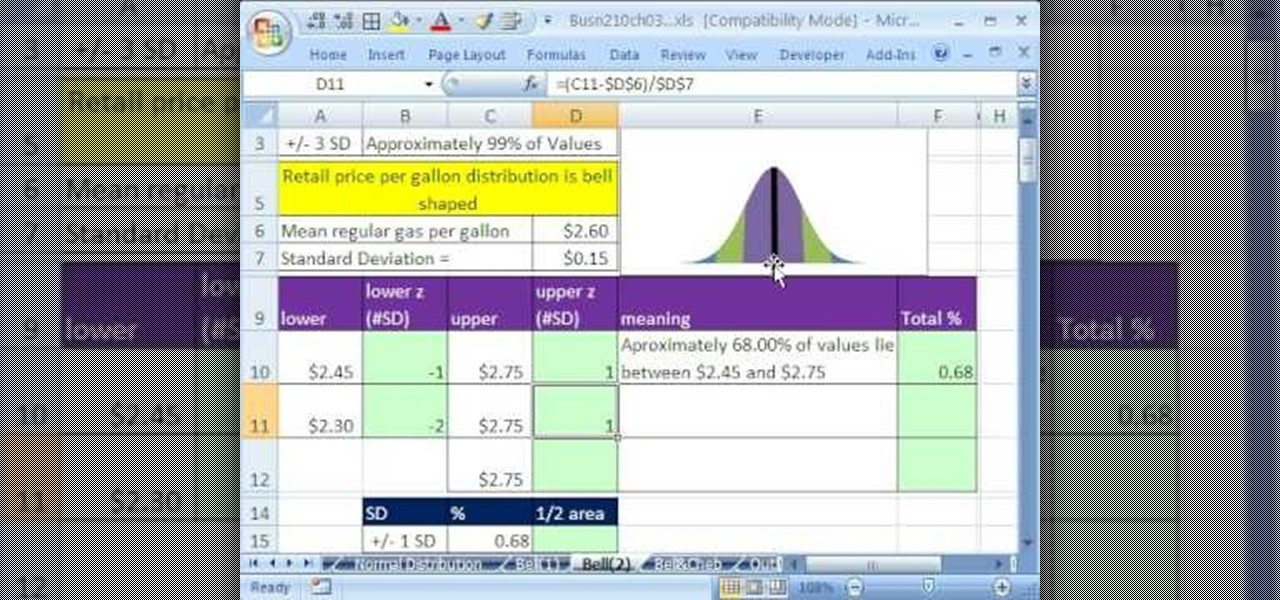
If you use Microsoft Excel on a regular basis, odds are you work with numbers. Put those numbers to work. Statistical analysis allows you to find patterns, trends and probabilities within your data. In this MS Excel tutorial from everyone's favorite Excel guru, YouTube's ExcelsFun, the 47th installment in his "Excel Statistics" series of free video lessons, you'll learn about the basics of the empirical rule (the bell curve) and how to apply it in various ways.

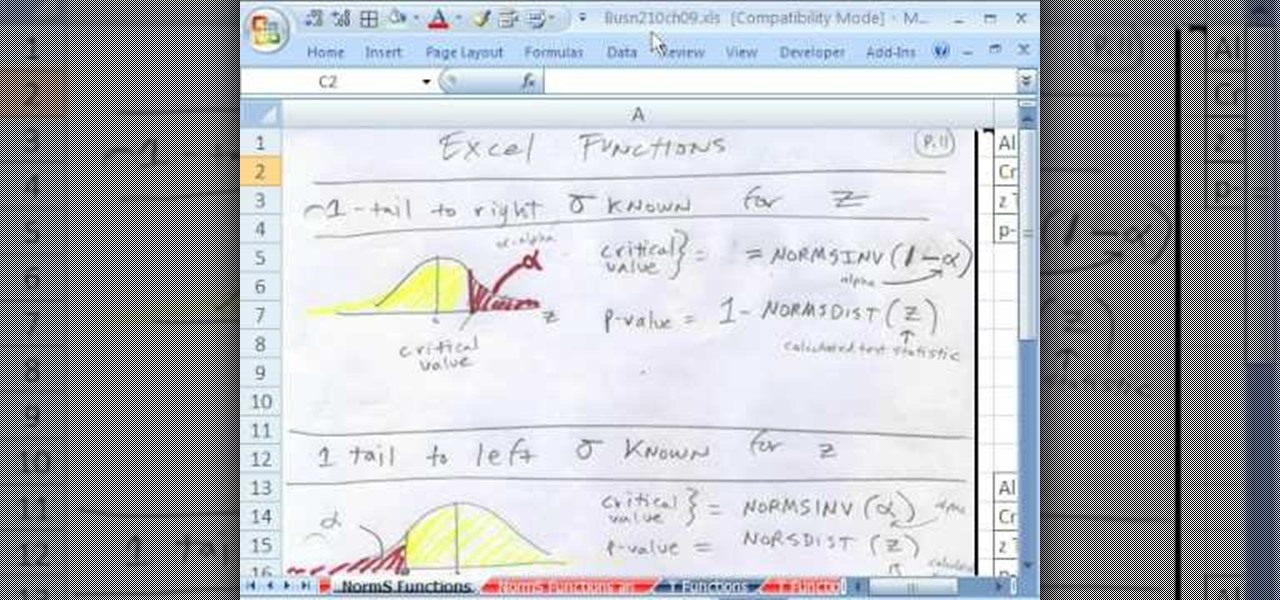
If you use Microsoft Excel on a regular basis, odds are you work with numbers. Put those numbers to work. Statistical analysis allows you to find patterns, trends and probabilities within your data. In this MS Excel tutorial from everyone's favorite Excel guru, YouTube's ExcelsFun, the 89th installment in his "Excel Statistics" series of free video lessons, you'll learn how to use the NORMSINV function for critical values and the NORSDIST function for p-values.

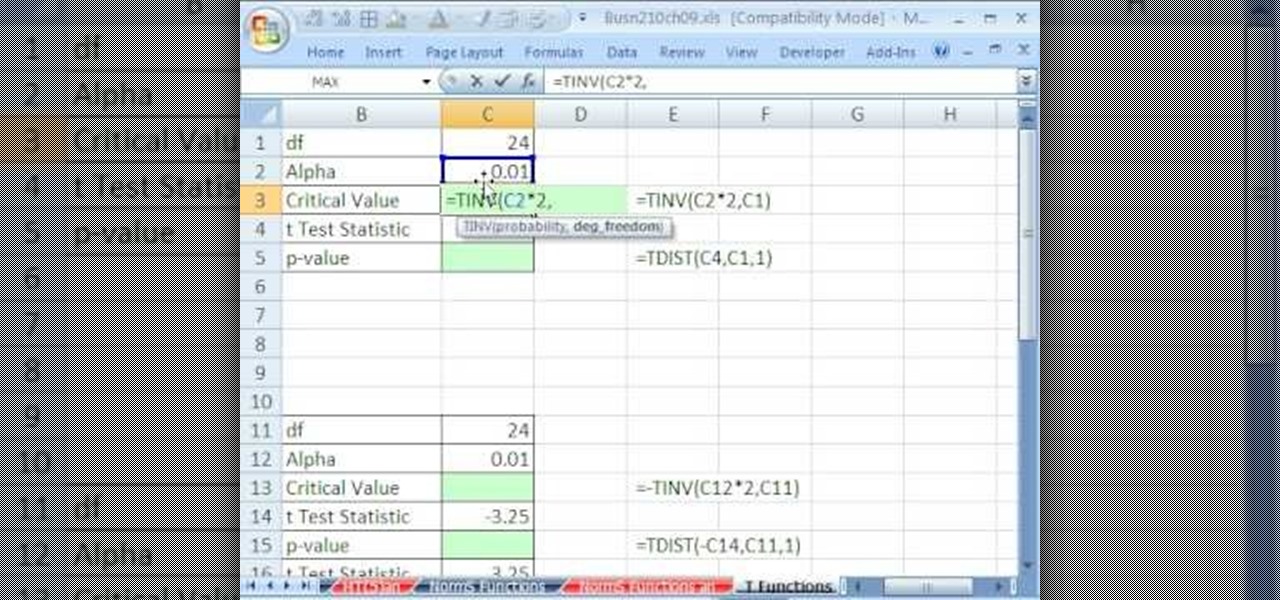
If you use Microsoft Excel on a regular basis, odds are you work with numbers. Put those numbers to work. Statistical analysis allows you to find patterns, trends and probabilities within your data. In this MS Excel tutorial from everyone's favorite Excel guru, YouTube's ExcelsFun, the 91st installment in his "Excel Statistics" series of free video lessons, you'll learn how to use TINV and TDIST functions to find critical values given an unknown sigma value.

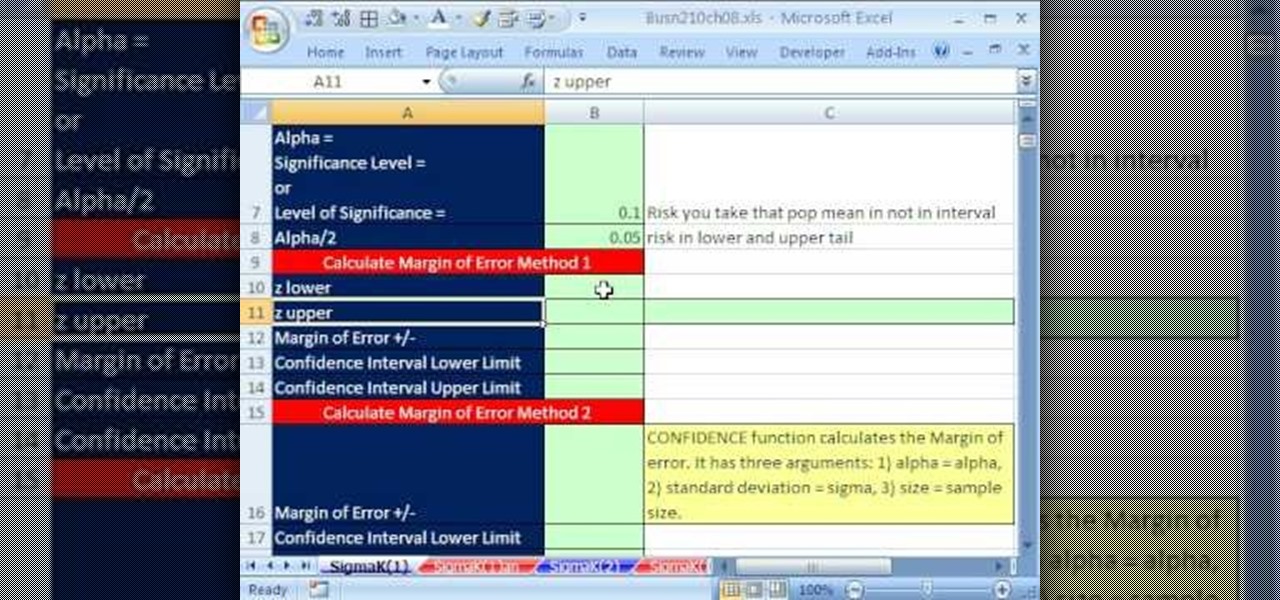
If you use Microsoft Excel on a regular basis, odds are you work with numbers. Put those numbers to work. Statistical analysis allows you to find patterns, trends and probabilities within your data. In this MS Excel tutorial from everyone's favorite Excel guru, YouTube's ExcelsFun, the 80th installment in his "Excel Statistics" series of free video lessons, you'll learn how to construct confidence intervals when the sigma is known known using the CONFIDENCE and NORMSINV functions.

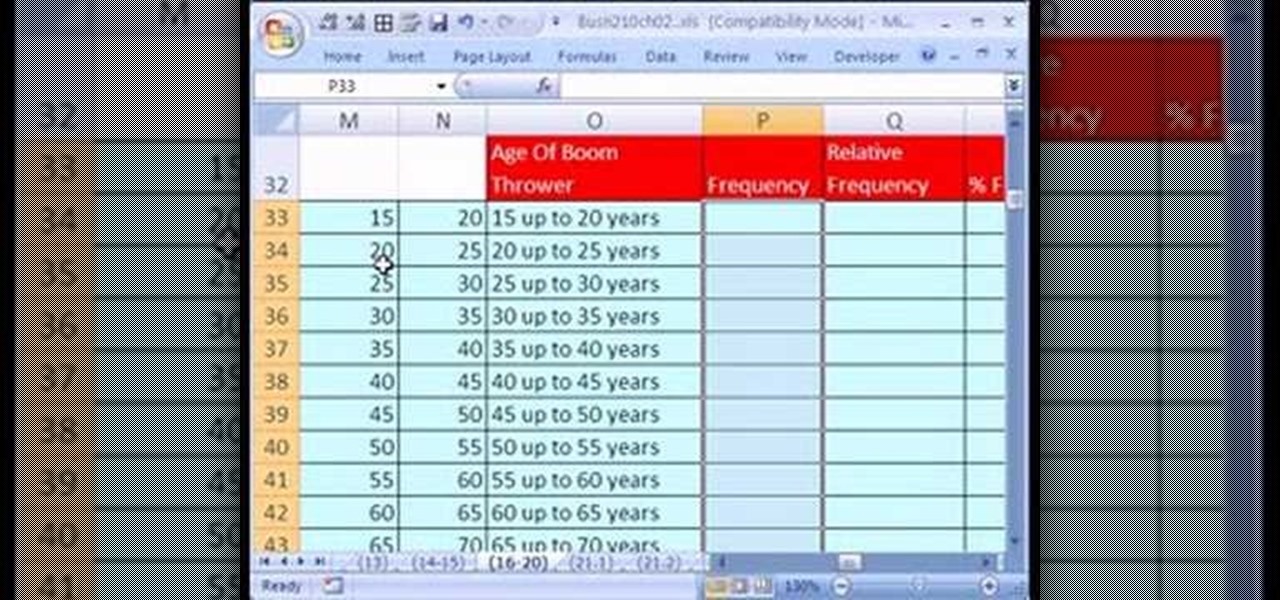
If you use Microsoft Excel on a regular basis, odds are you work with numbers. Put those numbers to work. Statistical analysis allows you to find patterns, trends and probabilities within your data. In this MS Excel tutorial from everyone's favorite Excel guru, YouTube's ExcelsFun, the 21st installment in his "Excel Statistics" series of free video lessons, you'll learn how to build labels and counting formulas for a frequency distribution.

If you use Microsoft Excel on a regular basis, odds are you work with numbers. Put those numbers to work. Statistical analysis allows you to find patterns, trends and probabilities within your data. In this MS Excel tutorial from everyone's favorite Excel guru, YouTube's ExcelsFun, the 87th installment in his "Excel Statistics" series of free video lessons, you'll learn how to use NORMSINV to test a hypothesis with population standard deviation (sigma) known and proportions.

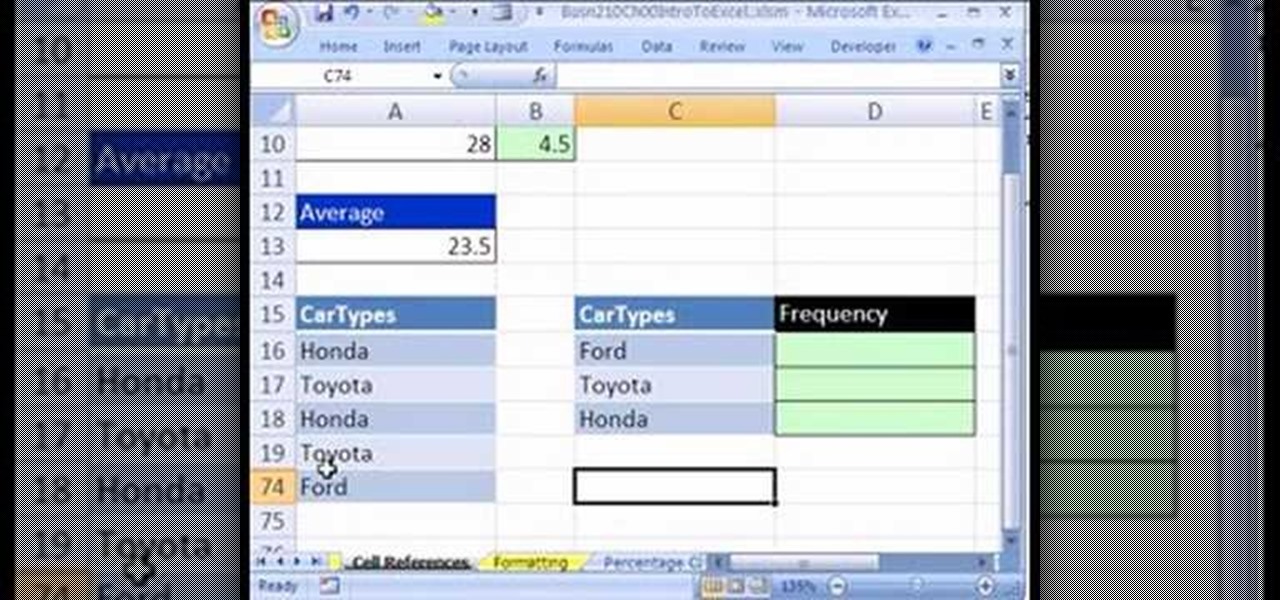
If you use Microsoft Excel on a regular basis, odds are you work with numbers. Put those numbers to work. Statistical analysis allows you to find patterns, trends and probabilities within your data. In this MS Excel tutorial from everyone's favorite Excel guru, YouTube's ExcelsFun, the 5th installment in his "Excel Statistics" series of free video lessons, you'll learn how to use relative and absolute cell references to save time when writing formulas.

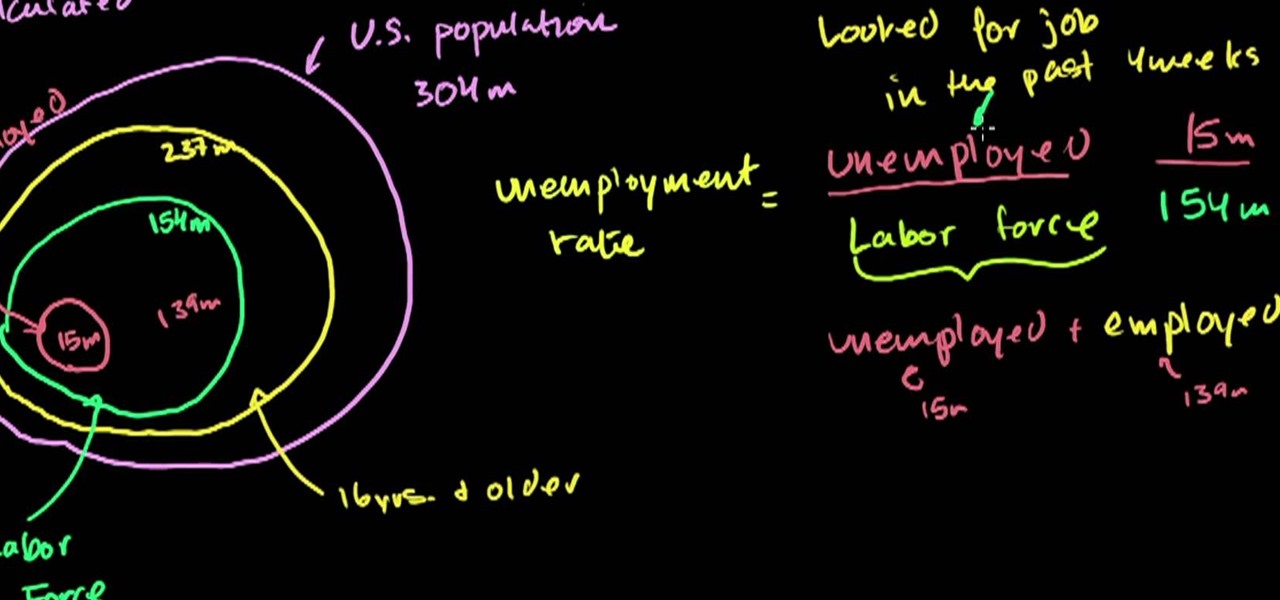
From Ramanujan to calculus co-creator Gottfried Leibniz, many of the world's best and brightest mathematical minds have belonged to autodidacts. And, thanks to the Internet, it's easier than ever to follow in their footsteps (or just study for that next big test). With this installment from Internet pedagogical superstar Salman Khan's series of free math tutorials, you'll learn how to calculate the US unemployment rate given the raw data.

From Ramanujan to calculus co-creator Gottfried Leibniz, many of the world's best and brightest mathematical minds have belonged to autodidacts. And, thanks to the Internet, it's easier than ever to follow in their footsteps (or just study for that next big test). With this installment from Internet pedagogical superstar Salman Khan's series of free math tutorials, you'll learn how to create a simple histogram chart.

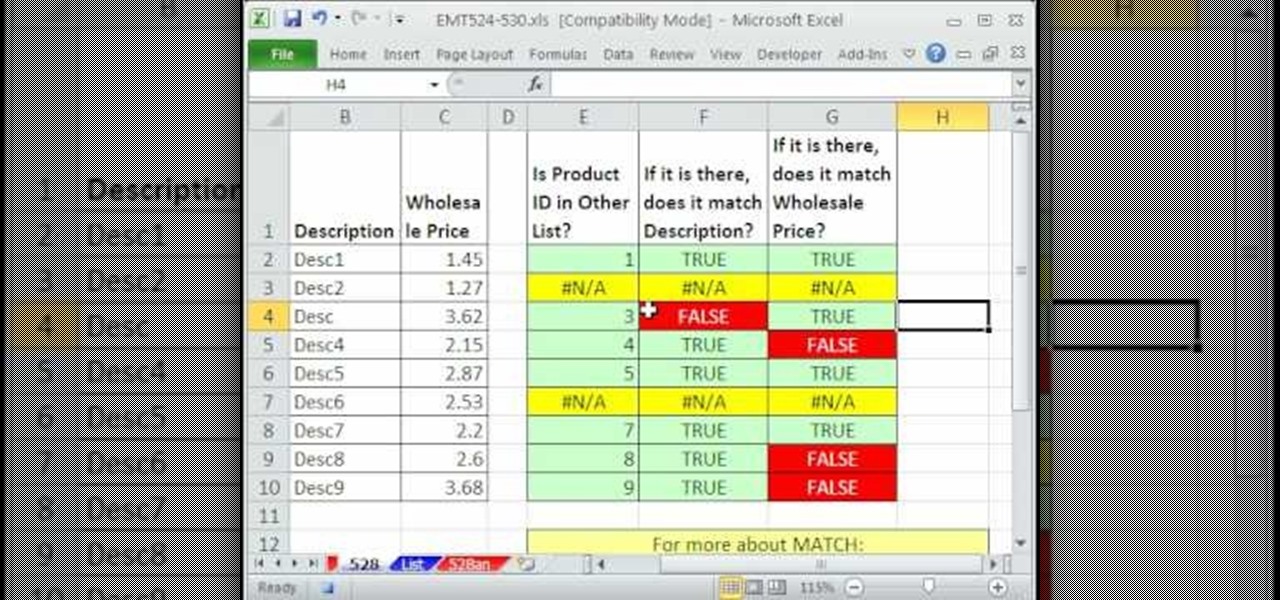
New to Microsoft Excel? Looking for a tip? How about a tip so mind-blowingly useful as to qualify as a magic trick? You're in luck. In this MS Excel tutorial from ExcelIsFun, the 528th installment in their series of digital spreadsheet magic tricks, you'll learn how to check two data sets (lists & tables) to see if there are discrepancies using the MATCH and VLOOKUP functions.


