The volume is maxed out, but that doesn't stop me from hitting the volume key on my Nexus 7 in hopes that it will magically get louder. This happens to me everyday as I watch videos or play music. The simple fact is that a Nexus 7 tablet just doesn't get very loud. At least, not loud enough for me.

This is the first installment in a new series that I am calling "Hacker Hurdles." These are things, methods, techniques that make our job as hackers more challenging and difficult. Don't misunderstand me, these items don't make our task impossible, but rather more challenging and, therefore, more gratifying when we are successful. One of the most important new hurdles for hackers is DEP and ASLR. Data Execution Prevention (DEP) and Address Space Layout Randomization (ASLR) are designed to pre...

As much as it pained me to lose lock screen widget functionality, I just can't bare changing out the sleek-looking lock screen that's standard on the OnePlus One. The latest OTA introduced a new transparent theme, and while that's a welcomed improvement, I need more options!

Google makes backing up your contacts, messages, and Wi-Fi passwords extremely easy, but leaves you out in the cold when it comes the data on your internal storage. With most Android devices now lacking SD card support, when you unlock your bootloader or do a factory reset, you're stuck having to back up everything to your computer beforehand.

When you're not using your phone, it doesn't make much sense that it would be wasting power by maintaining an internet connection for the inside of your pocket or purse. Well, perhaps you need a little bit of intermittent data here and there so that apps can update themselves in the background and still post notifications, but it doesn't need to be constant.

What happens when you accidentally delete a photo or video from your iPad or iPhone? How do you get it back?

There are a lot of mods for your Nexus 7 when it comes to improving and streamlining its overall functionality. You could add custom swipe gestures, conserve battery power, and even run multiple apps at the same time.
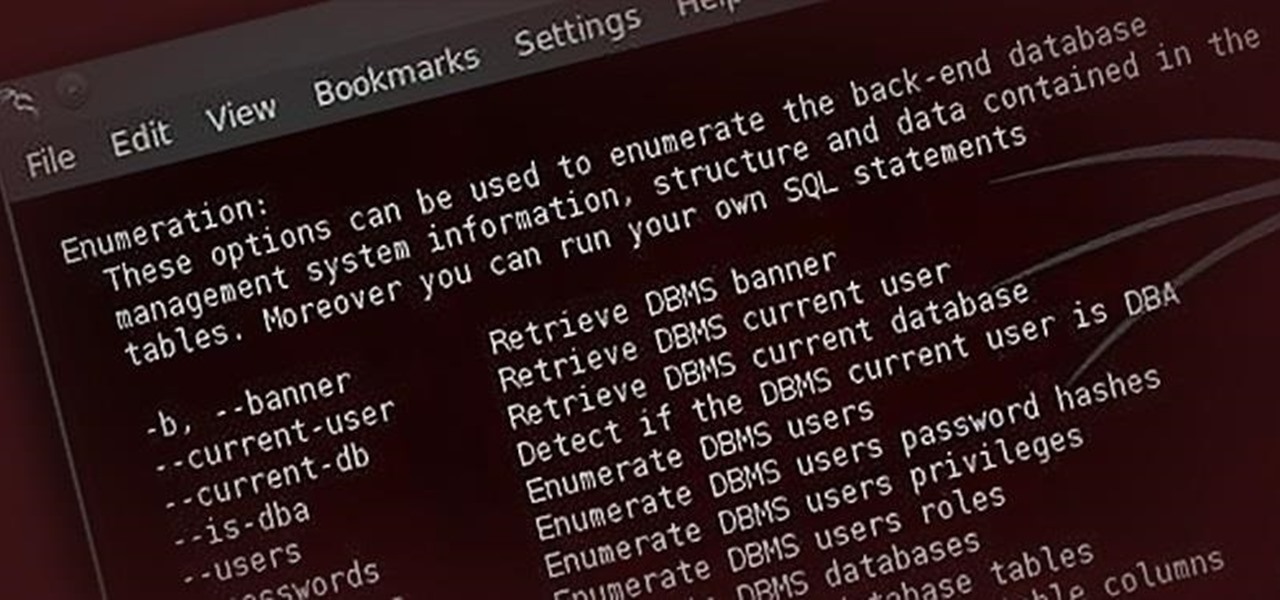
Welcome back, my greenhorn hackers! In a previous tutorial on hacking databases, I showed you how to find online databases and then how to enumerate the databases, tables, and columns. In this guide, we'll now exfiltrate, extract, remove—whatever term you prefer—the data from an online database.
Thanks to its dedicated ImageChip, the HTC One has one of the best cameras out of all the smartphones currently on the market. Their branded UltraPixel Camera can take full resolution photos while shooting video, has superior auto-focusing, and provides great overall quality for everything from low-light to action shots.
If you watched Samsung's Unpacked 2013 live last month, where they announced the new Galaxy S4, you probably sat through this awkward skit: This was Samsung's way of introducing their new translation software, dubbed S Translator. In the skit, the backbacking American traveler in Shanghai typed his question in English, and the phone spoke it aloud in Chinese. The other man replied in Chinese, and the app translated the message back into English. Live conversation translation aside, the app ca...
As much as I love my Samsung Galaxy S3, I'm always on the lookout for cool features I can borrow from other smartphones. One of the most recent "borrowed" features I've added to my S3 is the Galaxy Note 2's smart rotation feature, which uses the front camera to detect my face-to-screen angle, which then rotates my screen accordingly. But the S3 already comes packed with some awesome features, as well as some less-than-stellar ones. One of these less-than-stellar features is the task manager, ...
Yesterday, Bryan Clark pointed out a new option on Verizon's privacy settings that gives new customers 30 days to opt out of a data sharing program that gives advertisers information on basically everything you're doing on your new iPhone (or any other smartphone).
If you want to increase your privacy and prevent iPhone apps from gaining access to data containing your location, take a look at this tutorial on turning off the location services in the settings menu on Apple's iPhone 3G devices and above.
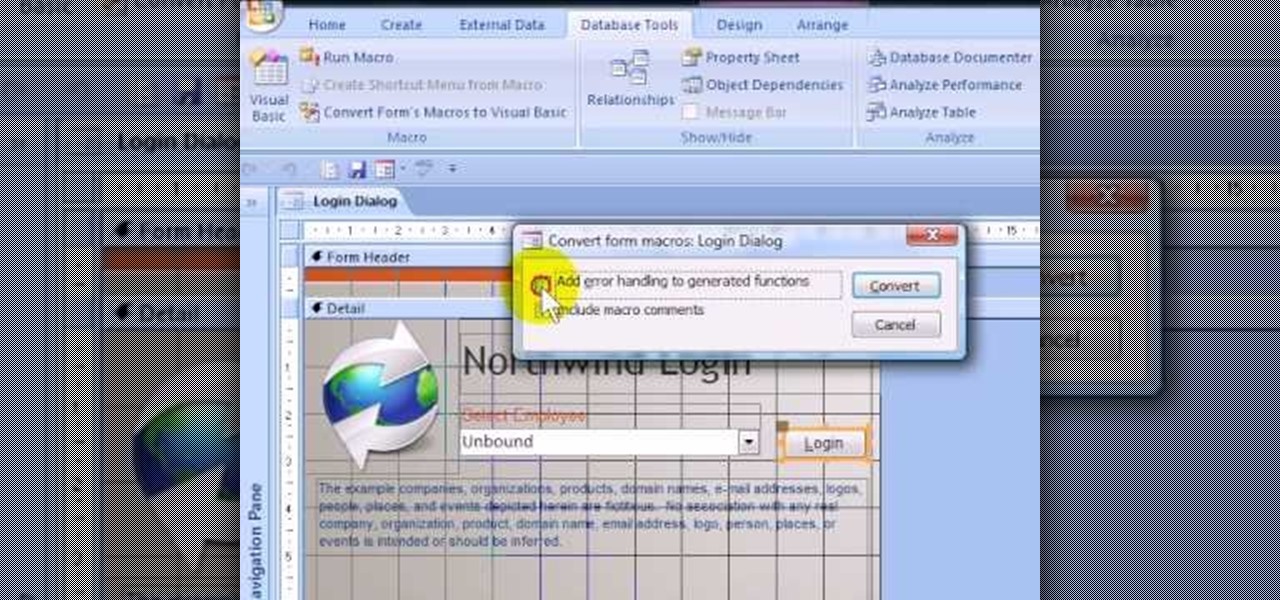
If you want to password restrict some of your data, or just want to know who is doing what in Microsoft Access 2007, you will want to set up a login form for MS Access 2007. This is an easy procedure, and you can create one yourself with just a basic understanding of the structure for MS Access. Watch this video, and Uncle Gizmo will show you how to do a login form and several other forms for MS Access.
Learn the secret to running the FaceTime video phone call app over your iPhone 4's data plan with this hacker's how-to. For all of the juicy details, and to get started making video calls over cellular internet on your own Apple iPhone 4, watch this video tutorial.
If you're having problems with your iPad, sometimes restoring it to factory settings is enough to get it working again. This will erase all your data, so make sure you back up everything. Then you can use these two separate methods to restore your iPad.
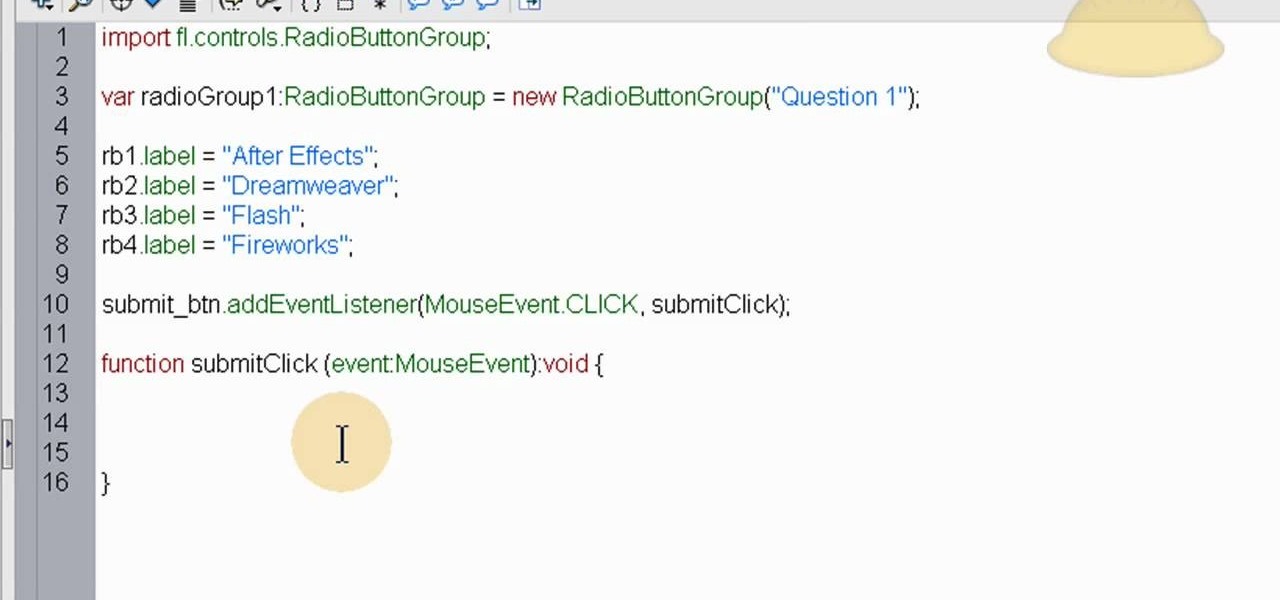
The quiz - a popular and pervasive form of content for websites. They can be just for fun, or to help you collect demographic data on visitors to your website. This tutorial shows you how to use radio buttons to write quizzes, tests and other similar forms in Adobe Flash CS3.
In this clip, you'll learn how to view graphs of statistical data from around the world with Gapminder.com. The website, you'll find, is diverting, often thought-provoking, and easy to use. For more information, including detailed instructions on how to use the site yourself, watch this video tutorial from the folks at Tekzilla.
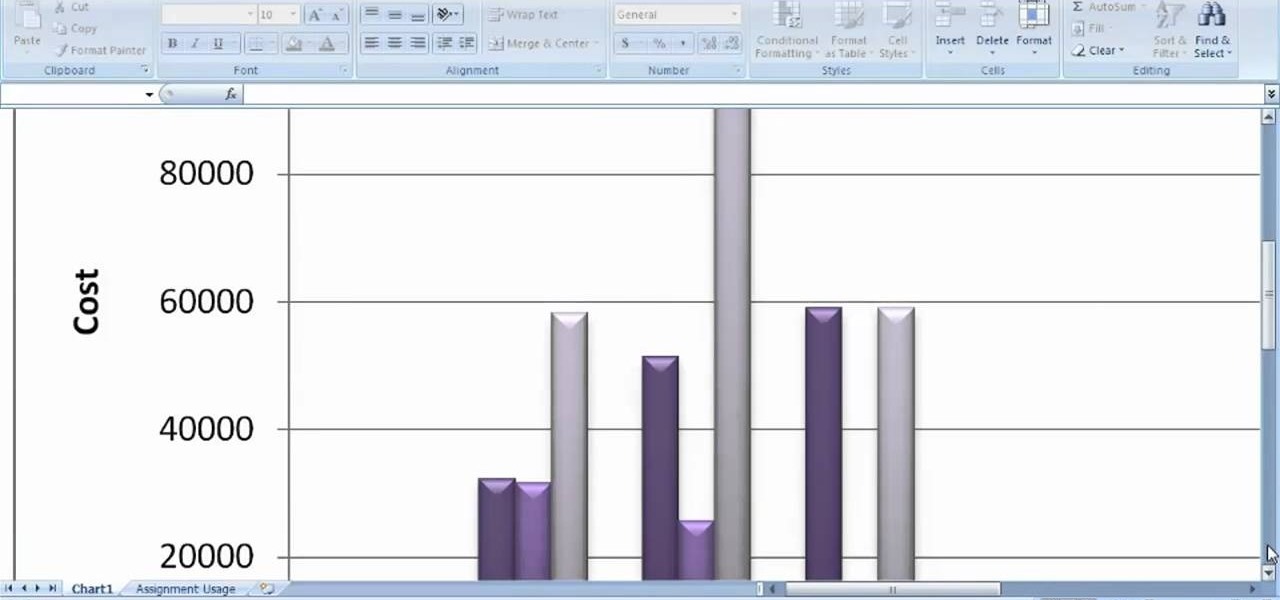
In this clip, you'll learn how to visual data with charts and graphs in MS Project 2010. Whether you're new to Microsoft's popular project management application or are just looking to better acquaint yourself with the Project 2010 workflow, you're sure to benefit from this free video software tutorial from Lynda. For more information, including detailed, step-by-step instructions, take a look.
Fring is an app availble through the Apple store which will let you use your iPhone 4 to conduct FaceTime video chats over 3G. You can also use Skype or other chat programs with Fring. Make sure you pay attention to how much data you're using, it's easy to go over!
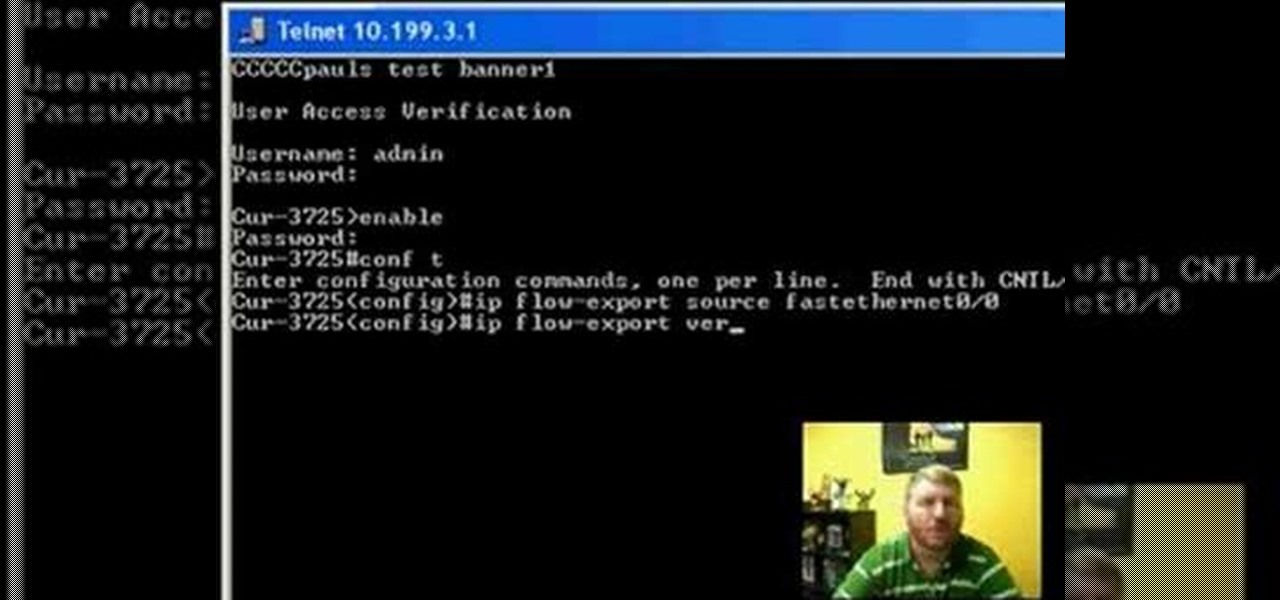
Netflow technology allows you to monitor web traffic to your website - find out who comes to your site, where they're coming from and where they go afterwards. You can configure a Cisco router manually to monitor netflow going through the router.
You keep all kinds of important and sensitive information and data on your computer, and if your hard drives crashes, you're done for… unless you've backed it up. CNET has some "Insider Secrets" on how you can backup your system with an external hard drive, network-attached storage, and online services.
TrueCrypt is a free open-source program for encrypting data and it's excellent for securing hard drives, but it also has the ability to hide a secret operating system inside another operating system. CNET shows you how this "insider secret" operating system is created. This operating system will be impossible to prove to people like the Feds.
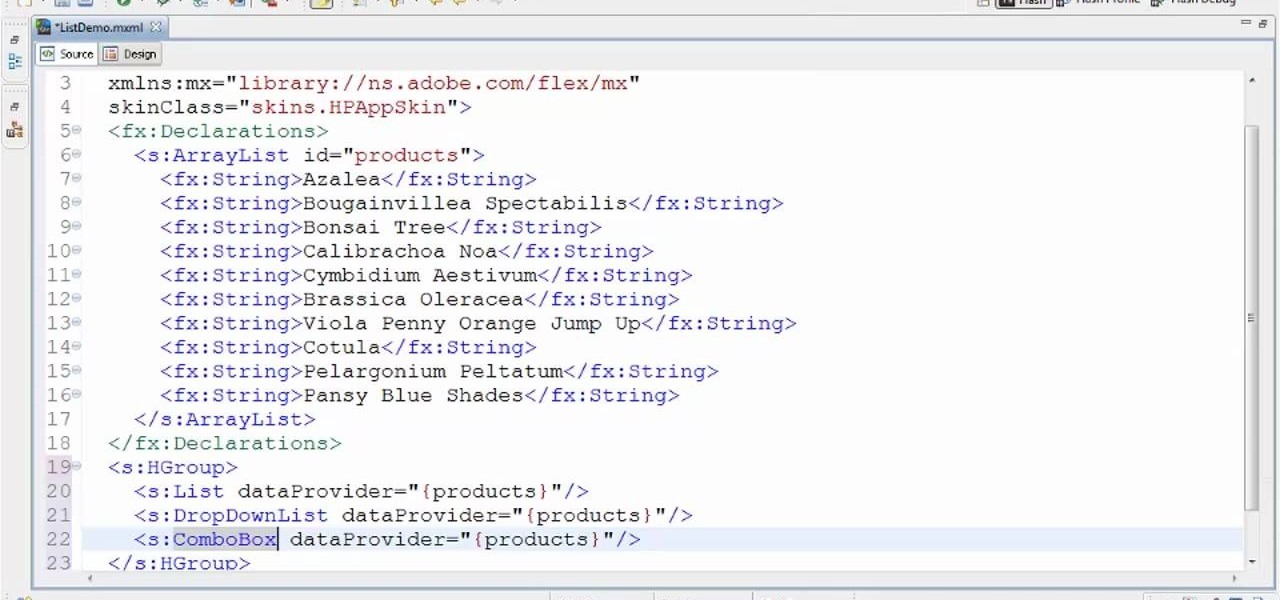
Need a introduction to the List and DropDownList Flash Builder data-aware controls within Adobe Flash Builder 4? This clip will show you what to do. Whether you're new to Adobe's popular Flash IDE (previously titled Adobe Flex Builder) or simply wish to become better acquainted with the program, you're sure to find benefit in this free video software tutorial. For more information, including specific, step-by-step instructions, take a look.
New to Microsoft Excel? Looking for a tip? How about a tip so mind-blowingly useful as to qualify as a magic trick? You're in luck. In this MS Excel tutorial from ExcelIsFun, the 593rd installment in their series of digital spreadsheet magic tricks, you'll learn how to add data validation to allow only Monday dates in a cell using the custom option and the WEEKDAY function.
If you use Microsoft Excel on a regular basis, odds are you work with numbers. Put those numbers to work. Statistical analysis allows you to find patterns, trends and probabilities within your data. In this MS Excel tutorial from everyone's favorite Excel guru, YouTube's ExcelsFun, the 45th installment in his "Excel Statistics" series of free video lessons, you'll learn how to see how to calculate a z-score.
If you use Microsoft Excel on a regular basis, odds are you work with numbers. Put those numbers to work. Statistical analysis allows you to find patterns, trends and probabilities within your data. In this MS Excel tutorial from everyone's favorite Excel guru, YouTube's ExcelsFun, the 35.2nd installment in his "Excel Statistics" series of free video lessons, you'll learn how to use Excel's GEOMEAN function to find geometric mean.
If you use Microsoft Excel on a regular basis, odds are you work with numbers. Put those numbers to work. Statistical analysis allows you to find patterns, trends and probabilities within your data. In this MS Excel tutorial from everyone's favorite Excel guru, YouTube's ExcelsFun, the 40th installment in his "Excel Statistics" series of free video lessons, you'll learn how to calculate range & interquartile range for variability using the MAX, MIN, QUARTILE functions.
If you use Microsoft Excel on a regular basis, odds are you work with numbers. Put those numbers to work. Statistical analysis allows you to find patterns, trends and probabilities within your data. In this MS Excel tutorial from everyone's favorite Excel guru, YouTube's ExcelsFun, the 86th installment in his "Excel Statistics" series of free video lessons, you'll learn how to construct confidence intervals for proportions using NORMSINV function and other formulas.
If you use Microsoft Excel on a regular basis, odds are you work with numbers. Put those numbers to work. Statistical analysis allows you to find patterns, trends and probabilities within your data. In this MS Excel tutorial from everyone's favorite Excel guru, YouTube's ExcelsFun, the 87th installment in his "Excel Statistics" series of free video lessons, you'll learn how to calculate sample size (n) for confidence intervals.
If you use Microsoft Excel on a regular basis, odds are you work with numbers. Put those numbers to work. Statistical analysis allows you to find patterns, trends and probabilities within your data. In this MS Excel tutorial from everyone's favorite Excel guru, YouTube's ExcelsFun, the 19th installment in his "Excel Statistics" series of free video lessons, you'll learn how to group categories in a frequency distribution with a formula (2 COUNTIF) and the pivot table (PivotTable) grouping fea...
If you use Microsoft Excel on a regular basis, odds are you work with numbers. Put those numbers to work. Statistical analysis allows you to find patterns, trends and probabilities within your data. In this MS Excel tutorial from everyone's favorite Excel guru, YouTube's ExcelsFun, the 35th installment in his "Excel Statistics" series of free video lessons, you'll learn how to calculate weighted and geometric means and see how to use the GEOMEAN function.
If you use Microsoft Excel on a regular basis, odds are you work with numbers. Put those numbers to work. Statistical analysis allows you to find patterns, trends and probabilities within your data. In this MS Excel tutorial from everyone's favorite Excel guru, YouTube's ExcelsFun, the 33rd installment in his "Excel Statistics" series of free video lessons, you'll learn how to use the AVEARGE, MEDIAN, MODE, PERCENTILE, QUARTILE and PERCENTILERANK functions to measure location.
If you use Microsoft Excel on a regular basis, odds are you work with numbers. Put those numbers to work. Statistical analysis allows you to find patterns, trends and probabilities within your data. In this MS Excel tutorial from everyone's favorite Excel guru, YouTube's ExcelsFun, the 4th installment in his "Excel Statistics" series of free video lessons, you'll learn how to create a frequency table and percentage frequency table using a Pivot Table (PivotTable).
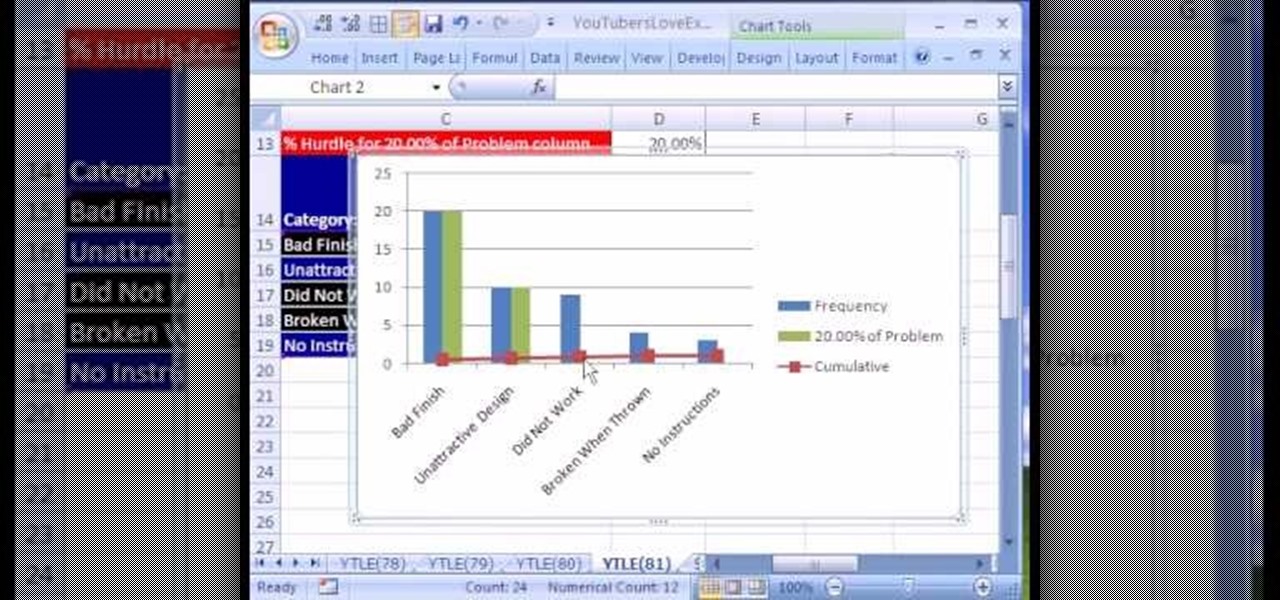
Love Microsoft Excel? This clip contains a tip that just might induce you to. With this free video tutorial from ExcelIsFun, the 81st installment of his "YouTubers Love Excel" or YTLE series of free video MS Excel lessons, you'll learn how to add conditional formatting to a chart by creating a new column of data with a formula.
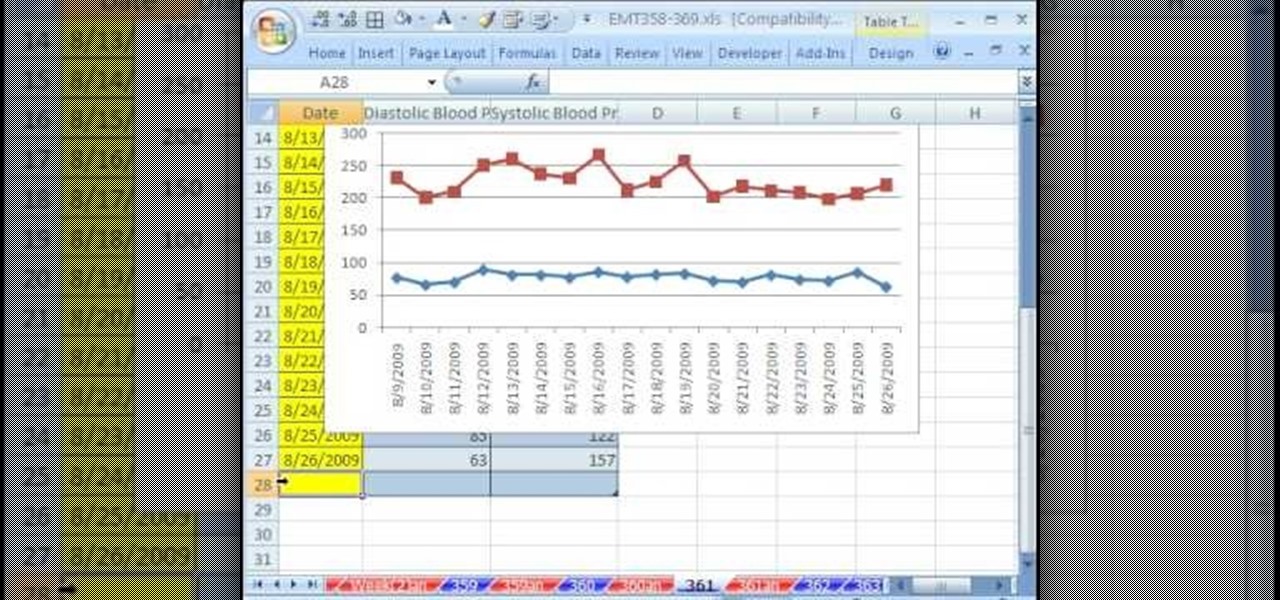
New to Microsoft Excel? Looking for a tip? How about a tip so mind-blowingly useful as to qualify as a magic trick? You're in luck. In this MS Excel tutorial from ExcelIsFun, the 361st installment in their series of digital spreadsheet magic tricks, you'll learn how to create a dynamic two data series line chart for blood pressures.
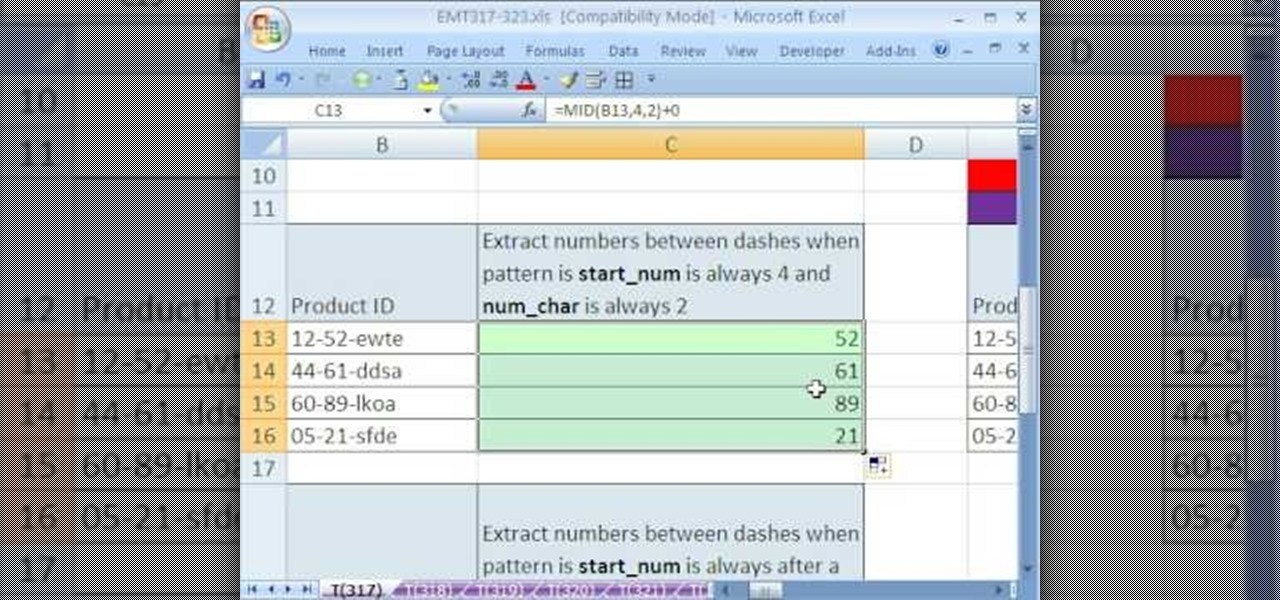
New to Microsoft Excel? Looking for a tip? How about a tip so mind-blowingly useful as to qualify as a magic trick? You're in luck. In this MS Excel tutorial from ExcelIsFun, the 317th installment in their series of digital spreadsheet magic tricks, you'll learn how to extract data (specifically, a substring from string) using the MID Function.
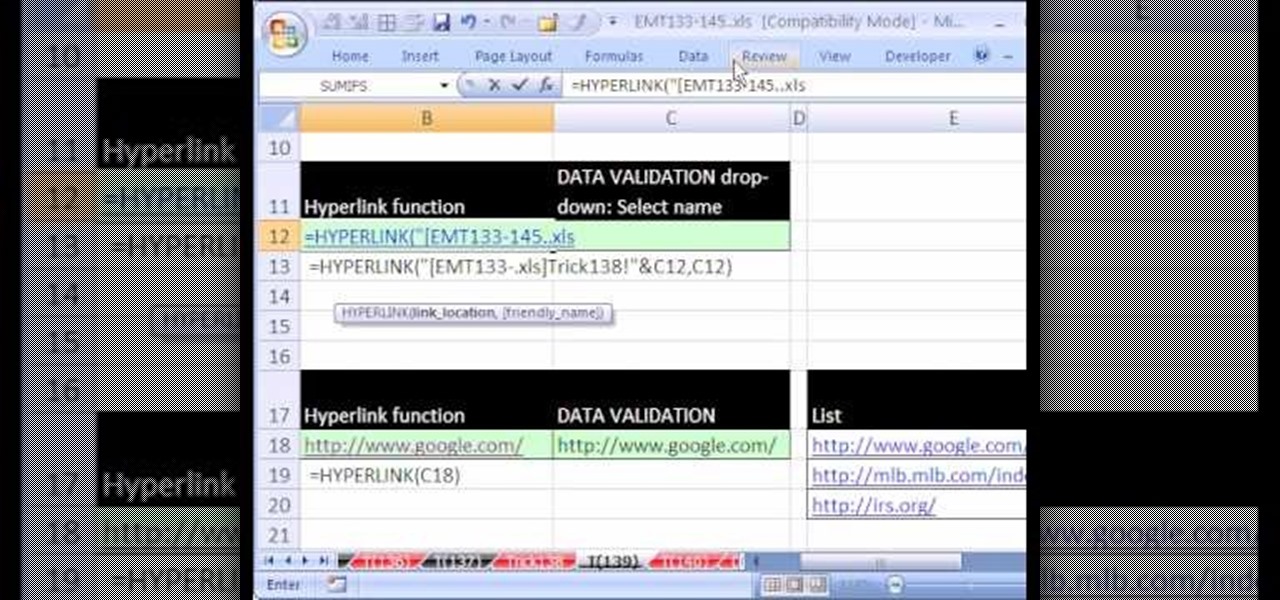
New to Microsoft Excel? Looking for a tip? How about a tip so mind-blowingly useful as to qualify as a magic trick? You're in luck. In this MS Excel tutorial from ExcelIsFun, the 139th installment in their series of digital spreadsheet magic tricks, you'll learn how to use a data validation list drop-down and the hyperlink function to create a list of links.
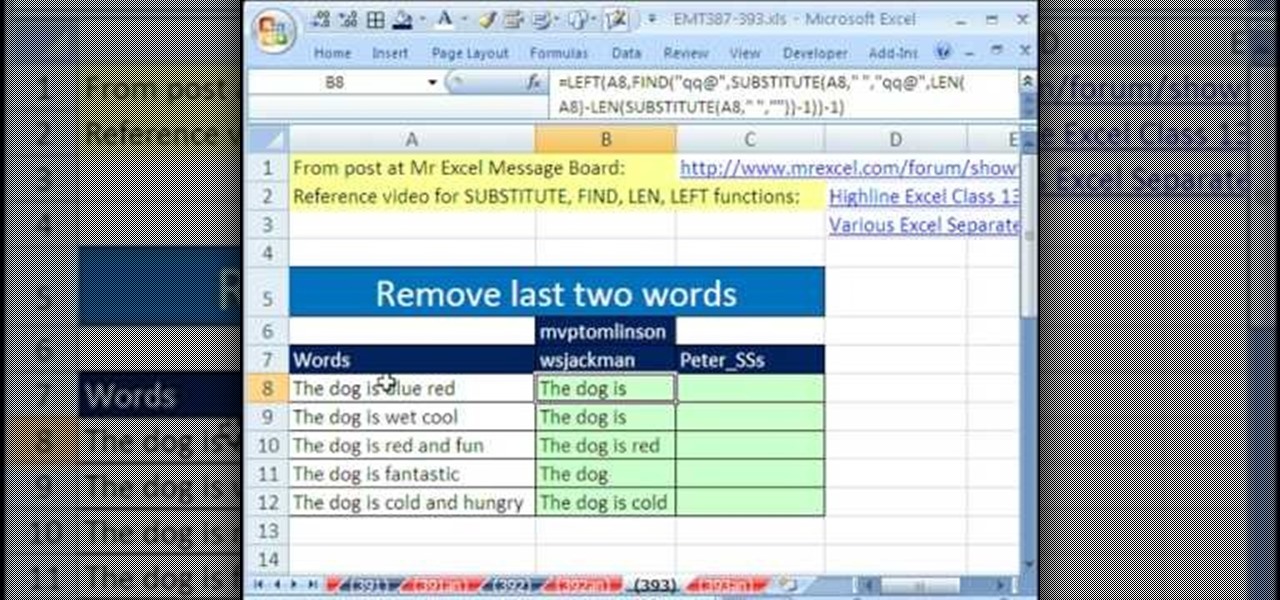
New to Excel? Looking for a tip? How about a tip so mind-blowingly useful as to qualify as a magic trick? You're in luck. With this video tutorial from ExcelIsFun, the 393rd installment in their series of digital spreadsheet video tutorials, you'll learn how to remove the last two words from column of data with the LEN, SUBSTITUTE, FIND, REPT, RIGHT and TRIM functions.
Before you sell your Blackberry on eBay you may want to erase all personal data on the device. This video will show you exactly how to reset your Blackberry and erase all personal information.