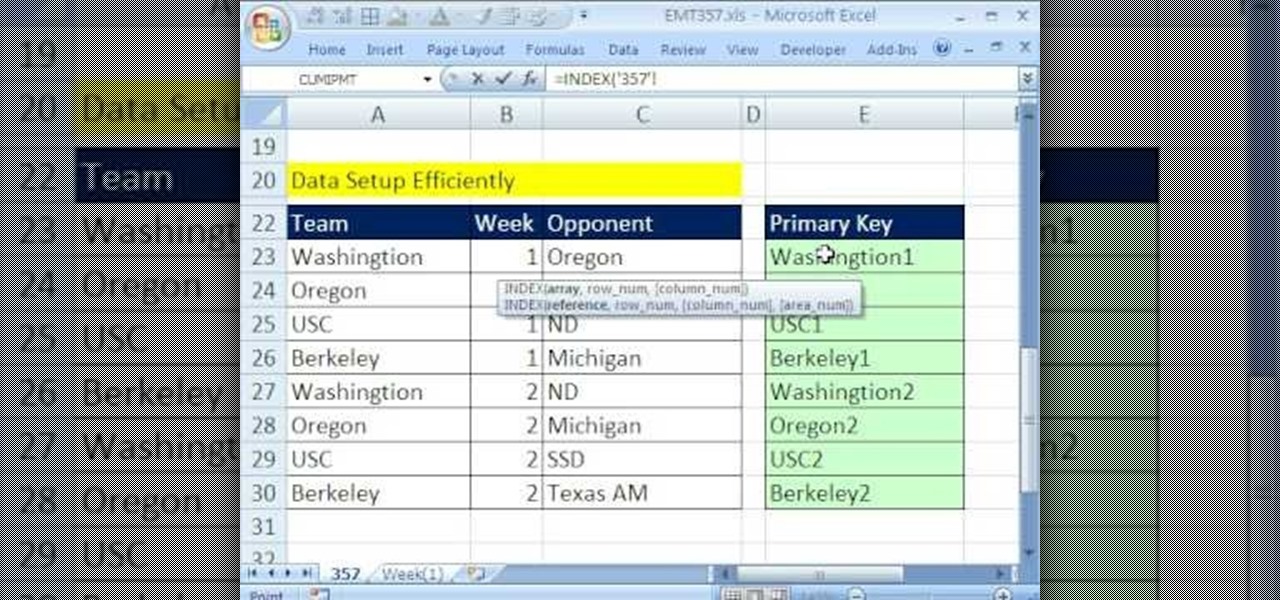
New to Microsoft Excel? Looking for a tip? How about a tip so mind-blowingly useful as to qualify as a magic trick? You're in luck. In this MS Excel tutorial from ExcelIsFun, the 357th installment in their series of digital spreadsheet magic tricks, you'll learn how to pull data from individual sheets to a single master sheet given improper data setup.
Your data is your most important asset on your computer. Learn how to keep your data safe using Carbonite.com
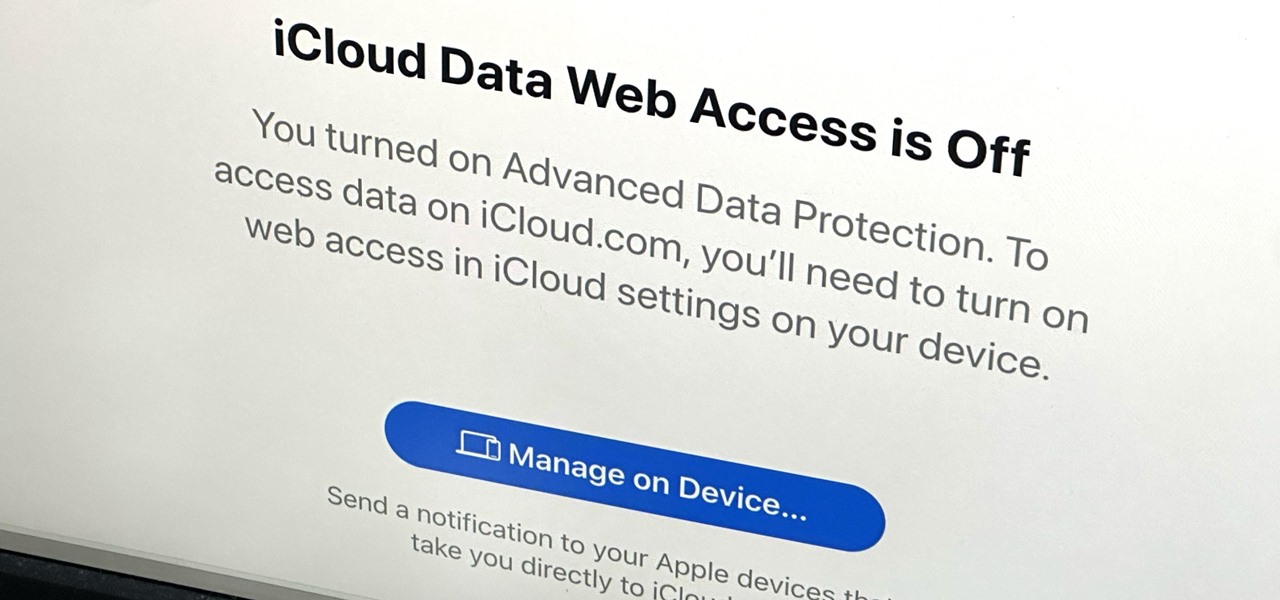
If you can't access your iCloud data such as emails, contacts, calendars, photos, notes, reminders, files, and other documents via a web browser on untrusted devices, like one at a library or friend's house, there's an easy way to regain access.

Before the internet, acquiring enough data to analyze was challenging. Now we have the opposite problem: a deluge of data makes trying to sort through it nearly impossible. That's where data science comes in.

Few things are more important than being well-versed in data analytics and interpretation when it comes to succeeding in today's increasingly data-driven world. As a data scientist, these skills are the key to a high-paying career. For hackers, there's no better way to defeat the enemy than to become the enemy.
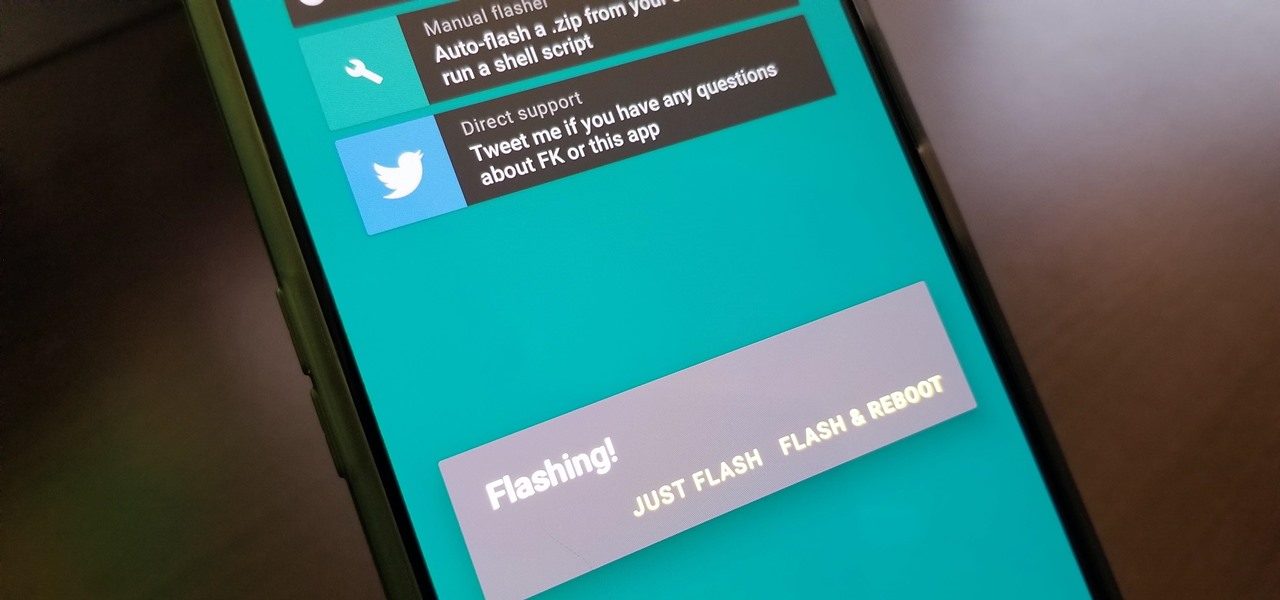
There once was a time in the Android rooting scene where we couldn't rely on using a custom recovery for all of our modding needs. Manual file flashing was very popular in the early days of Android before custom recoveries started taking over. With the rise of TWRP, it seemed like there was almost no need for manual file flashers; however, they appear to be making a welcomed return in a big way.

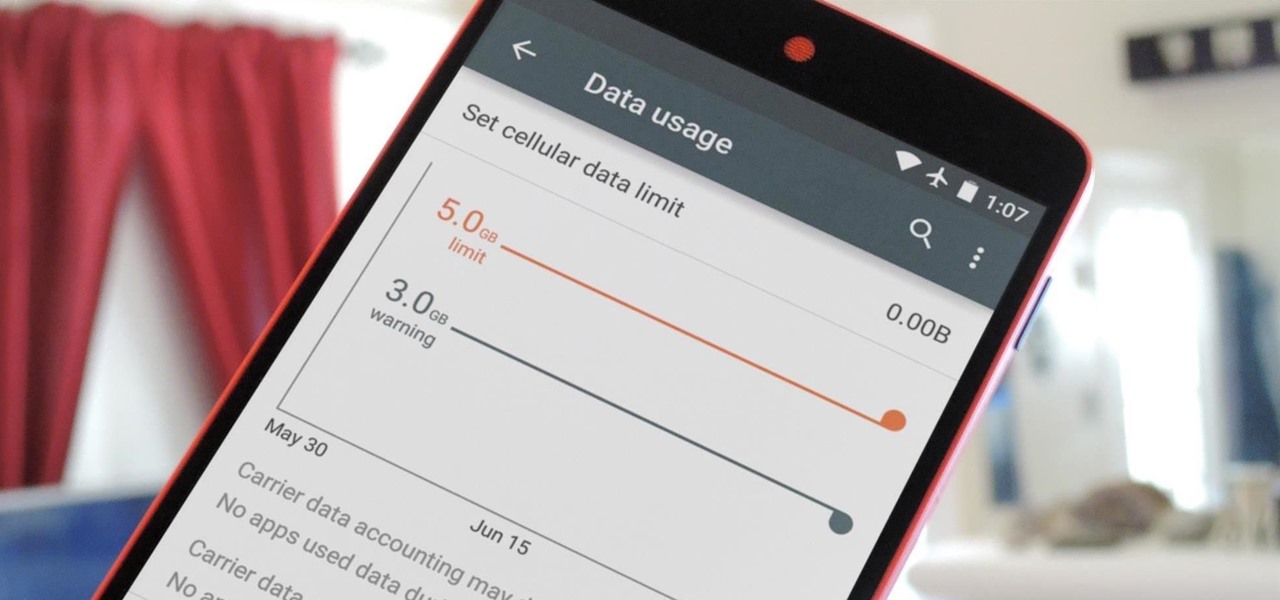
Mobile data is expensive. The internet connection that comes with your cell phone plan is generally limited to a certain amount of gigabytes that can be downloaded before your monthly cap kicks in, at which point you run the risk of incurring costly overage fees.
I've been involved in the Android scene for a very long time and have grown to develop a love/hate relationship with CyanogenMod. While I do like the stability they offer in their custom ROMs, they don't always include the flashy features on top of their vanilla Android base.
Whether you're just getting your first Android, or are already on your fifth annual cycle of picking up the latest flagship, there is always the question of what to do after booting up your device for the first time.
Ever watched Netflix on your phone only to realize an hour later that you forgot to turn Wi-Fi on? That's a whole lot of data used.
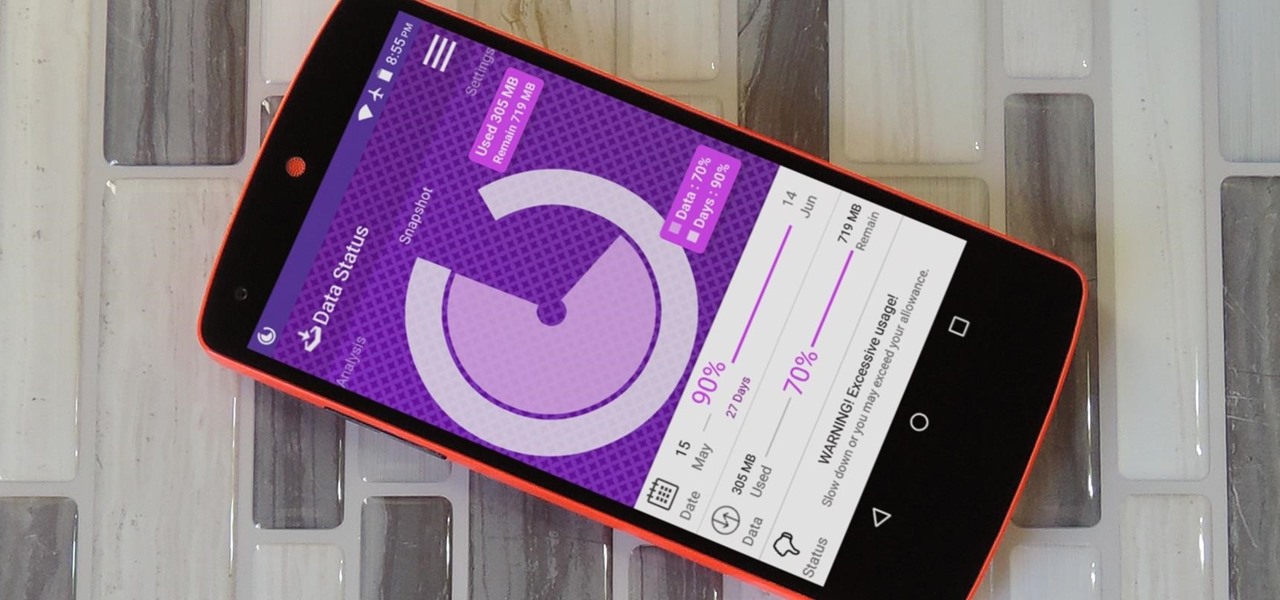
Amazingly enough, some of us still have to worry about exceeding our monthly mobile data limits. You'd figure carriers would have given the customers what they want by now by offering truly unlimited plans, but with two conglomerates sitting atop the U.S. cellular market with fat pocketbooks that make for limitless lobbying, they can basically do whatever they want.
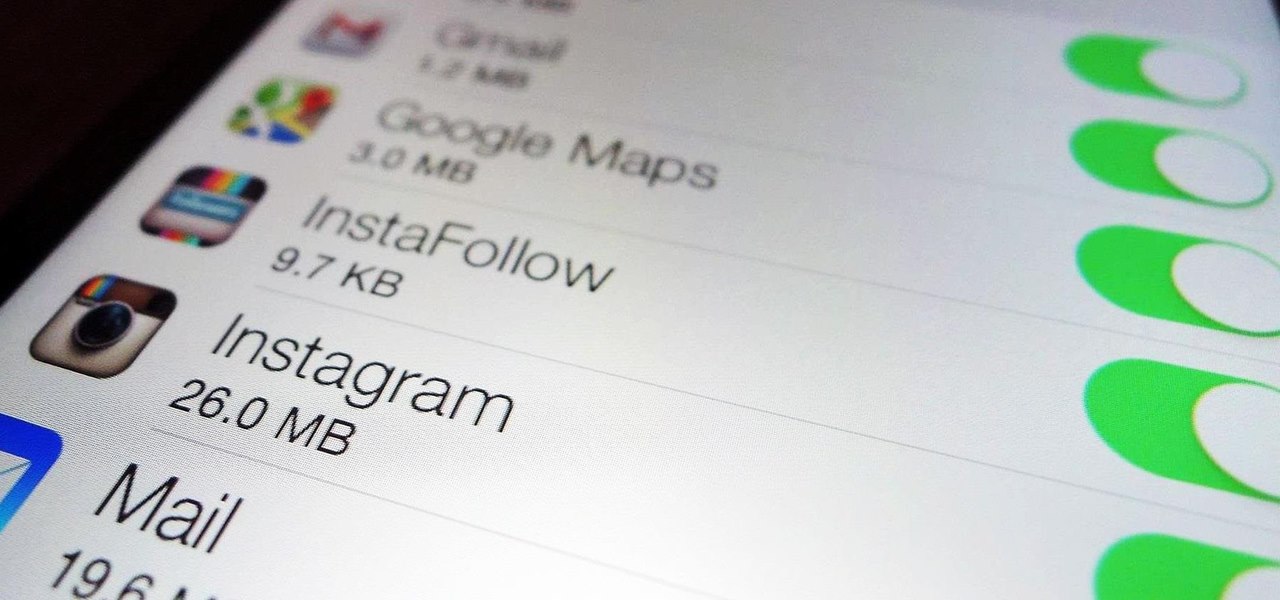
Oops... did you forget to connect to a Wi-Fi network before streaming HBO GO on your iPhone? While those episodes of The Wire may have been absolutely life-changing, your three-digit cellular bill is definitely going to hit you a little harder.
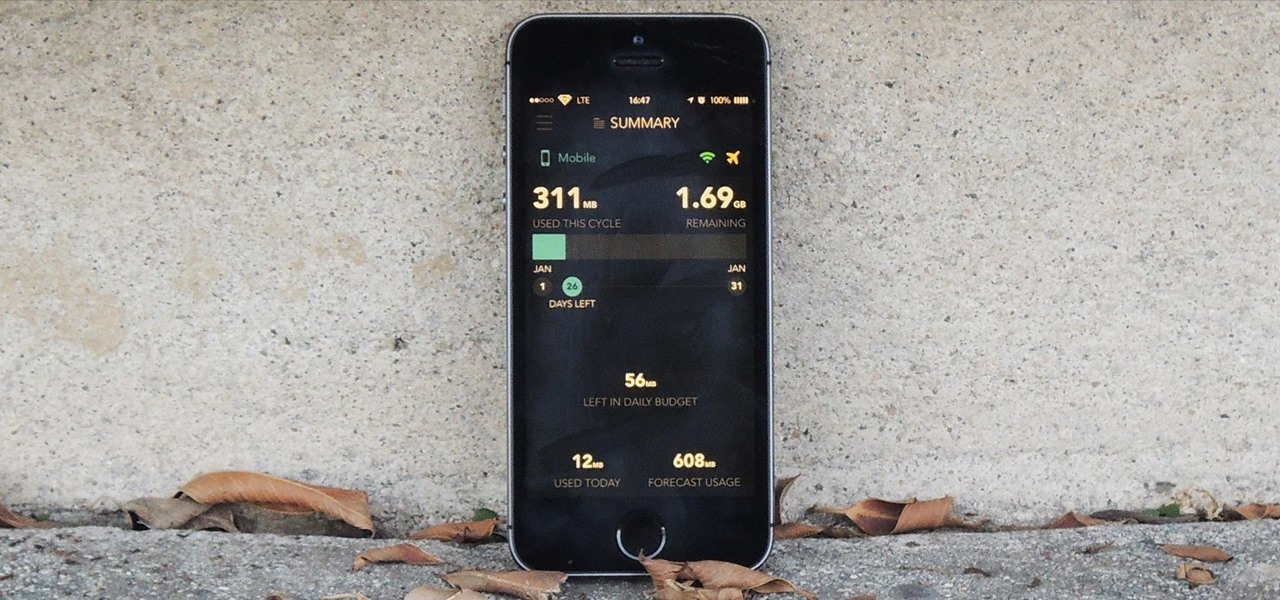
With the majority of smartphone carriers no longer offering unlimited data plans for the iPhone, monitoring how much mobile data you use is a key element to saving money on your phone bill.
QR codes allow you to quickly and easily store and retrieve data within a single image. Much like barcodes at grocery stores, QR codes are images that can be scanned to discover data, such as an online website URL. Additionally, they can also be created by inputting text data into a QR code generator. Try scanning some of the QR codes in this video with an app on your phone or tablet to see how they work!
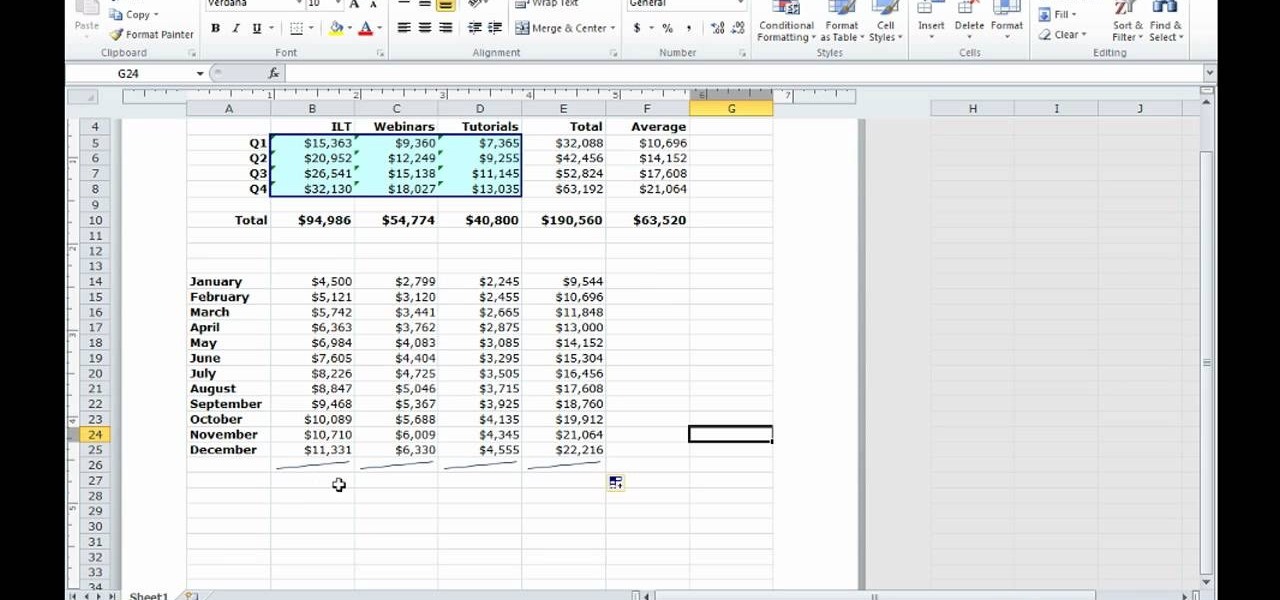
There is a new function in MS Excel 2010 called ‘Sparkline’ which helps you quickly find trends associated with a set of data. To create Sparkline, you can go to ‘Insert’ tab and then select ‘Sparkline’ section and then select the graph type. After you enter the data range and location range, the Sparkline will show up indicating the trend based on the data range you identified earlier. You can change the types and styles of your Sparkline easily. As the video demonstrates, whenever you use E...
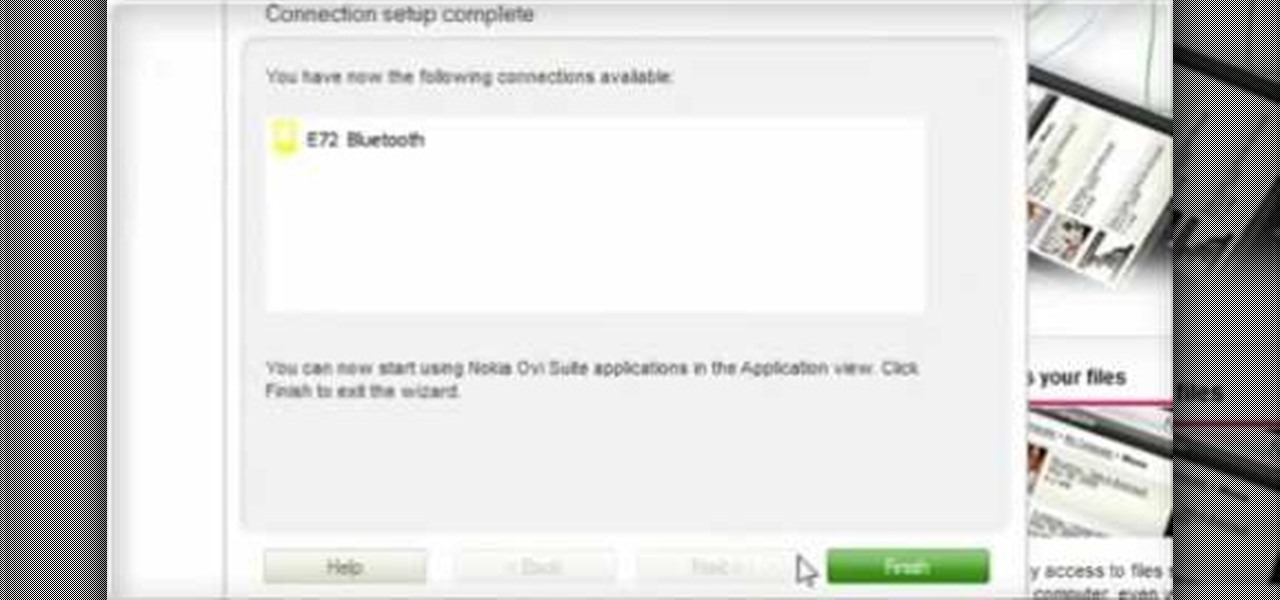
Calendar data, images, sounds, videos, and messages can be easily synchronized between your Nokia Booklet 3G netbook and supported mobile devices and phones when the two are connected using Bluetooth. To find out how to use Nokia's Ovi Suite software to synchronize your data, take a look at this tech support video from the company.
If you've had a hard drive go bad, you know the feeling of helplessness that comes from thinking you may have just lost all your data. This video will show you how to recover data from an Xbox 360 hard drive.
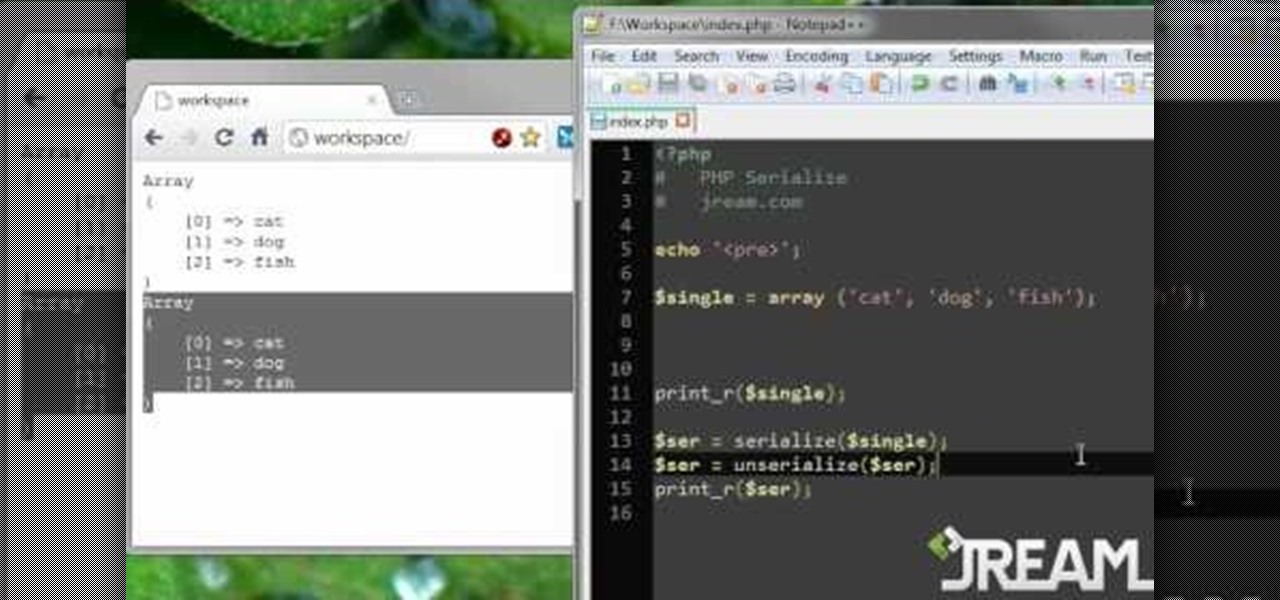
Learn to serialize your data and convert multidimensional arrays into a single string by following along with this informative video from JREAMdesign. Serializing your data essentially compacts it from an expanded array into a string series of values, a very handy PHP feature indeed.
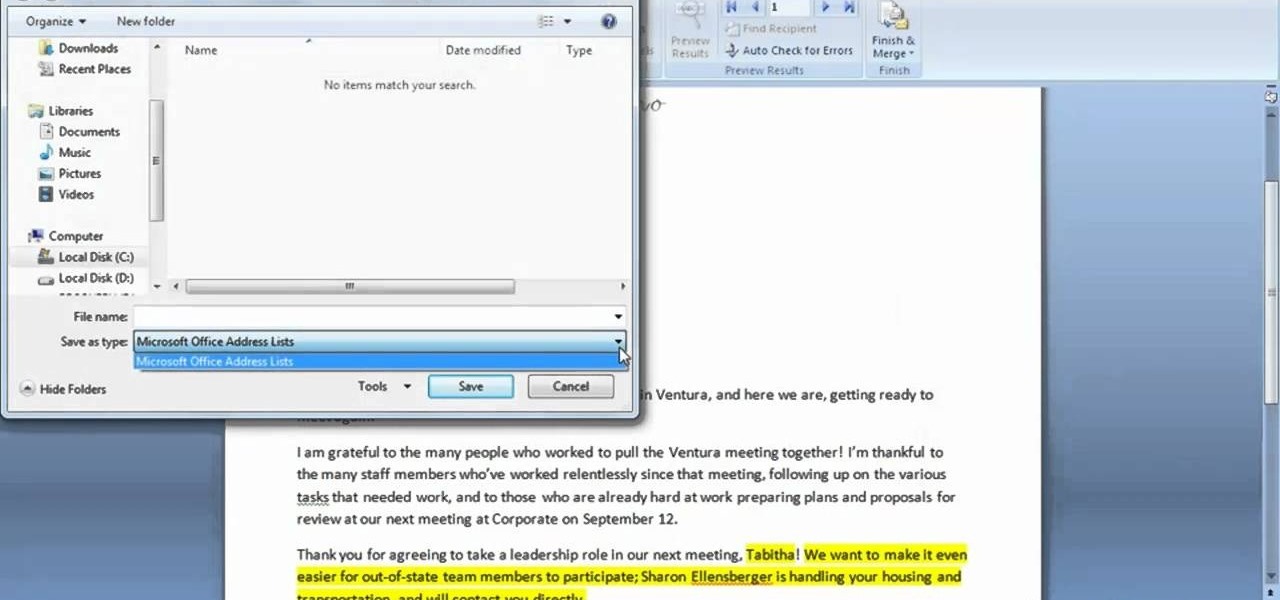
In this clip, you'll learn how to add a new data source when using the Mail Merge tool within MS Word 2007. Whether you're new to Microsoft's popular word processing application or a seasoned professional merely looking to pick up a few new tips and tricks, you're sure to benefit from this video tutorial. For complete instructions, and to get started creating new data sources yourself, take a look.
You can use your Apple product (iPod, iPhone or iPad) to store your data and then send it to a different computer using a wifi connection. You'll need to download the File Sharing program from the Apple store and make a note of the IP address you want to send your data to.
In this tutorial, we learn how to root your G1 or MyTouch 3G with one click. First, go to theunlockr and download the MyTough 3G Root video. Now, go on your phone and click on the settings. Go to applications, then check "unknown sources", then go back and click on "sd card" and un-mount it, then format it. Once the numbers pop up again, it means your card is mounted and formatted. Now, plug your phone in with the USB cable to your computer and mount it. Now, go to the site and download the t...
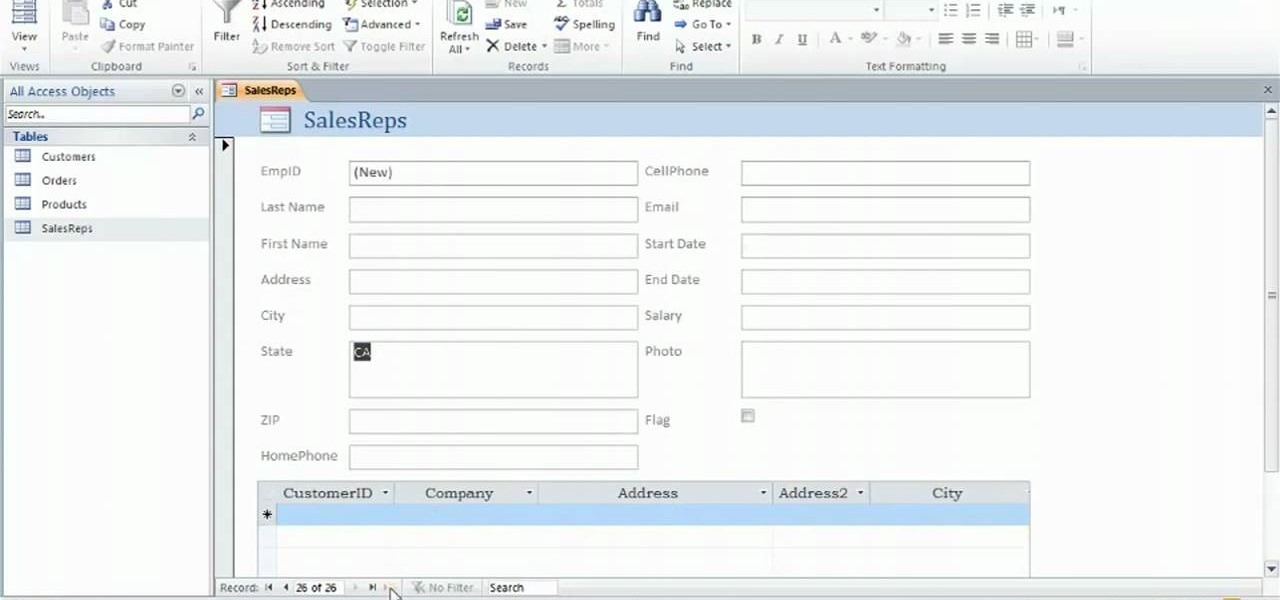
Learn how to create data-entry forms when working in Microsoft Access 2010. Whether you're new to Microsoft's popular database management application or a seasoned MS Office professional just looking to better acquaint yourself with the Access 2010 workflow, you're sure to be well served by this video tutorial. For more information, and to get started using data-entry forms in your own Access projects, watch this free video guide.
Have you ever gotten the error message, "BOOTMGR is missing" on your PC? Well, if you have check out this video. In this tutorial, learn how to remedy and fix this problem in no time.
If you use Microsoft Excel on a regular basis, odds are you work with numbers. Put those numbers to work. Statistical analysis allows you to find patterns, trends and probabilities within your data. In this MS Excel tutorial from everyone's favorite Excel guru, YouTube's ExcelsFun, the 43rd installment in his "Excel Statistics" series of free video lessons, you'll learn how to use the Excel Data Analysis add-in descriptive statistics tool.
If you use Microsoft Excel on a regular basis, odds are you work with numbers. Put those numbers to work. Statistical analysis allows you to find patterns, trends and probabilities within your data. In this MS Excel tutorial from everyone's favorite Excel guru, YouTube's ExcelsFun, the 29th installment in his "Excel Statistics" series of free video lessons, you'll learn how to create quantitative data cross tabulation using a pivot table (PivotTable).
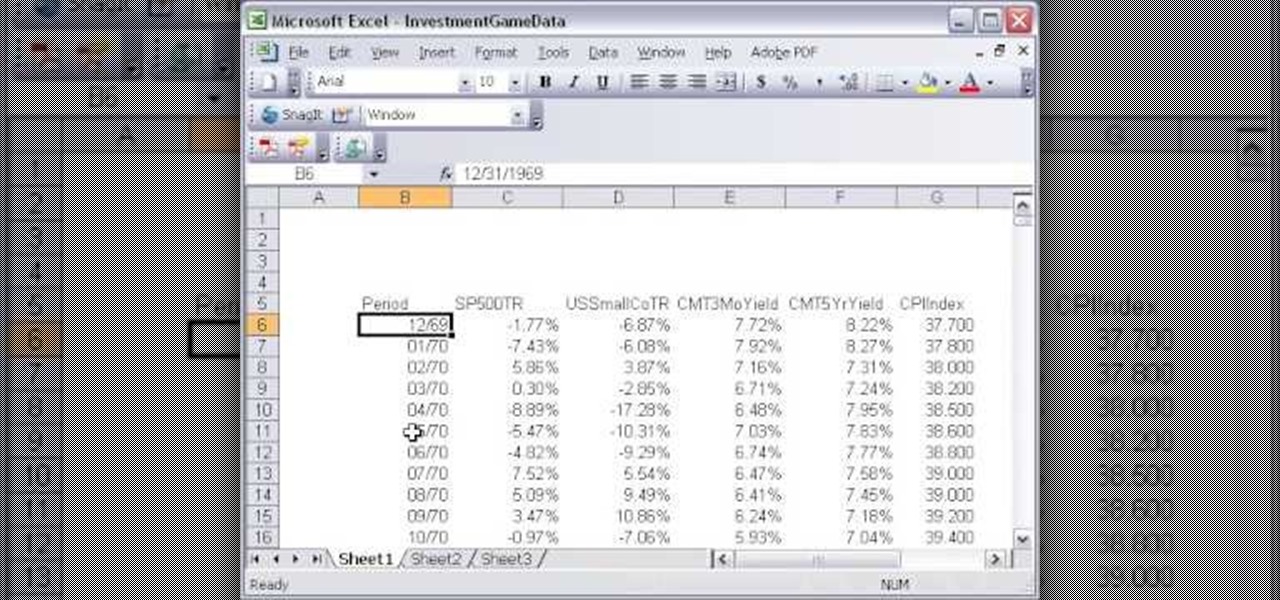
If you use Microsoft Excel on a regular basis, odds are you work with numbers. Put those numbers to work. Statistical analysis allows you to find patterns, trends and probabilities within your data. In this MS Excel tutorial from everyone's favorite Excel guru, YouTube's ExcelsFun, the 11th installment in his "Excel Statistics" series of free video lessons, you'll learn how to work with, and create charts for, cross-sectional and time-series data.
If you use Microsoft Excel on a regular basis, odds are you work with numbers. Put those numbers to work. Statistical analysis allows you to find patterns, trends and probabilities within your data. In this MS Excel tutorial from everyone's favorite Excel guru, YouTube's ExcelsFun, the 13th installment in his "Excel Statistics" series of free video lessons, you'll learn how to install the Excel 2007 Data Analysis add-in.
New to Microsoft Excel? Looking for a tip? How about a tip so mind-blowingly useful as to qualify as a magic trick? You're in luck. In this Excel tutorial from ExcelIsFun, the 574th installment in their series of digital spreadsheet magic tricks, you'll learn how to import data from Microsoft Access as well as how to use the VLOOKUP function to populate data into a printable form.
In this video Jesse Liberty dives deeper into data-binding, demonstrating in detail how to create business classes that represent data retrieved from a web service, and how to bind them to various controls using a combination of Blend and Visual Studio. This is a detailed, easy to follow video, to help you use the program, and all it entails.
A major plus in using Microsoft Excel is its ability to sort large amounts of data. What's the use of Excel, if you don't know how to sort? In this short video clip, learn how to go about sort your data in the order needed.
Learn how to access the PS3 secret recovery menu by following this tutorial. You will need a PS3, PS3 remote, and a USB charger cable. Hold the power button on your system. Listen for three beeps (as you keep your finger on the power button). The third beep will turn your system off. Repeat this process, but this time, you will hear only two beeps (one beep followed by a quick double beep). Turn your TV on and it will tell you to connect your controller to the PSP. Connect your USB cable to t...
The first thing that comes to mind when your car is stolen is: ####!! However, once calm, cover these bases when your car is stolen to notify relevant parties and help ensure vehicle recovery or replacement.
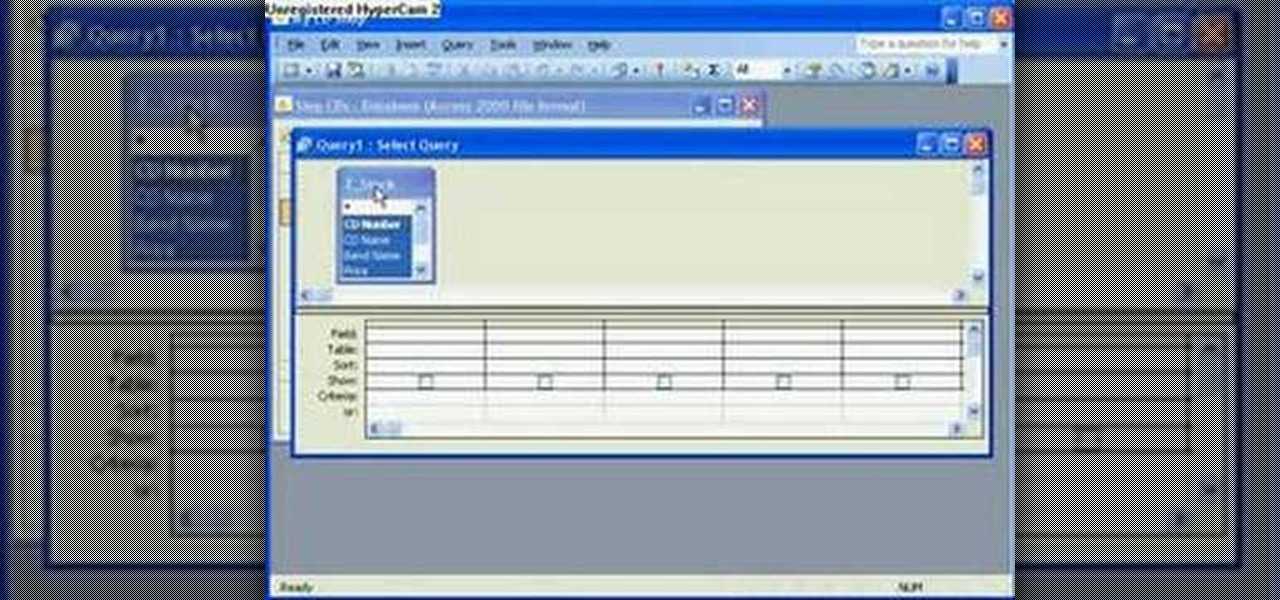
The Microsoft Office Access 2007 relational database manager enables information workers to quickly track and report information with ease thanks to its interactive design capabilities that do not require deep database knowledge. In this Microsoft Access video tutorial, you'll learn about sorting data using queries. For detailed instructions, and to get started using queries to sort data for yourself, watch this how-to.
Here is a quick video on how to convert Excel spreadsheet data to XML for import into Flash or Flex. Don't spend time typing all that data again, instead create a schema in Excel and convert it to XML.
In this helpful electronics tutorial video, you can learn how to erase data and information from your Apple iPhone. This how-to video makes erasing data from your iPhone easy and is especially helpful for new iPhone owners.
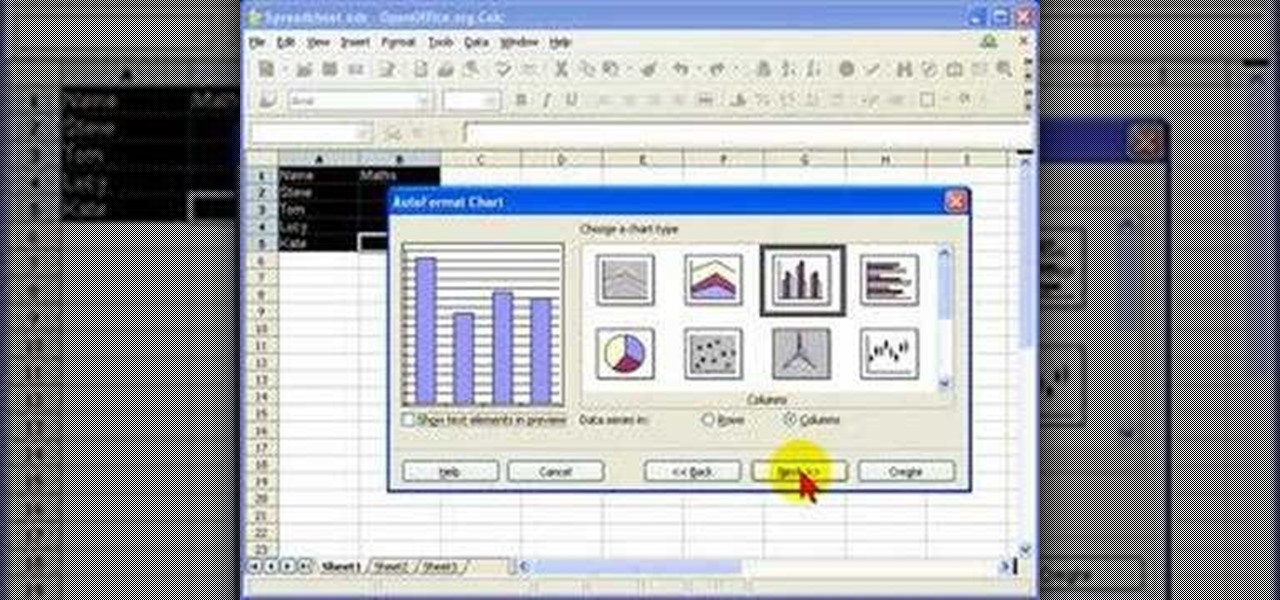
In this screencast tutorial, Steve shows you how to quickly and simply create a bar chart, from the data you have entered into your worksheet in Open Office Calc. If you're looking for a simple and clear way to represent your statistical data, then a simple bar chart is an option you should look at using. So check out this tutorial and start making OpenOffice Calc bar charts today.
Learn how to Import External Data (i.e data from web pages) dynamically into Excel in Microsoft's Office 2007.
In today's data-driven world, being well-versed in Big Data and analytics can help land an exciting and high-paying career. Whether you're interested in working for a major tech company or pursuing freelance work in development, you need to have a thorough understanding of the latest and greatest platforms in analytics if you want to succeed.
So far, iOS 13.4 hasn't been a disappointment. From new Memoji stickers, a refreshed Mail toolbar, and even the beginnings of controlling your car with your iPhone, Apple's latest iOS update is looking like a good one. That's why we're excited that Apple just released the third 13.4 developer beta today, one week after the release of the second one.
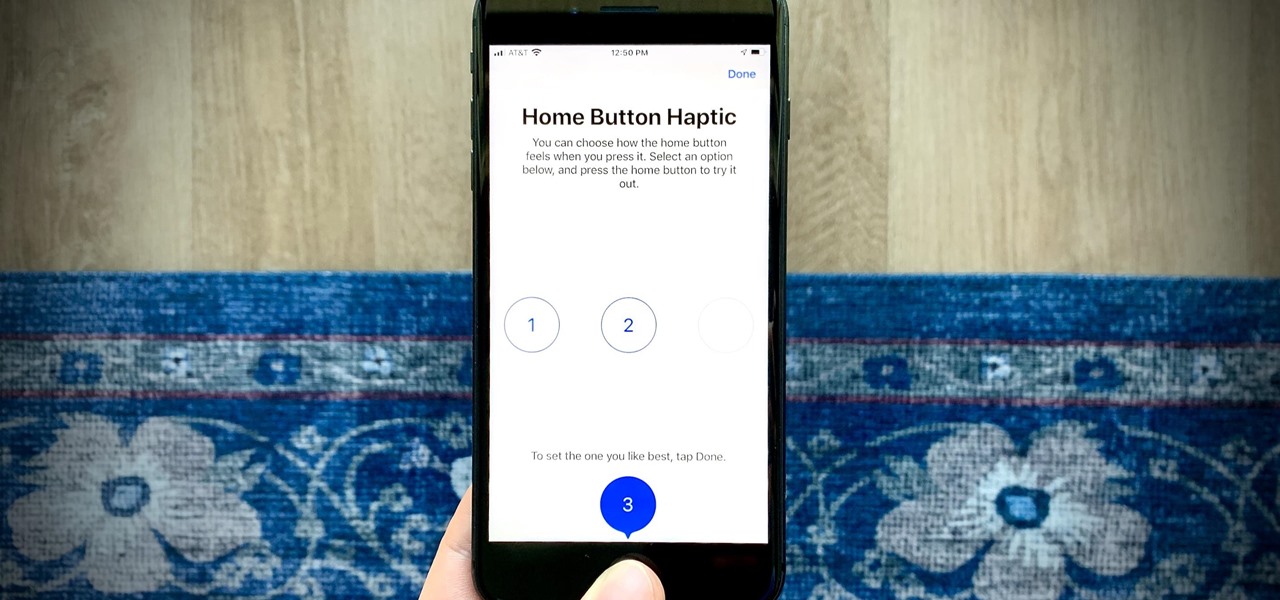
Apple's innovations often involve more taking away than adding on. The company has released seven iPhones that omit the home button, the latest batch including the iPhone 11, 11 Pro, and 11 Pro Max. If you recently picked up one of these devices for the first time, you might be a little confused on how to enter DFU mode when your iPhone acts up.