Traveling abroad can be a hassle. Between the flight, hotels, food, and the languages barriers, it can be a lot to manage. There's one tool you have that can help with all of this — your smartphone. Fortunately, nowadays, you don't have to change your carrier to continue using your phone.

The addition of a new research mode for Microsoft HoloLens will enable researchers and developers to tap into a wider range of data collected by the device's sensors.

Facebook, parent company of Instagram, has allowed you to download photos and other account data for some time now, but the data request feature is also now available on Instagram to meet the GDPR data portability requirement in the EU — and it's available worldwide, not just in Europe.

Data for mapping and other applications is the lifeblood of machine-driven cars, and so far, Tesla has taken a definitive lead in information it has gathered ahead of other driverless players, including Waymo.

Toyota is testing blockchain and distributed ledger technology (BC/DL) for data sharing for driverless cars and other applications. This could eventually reassure buyers of its upcoming high-end cars by making sure their sensitive data is secure.

T-Mobile's "Uncarrier" initiative has done wonders for my wallet and my data usage. Before I had to deal with being throttled down to 2G speeds after passing my data limit, but thanks to their unlimited data plans, I'm free to use as much LTE data as I possibly can. The only downside is, when sharing data through a mobile hotspot (tethering), T-Mobile imposes a 5 GB limit (which was recently upped to 7 GB for some).

Need to clear you cache? This guide details how on any web browser (Chrome, Internet Explorer, Firefox, Opera, Safari, Internet, and Dolphin) for any platform (Windows, Mac OS X, iOS, and Android). What Is the Cache Exactly?

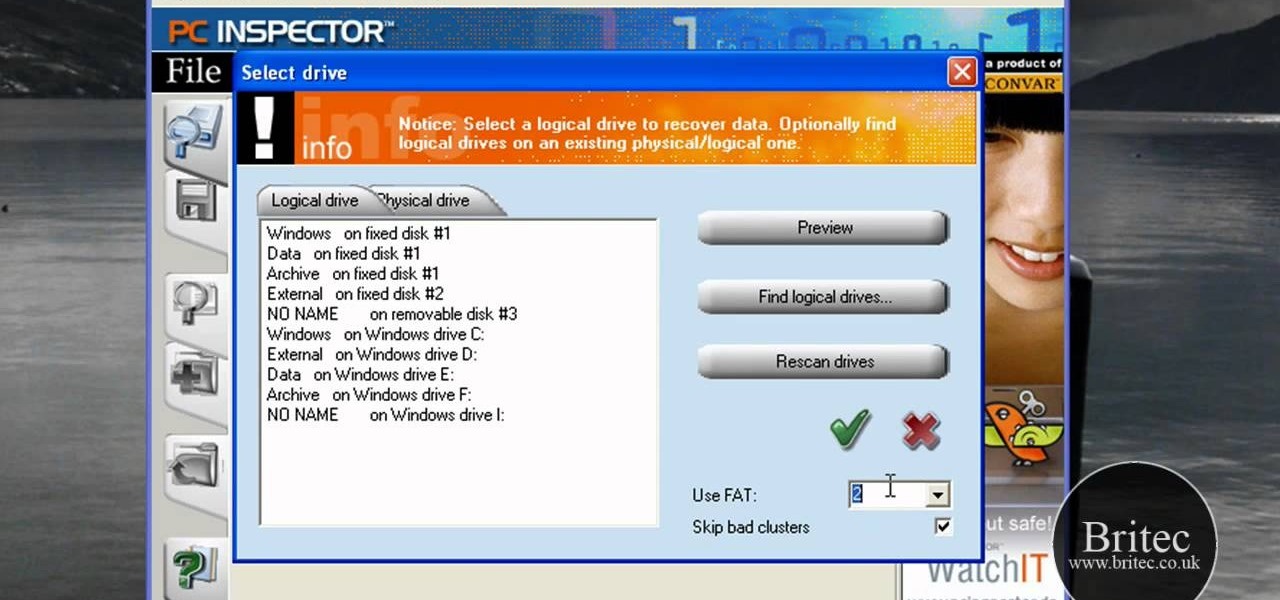
In this data recovery tutorial the instructor shows how to recover deleted files and lost data using a free software called PC Inspector. On your computer you may loose data sometimes due to a corrupted hard drive, or because you deleted it accidentally or some other reason. Now some times you will need to recover that important data and it will cost you hundreds of dollars to get it done outside by the professionals. Now you can avoid this and use a free software called PC inspector and reco...

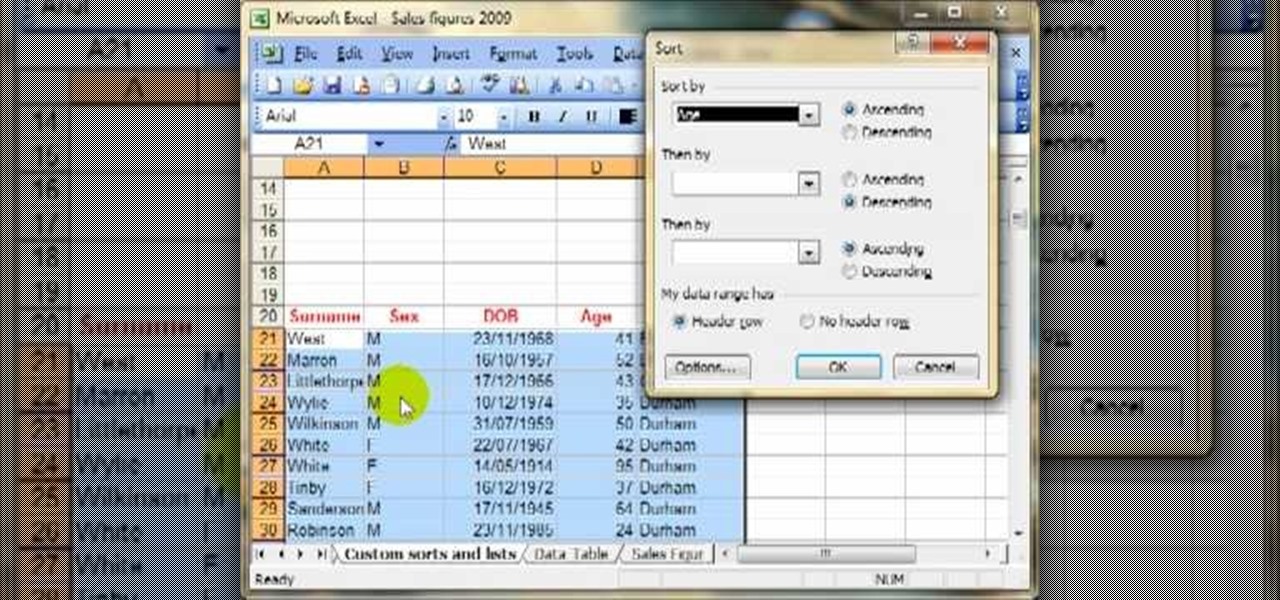
Today we are going to learn how to sort data in a Microsoft Excel 2003 spread sheet. We will go over single column and multiple column sorting. In a single column sort you may high light the data or just click on any cell in the column. Once the data is selected look for the sort icons just under the menu bars. There is a sort ascending and sort descending icon. Click on the icon and Excel will sort the list. When sorting multiple columns the data must be in columns next to each other. If the...

Hack mybrute with this mybrute cheat. MyBrute hacks, cheats, tricks. Watch this video tutorial to learn how to cheat MyBrute for a bear (05/08/09). This is the easiest way to get a bear!

Here is a helpful tip for the next time you go on a trip. Don't lose your way, or your money, watch this video and learn how to download Google Maps data onto your Android so you can use it offline.

If you're a certified computer nerd along the lines of NASA scientist Howard from "The Big Bang Theory," then you know how frustrating it can be transferring large amounts of data between an external hard drive or other drive and your main computer, especially when you're in a rush to get experiment data in. Usually this requires mounting the drive into a system or external case first.

Don't be suckered into buying two separate data plans! In this clip, you'll learn how to share your rooted Motorola Droid Android smartphone's 3G data connection with a Samsung Galaxy Tab over WiFi! For more information, including detailed, step-by-step instructions, take a look.

Learn all about your Intel Solid State Drive. In this video you'll learn how to migrate your old data from your hard drive to your new Intel SSD. Watch the video and it'll walk you through each step of the way. Then you can go and enjoy your new Solid State Drive!

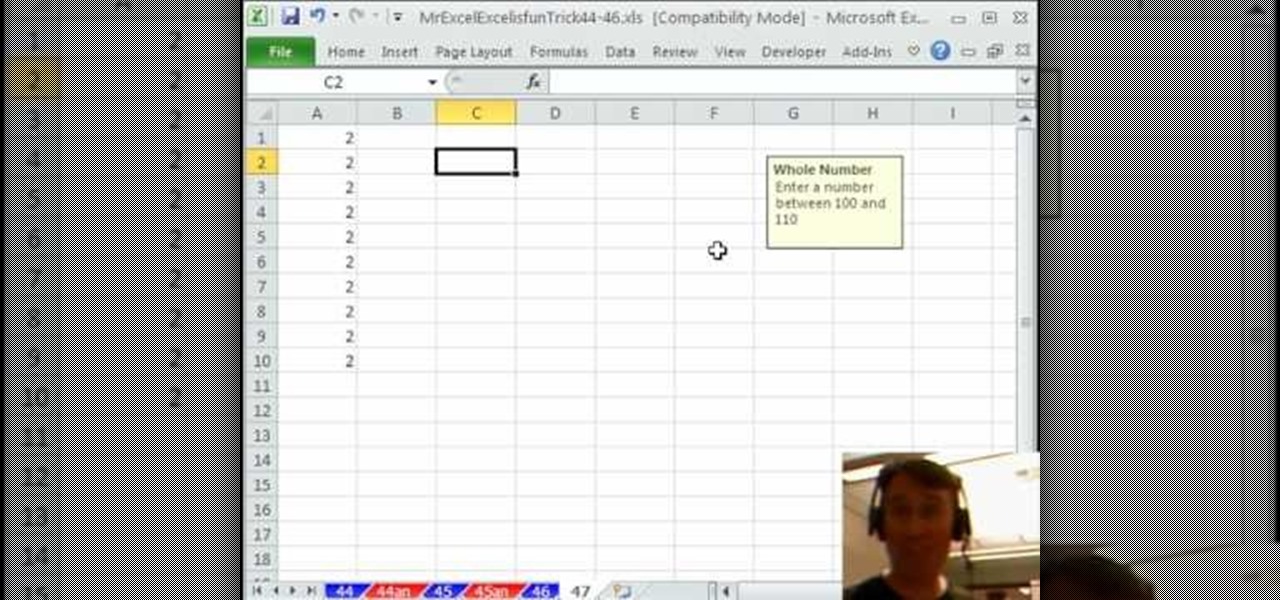
New to Microsoft Excel? Looking for a tip? How about a tip so mind-blowingly useful as to qualify as a magic trick? You're in luck. In this MS Excel tutorial from ExcelIsFun and Mr. Excel, the 48th installment in their joint series of digital spreadsheet magic tricks, you'll learn how to break Excel by moving a data validation ScreenTip.

T-Mobile says that you are unable to use the new G1 Google Android phone without purchasing the expensive data plan. Basically, this tutorial will show you exactly how to get around that rule and unlock your phone, regardless of your plan. You won't have Internet on your phone but you will be able to make calls and still use the device in WiFi.

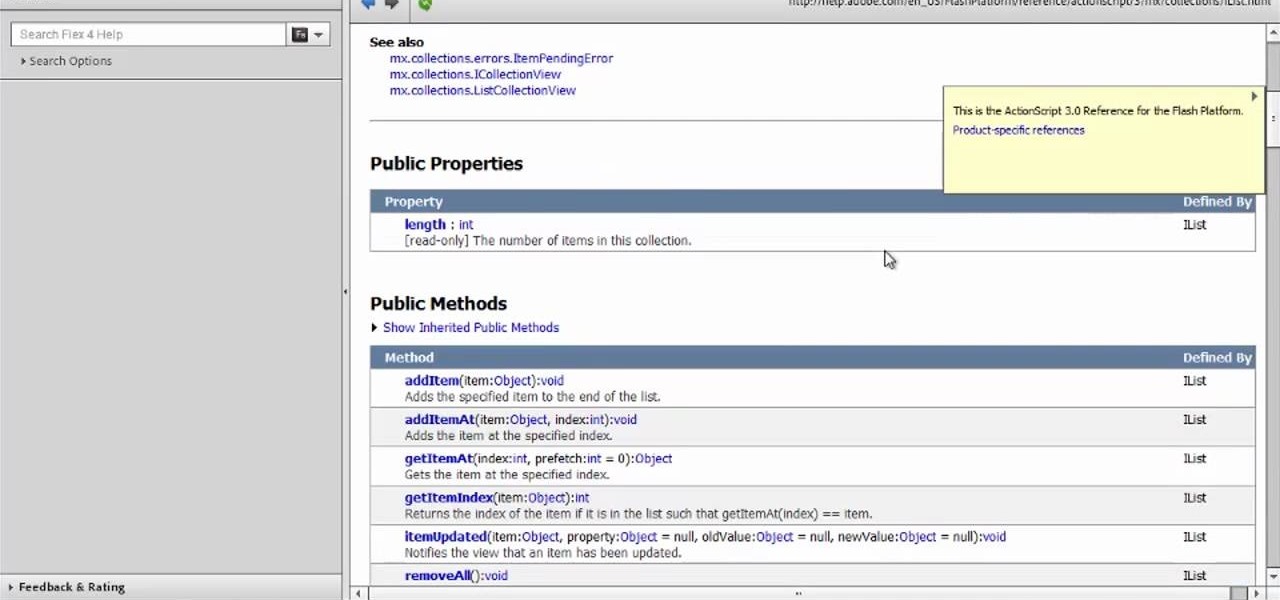
Organize your data with ArrayList and ArrayCollection when working in Adobe Flash Builder 4. This clip will show you what to do. Whether you're new to Adobe's popular Flash IDE (previously titled Adobe Flex Builder) or simply wish to become better acquainted with the program, you're sure to find benefit in this free video software tutorial. For more information, including specific, step-by-step instructions, take a look.

New to Microsoft Excel 2010? Looking for a few good tips and tricks? Look no further. In this free video tutorial from everyone's favorite MS Excel guru, YouTube's ExcelIsFun, the 5th installment in his series of Excel 2010 video tutorials, you'll learn how to apply conditional formatting to cell data bars.

New to Microsoft Excel? Looking for a tip? How about a tip so mind-blowingly useful as to qualify as a magic trick? You're in luck. In this MS Excel tutorial from ExcelIsFun and Mr. Excel, the 4th installment in their joint series of digital spreadsheet magic tricks, you'll learn how to create charts to compare data values.

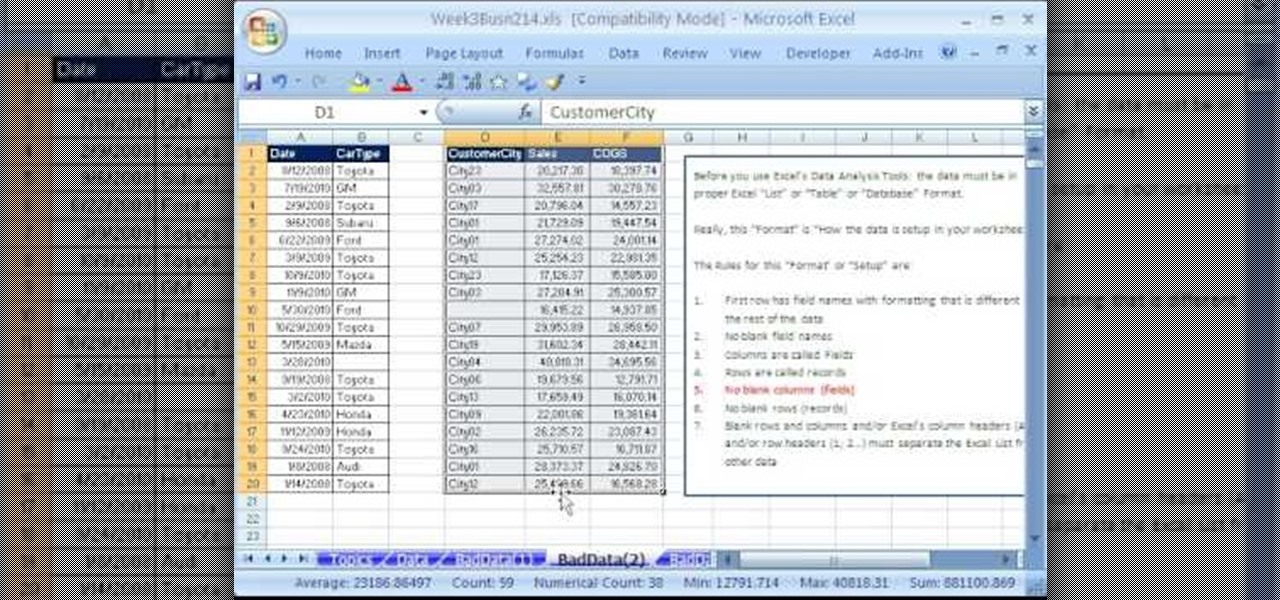
Whether you're interested in learning Microsoft Excel from the bottom up or just looking to pick up a few tips and tricks, you're in the right place. In this tutorial from everyone's favorite digital spreadsheet guru, ExcelIsFun, the 14th installment in his "Highline Excel Class" series of free video Excel lessons, you'll learn how to set up data in Excel so sorting, filtering, subtotals and PivotTables (Pivot Tables) can be done easily.

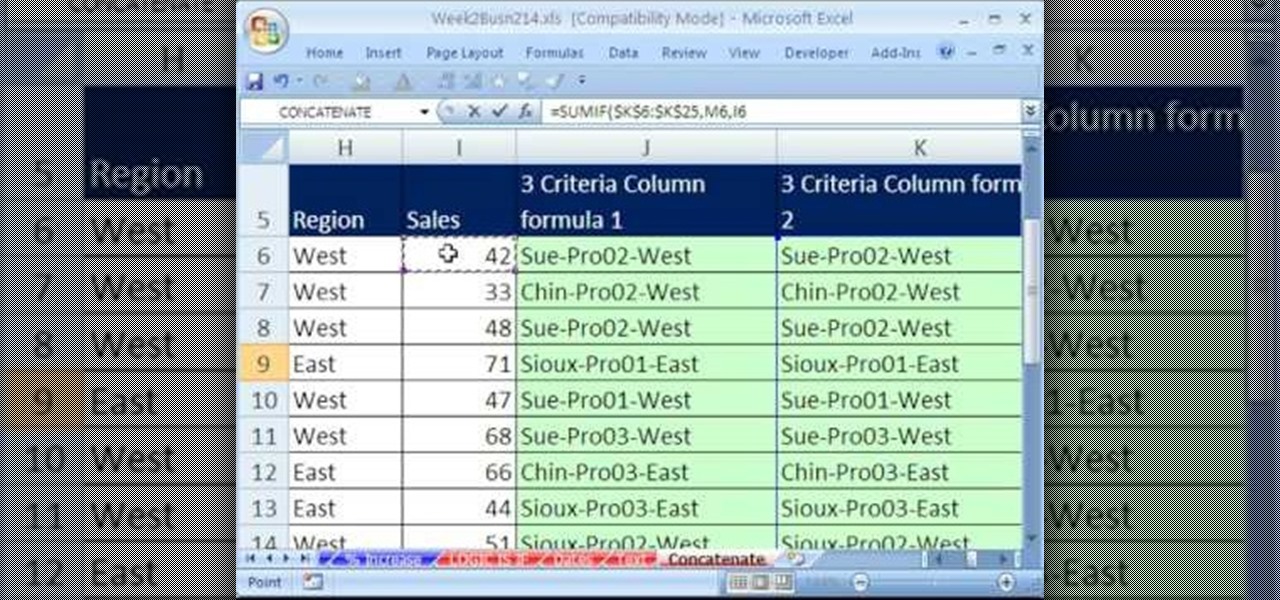
Whether you're interested in learning Microsoft Excel from the bottom up or just looking to pick up a few tips and tricks, you're in the right place. In this tutorial from everyone's favorite digital spreadsheet guru, ExcelIsFun, the 11th installment in his "Highline Excel Class" series of free video Excel lessons, you'll learn how to transform bad data into useful data using formulas and text functions such as TRIM, PROPER, SUBSTITUTE, REPLACE, FIND and LEFT. Also see how to use the ampersan...

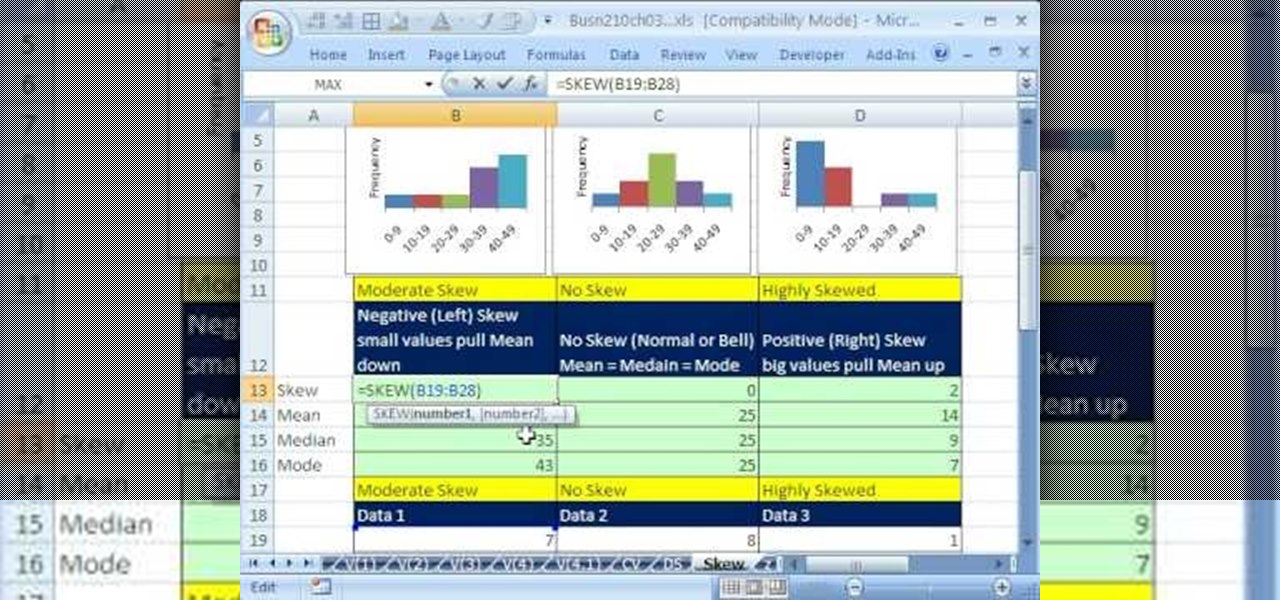
If you use Microsoft Excel on a regular basis, odds are you work with numbers. Put those numbers to work. Statistical analysis allows you to find patterns, trends and probabilities within your data. In this MS Excel tutorial from everyone's favorite Excel guru, YouTube's ExcelsFun, the 44th installment in his "Excel Statistics" series of free video lessons, you'll learn how to use the SKEW function to calculate the skew in a distribution of data.

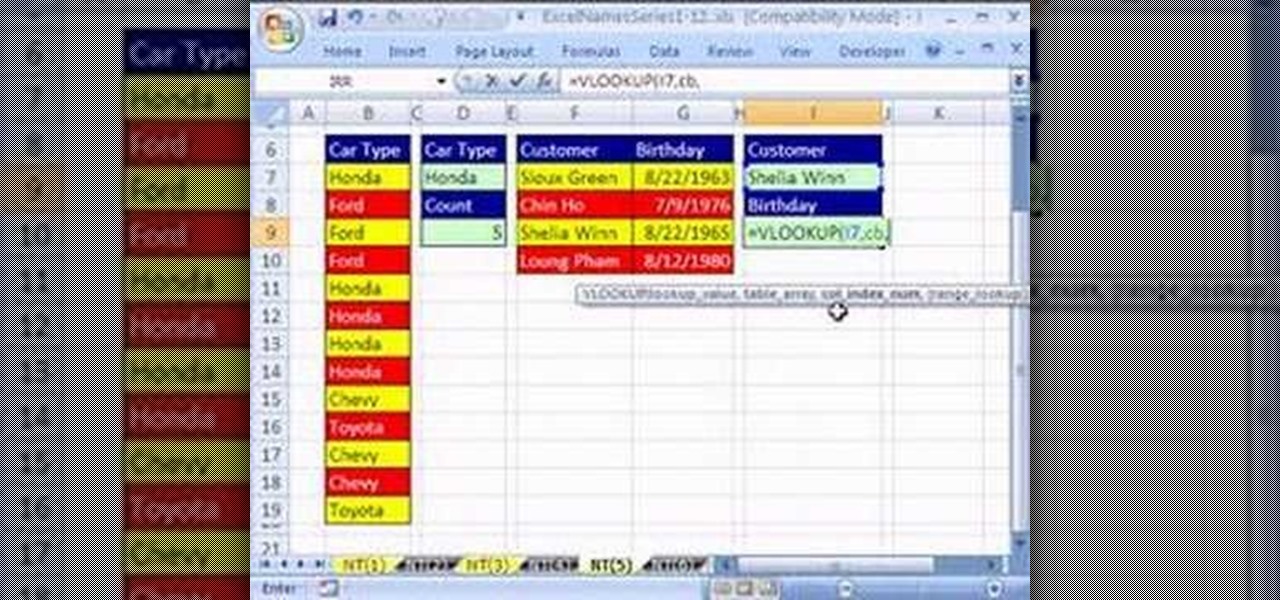
Looking for a primer on how to create and work with names in Microsoft Office Excel? You've come to the right place. In this free video tutorial from everyone's favorite MS Excel guru, YouTube's ExcelIsFun, the 5th installment in his series of Excel name tricks, you'll learn to use names with pivot tables, data validation & the VLOOKUP & COUNTIF functions and formulas.

If you use Microsoft Excel on a regular basis, odds are you work with numbers. Put those numbers to work. Statistical analysis allows you to find patterns, trends and probabilities within your data. In this MS Excel tutorial from everyone's favorite Excel guru, YouTube's ExcelsFun, the 28th installment in his "Excel Statistics" series of free video lessons, you'll learn how to create quantitative data stem & leaf charts using the REPT and COUNTIF functions.

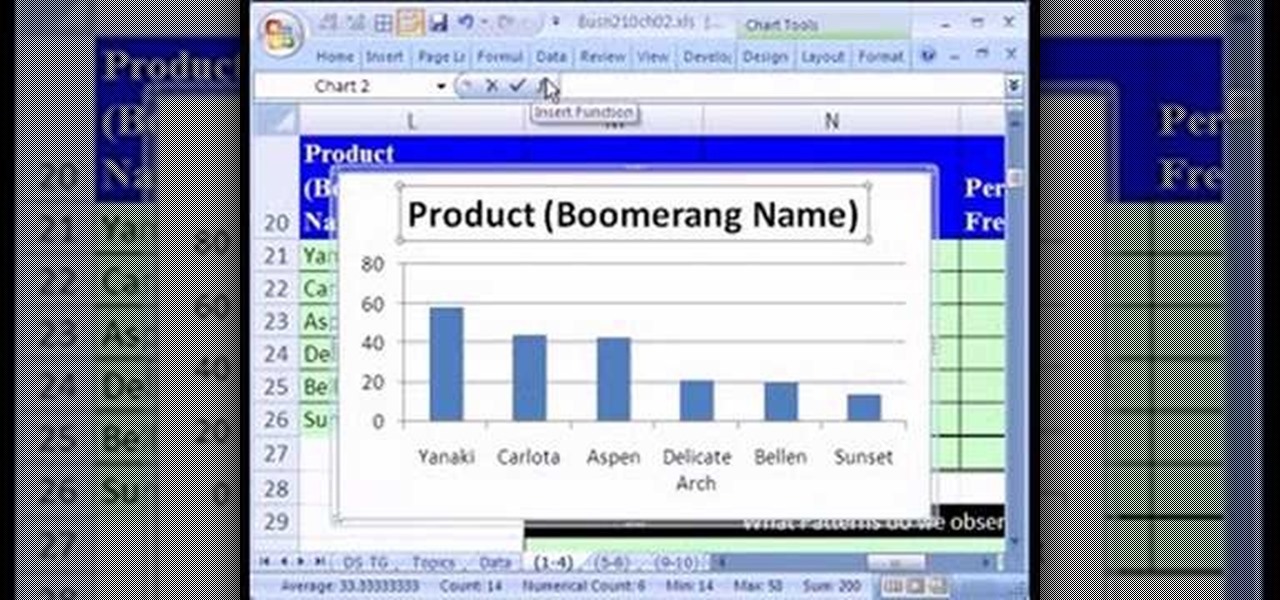
If you use Microsoft Excel on a regular basis, odds are you work with numbers. Put those numbers to work. Statistical analysis allows you to find patterns, trends and probabilities within your data. In this MS Excel tutorial from everyone's favorite Excel guru, YouTube's ExcelsFun, the 13th installment in his "Excel Statistics" series of free video lessons, you'll learn how to create a column chart from a frequency distribution for categorical data.

Love Microsoft Excel? This clip contains a tip that just might induce you to. With this free video tutorial from ExcelIsFun, the 77th installment of his "YouTubers Love Excel" or YTLE series of free video MS Excel lessons, you'll learn how to do a complicated payroll formula when tax data must be retrieved from multiple tables. See how to use the INDEX, INDIRECT AND MATCH functions in one big formula to retrieve tax data from multiple tables on multiple sheets. Learn to love digital spreadshe...

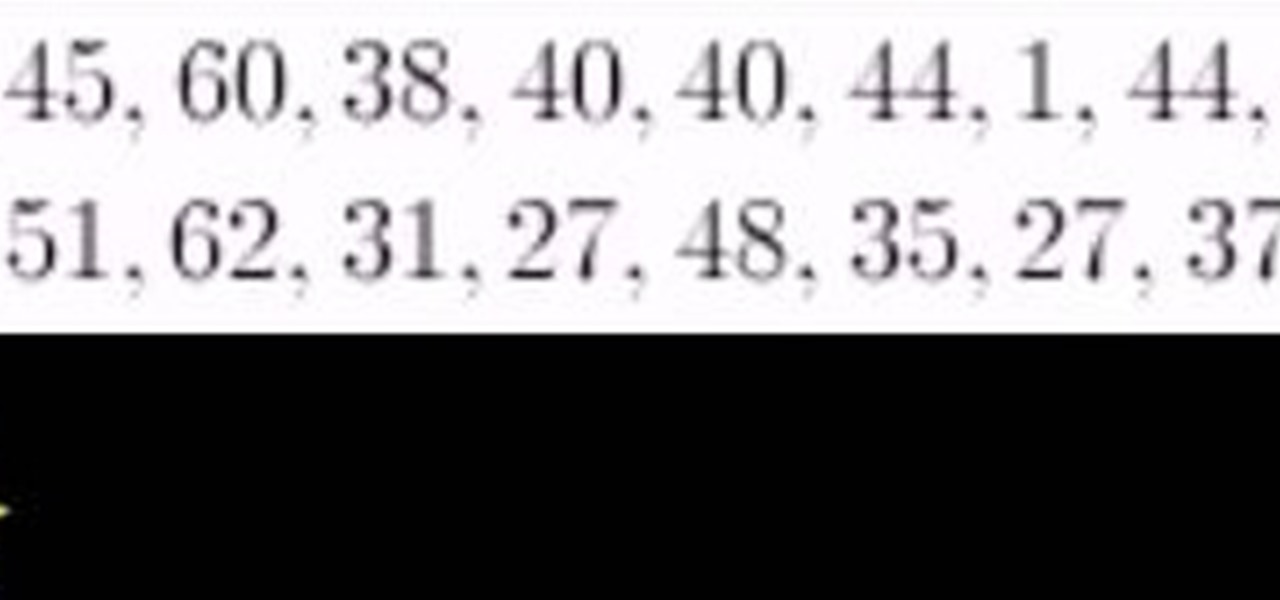
From Ramanujan to calculus co-creator Gottfried Leibniz, many of the world's best and brightest mathematical minds have belonged to autodidacts. And, thanks to the Internet, it's easier than ever to follow in their footsteps. With this installment from Internet pedagogical superstar Salman Khan's series of free math tutorials, you'll learn how to visualize statistical data with a hand-drawn stem-and-leaf chart.

New to Microsoft Excel? Looking for a tip? How about a tip so mind-blowingly useful as to qualify as a magic trick? You're in luck. In this MS Excel tutorial from ExcelIsFun, the 536th installment in their series of digital spreadsheet magic tricks, you'll learn how to list all modes in a given multimodal data set using Excel 2010's MODE.MULT function.

New to Microsoft Excel? Looking for a tip? How about a tip so mind-blowingly useful as to qualify as a magic trick? You're in luck. In this MS Excel tutorial from ExcelIsFun, the 375th installment in their series of digital spreadsheet magic tricks, you'll learn how to copy non-contiguous columns of data and then paste all the columns at once.

New to Microsoft Excel? Looking for a tip? How about a tip so mind-blowingly useful as to qualify as a magic trick? You're in luck. In this MS Excel tutorial from ExcelIsFun, the 213th installment in their series of digital spreadsheet magic tricks, you'll learn how to create a non-array formula to extract data dynamically using two different methods.

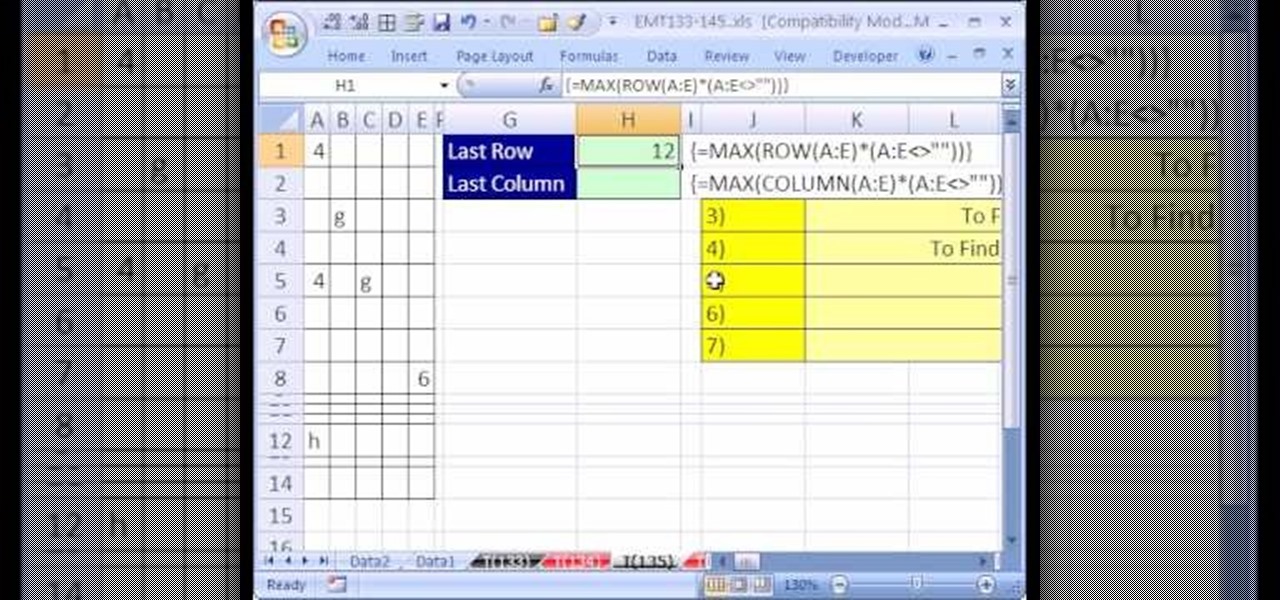
New to Microsoft Excel? Looking for a tip? How about a tip so mind-blowingly useful as to qualify as a magic trick? You're in luck. In this MS Excel tutorial from ExcelIsFun, the 135th installment in their series of digital spreadsheet magic tricks, you'll learn how to create a dynamic range when there are blanks in the data set. Learn also how to use an array formula to find the Last row or column used in a data set.

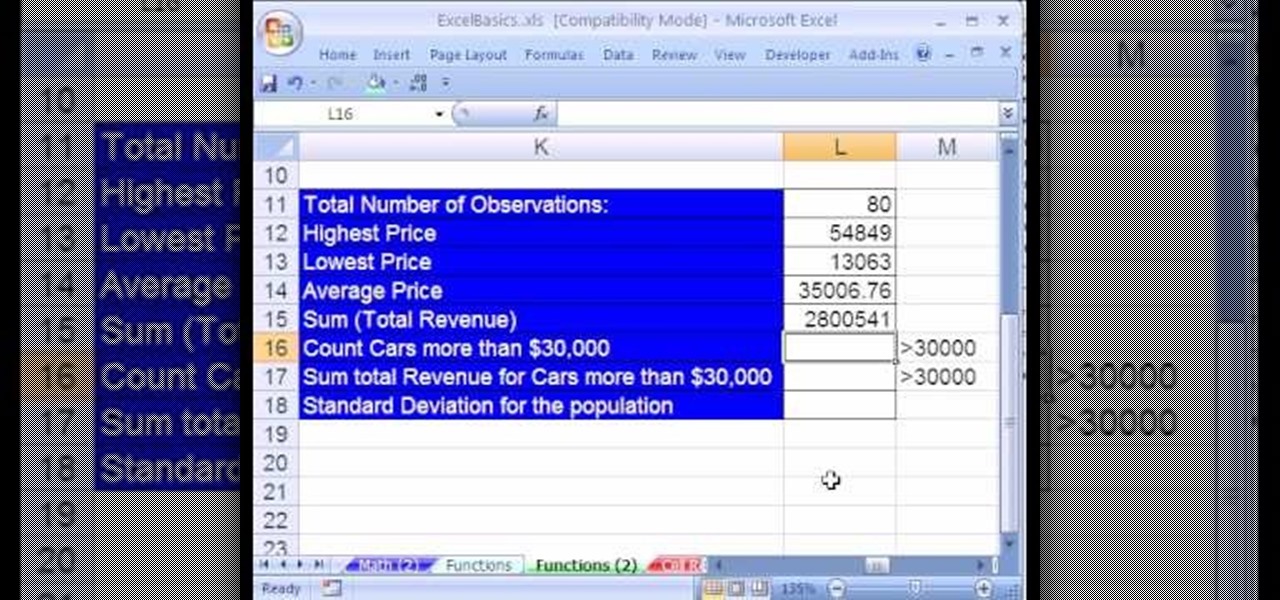
New to Microsoft Excel? Looking for a tip? How about a tip so mind-blowingly useful as to qualify as a magic trick? You're in luck. In this MS Excel tutorial from ExcelIsFun, the 97th installment in their series of digital spreadsheet magic tricks, you'll learn how to use the AVEDEV function to measure the spread (variation) in a data set. Also see the STDEV function and learn how to measure whether a mean represents its data points fairly.

Selling your old iPhone to make way for the latest generation? Before you get all Ebay happy, make sure to take a quick look at this video, which will demonstrate how to completely erase all data from your iPhone - including your contacts from the SIM card. Your friends will thank you for it.

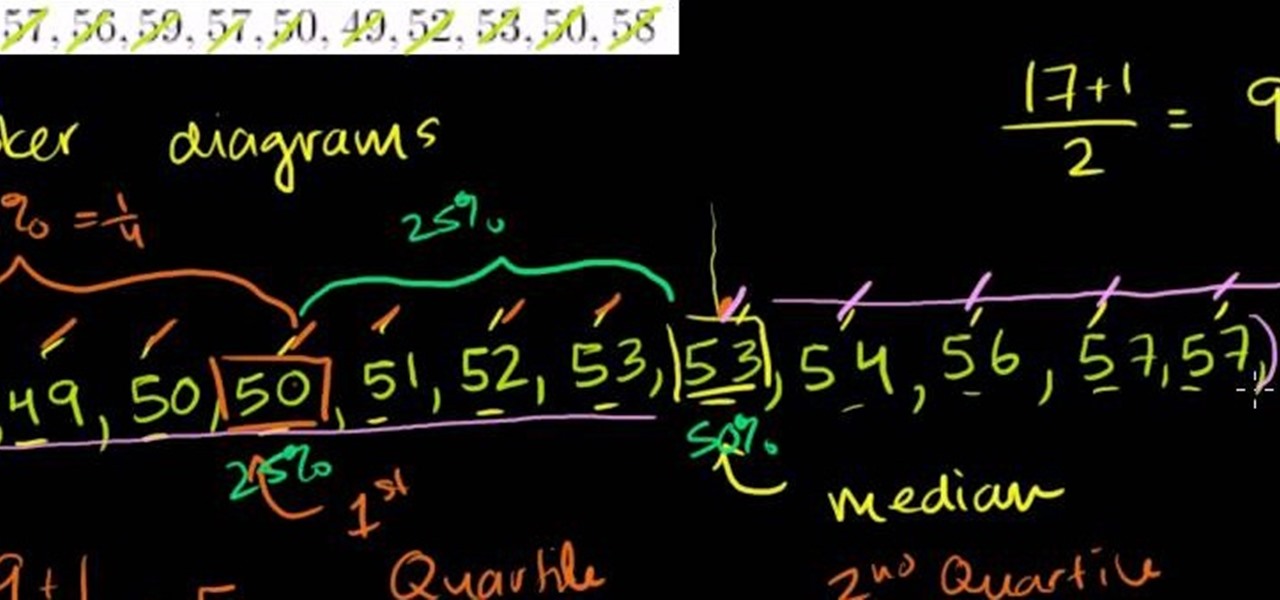
From Ramanujan to calculus co-creator Gottfried Leibniz, many of the world's best and brightest mathematical minds have belonged to autodidacts. And, thanks to the Internet, it's easier than ever to follow in their footsteps (or just study for that next big test). With this installment from Internet pedagogical superstar Salman Khan's series of free statistics tutorials, you'll learn how to use visualize data by graphing it in a box-and-whisker diagram.

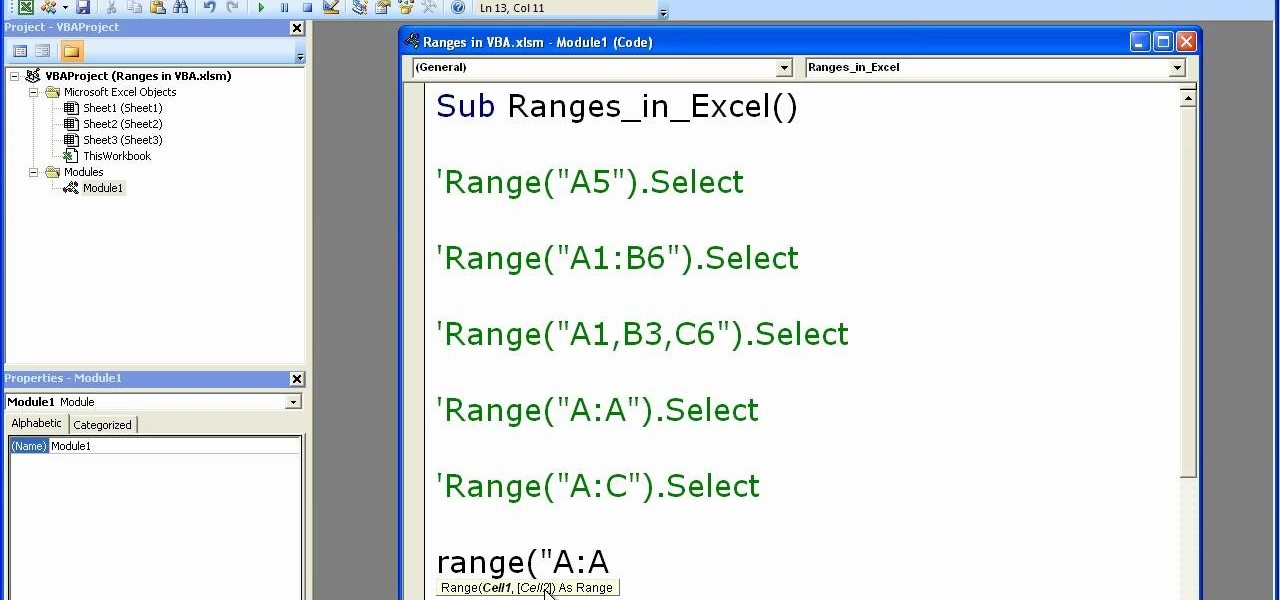
Microsoft excel is a powerful tool used to work with numbers and data by filling them down in rows and columns of a table. Excels also supports macros, which are small scripts to automate certain functions. In Microsoft Excel you can select entire rows and columns using the range property. You can also use macros to select individual rows and columns as well as multiple variations of rows, columns, and individual cells all at once. In Excel a horizontal line of data is called as row and a ver...

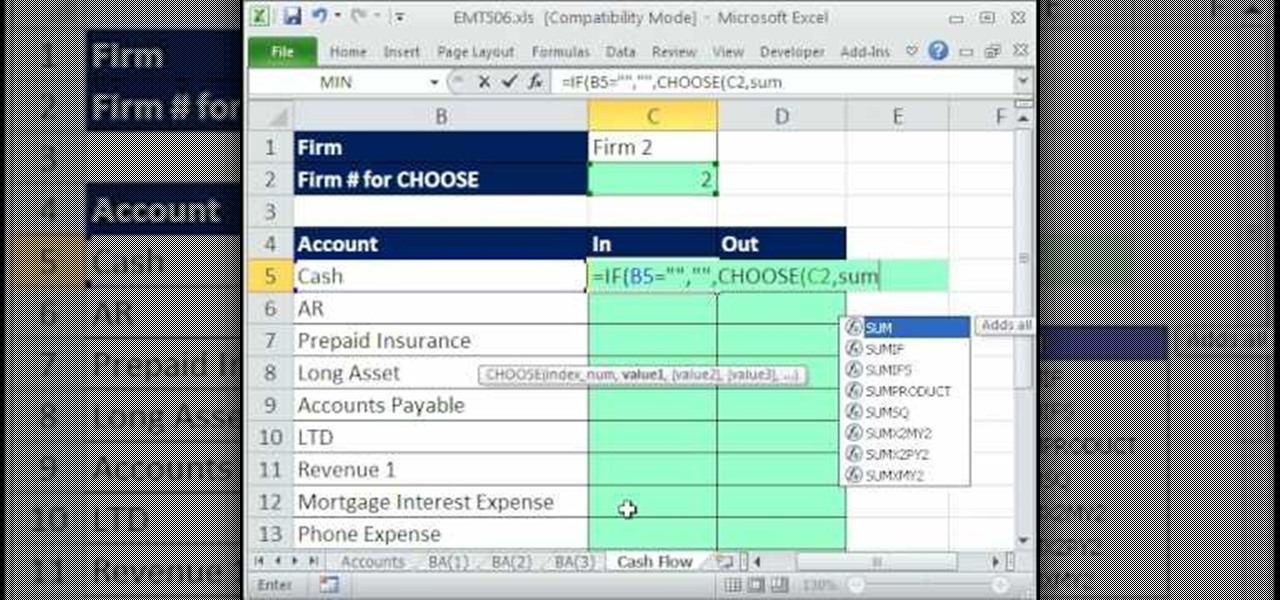
New to Excel? Looking for a tip? How about a tip so mind-blowingly advanced as to qualify as a magic trick? You're in luck. In this Excel tutorial from ExcelIsFun, the 506th installment in their series of digital spreadsheet magic tricks, you'll learn how to summarize data from multiple sheets. For example, you'll see how take checkbook register data from multiple banks accounts and summarize it based on account names.

TrueCrypt is a free application that lets you encrypt designated programs on your Ubuntu system to prevent unwanted access. Provided you select a strong password, intruders will not be able to open your personal files and documents. This instructional video walks you through the process of installing TrueCrypt on your Ubuntu operated machine and demonstrates an example on how to create an encrypted volume within a select partition.

Create a table with sales data with this video.

Devolped by the same team of engineers responsible for LightWave 3D, modo, lowercase, delivers the next evolution of 3D modeling, painting and rendering in a single integrated and accelerated package for the Mac and PC. And now, modo is a true end-to-end solution that includes true 3D sculpting tools, animation and network rendering! More than just features, modo is a truly elegant integration of technology, raw horsepower and refined workflow. With such a wealth of inbuilt features, however,...

You may have lost your files but you needn't loose hope, too. In this episode of Lab Rats TV, Andy and Sean show you how to recover your deleted data (and your marriage!) using oranges. For detailed instructions on recovering your own lost data, take a look at this tech how-to.


