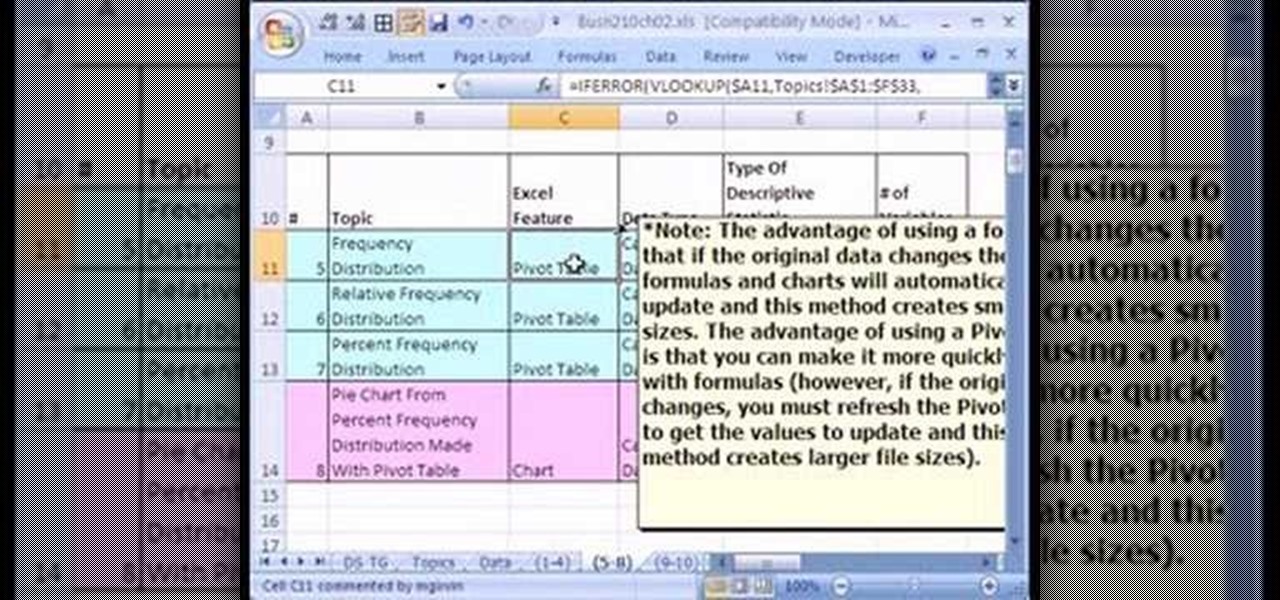
If you use Microsoft Excel on a regular basis, odds are you work with numbers. Put those numbers to work. Statistical analysis allows you to find patterns, trends and probabilities within your data. In this MS Excel tutorial from everyone's favorite Excel guru, YouTube's ExcelsFun, the 12th installment in his "Excel Statistics" series of free video lessons, you'll learn how to use Advanced Filter 'Unique Records Only" to extract a list of unique items from a data base, and then use the COUNTI...

Check out this informative video tutorial from Apple on how to format data values with the format bar in Numbers '09.

Threats to your privacy and security are everywhere, so protecting your data should be the highest priority for anyone with a smartphone. However, one threat many people overlook is the company who supplies the operating system your Android phone runs — Google.

Recently, a group of Duke University students got together to tackle an age-old problem with mobile devices. You see, mobile data coverage isn't exactly ubiquitous, and many folks have restrictive mobile data plans, which means internet connectivity is not always an option.

Welcome back, my rookie hackers! Most often, the professional hacker is seeking protected information from the target system or network. This might be credit card numbers, personally identifiable information, or intellectual property (formulas, plans, blueprints, designs, etc.). Most of my Null Byte guides have been focused on getting into the system, but this only begs the question—"what do I do when I get there?"

It has been a long while since I last came here to write an article. Graduate school keeps you busy. After I looked over what I had written previously, I decided that I should introduce another fun topic from cryptography. In this case, steganography.

This five-part series on C# programming covers many things. First, you learn how to save to the Microsoft SQL Server. Then, you'll learn how to retrieve that data. You'll also learn how to navigate the DataSet, edit SQL data, and delete data. If you have Microsoft Visual Studio and SQL Server, give this lesson a try.

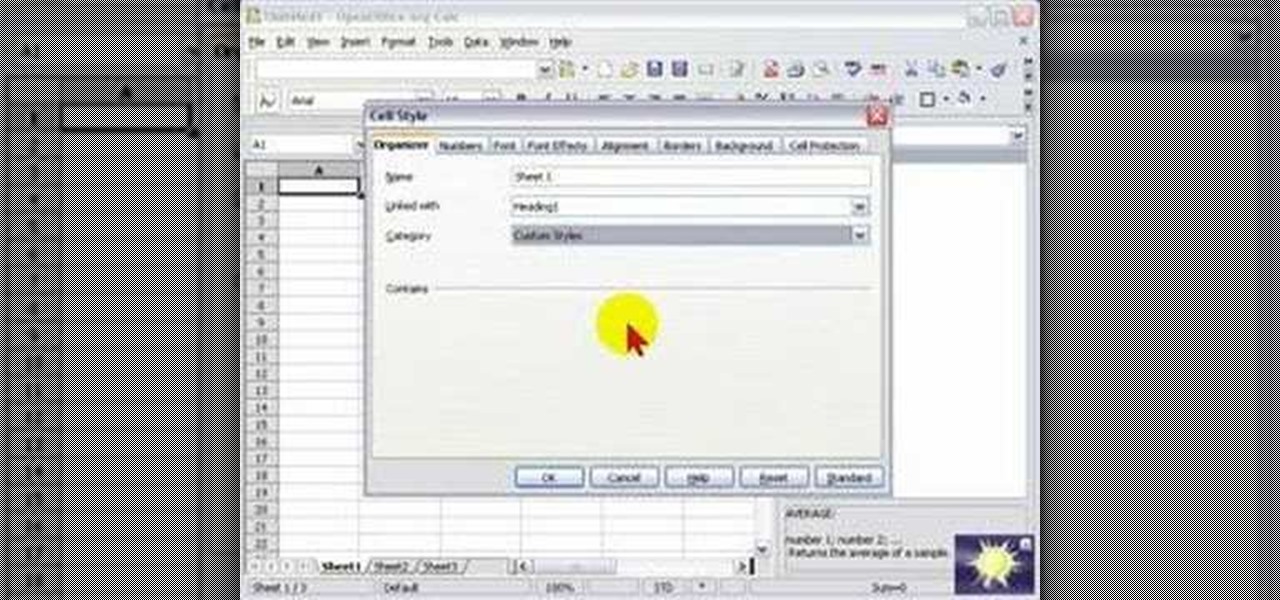
In this screencast, we look at how changing the page style of each sheet in your spreadsheet can enable you to apply different formatting settings for each one.

If you're reading this, you're likely a tech-savvy coding pro whose analytical talents are mostly applied to designing apps, cracking passwords, and infiltrating networks — all of which are admirable activities for both aspiring and seasoned white hat hackers. But there are other profitable ways that you can put these types of skills to use, namely in the world of investment and trading.

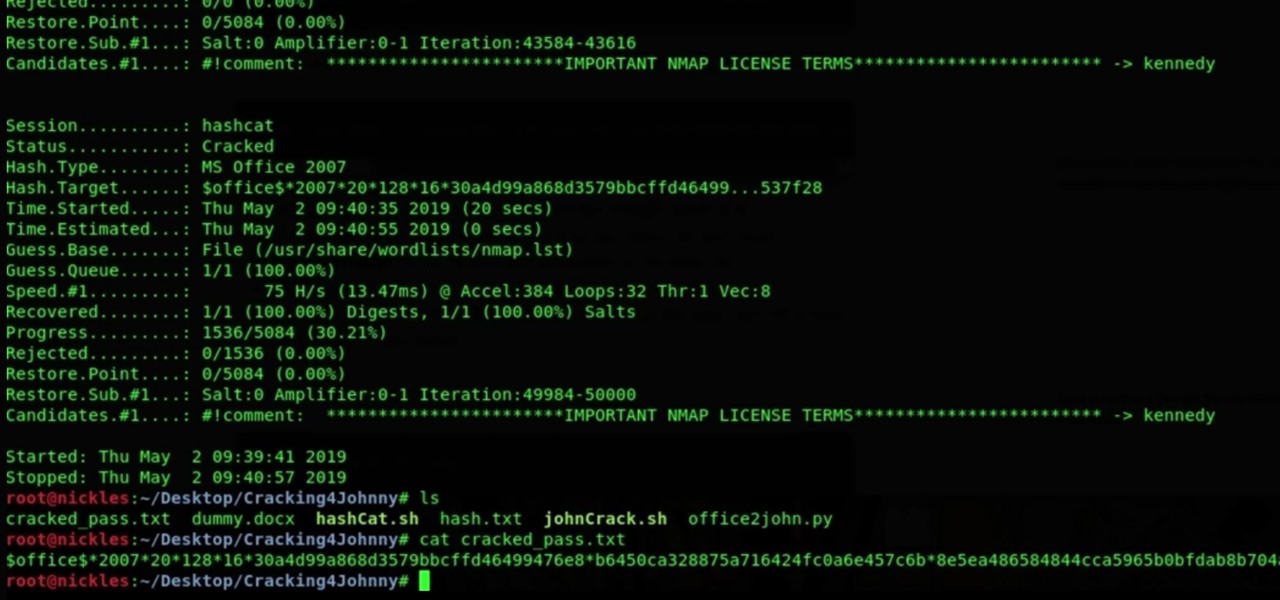
It's nearly impossible not to be at least somewhat familiar with Microsoft Excel. While it's needed for many office jobs and data analysis fields, hackers could also benefit from improving their spreadsheet skills. Many white hats already know some of the essential Excel hacks, such as cracking password-protected spreadsheets, but there's so much more to know from an attack standpoint.

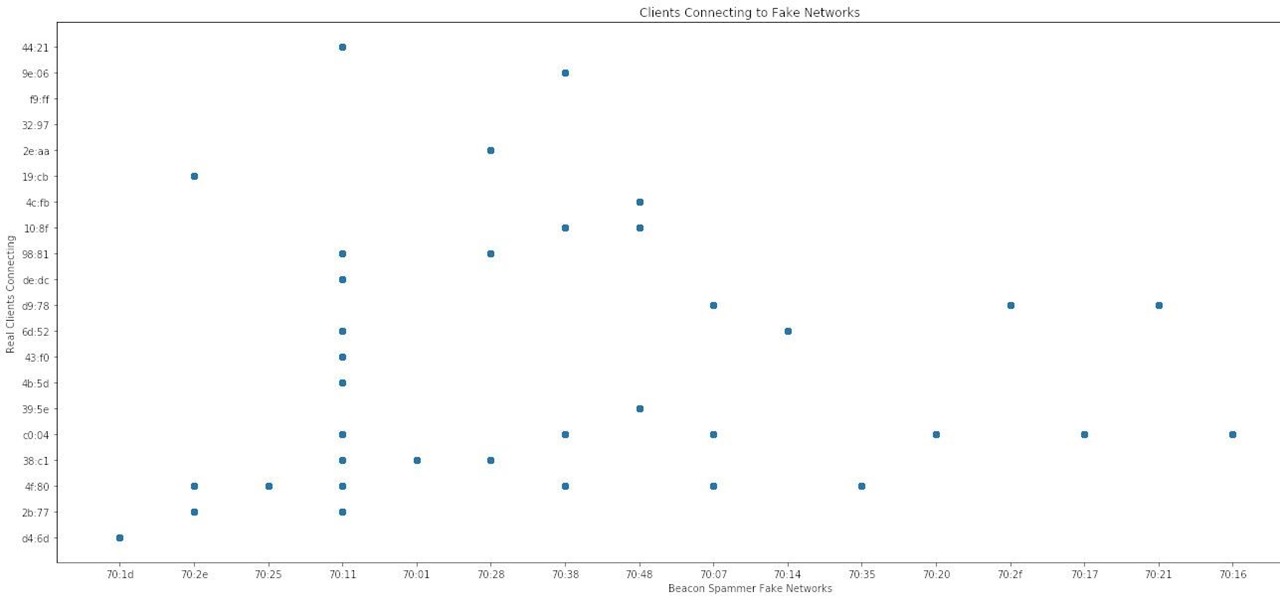
When it comes to sniffing Wi-Fi, Wireshark is cross-platform and capable of capturing vast amounts of data. Making sense of that data is another task entirely. That's where Jupyter Notebook comes in. It can help analyze Wi-Fi packets and determine which networks a particular phone has connected to before, giving us insight into the identity of the owner.

Your email inbox is a treasure trove of personal data. The people you contact, your writing style, which messages you flag as spam — all of this information and more can be used to paint a clear picture of you. Google knows this as well as anybody, so they use this data to constantly improve your experience in Gmail.

Google collects an enormous amount of personal data. While some of this data is used for targeted ads, others tidbits of info such as our location are used to improve our mobile experience. While it is natural for us to distrust Google's intentions, by allowing their data collection, we can add new functionality to our favorite apps.

In a race to make self-driven cars mainstream, Intel announced today that they've bought Israeli microchip technology company Mobileye for $15.3 billion, setting the stage for Intel to dominate a large portion of the driverless market.

If you're an Android user, Google probably has almost your entire digital life stored on its servers. Family pictures are backed up on Google Photos, your e-book library resides with Google Play Books, videos are on YouTube, chat logs in Gmail and Hangouts, starred places and location history in Google Maps, and so much more.

Hey guys, in this tutorial, we are going to learn about the heap segment and how to use it for storing data in our programs. We will also go into the details of its use in conjunction with the char pointer and struct data types.

We've talked before about EXIF data—or metadata—attached to photos and how it can expose information about your location, what type of device you're using, and even the device or camera's unique identification number.

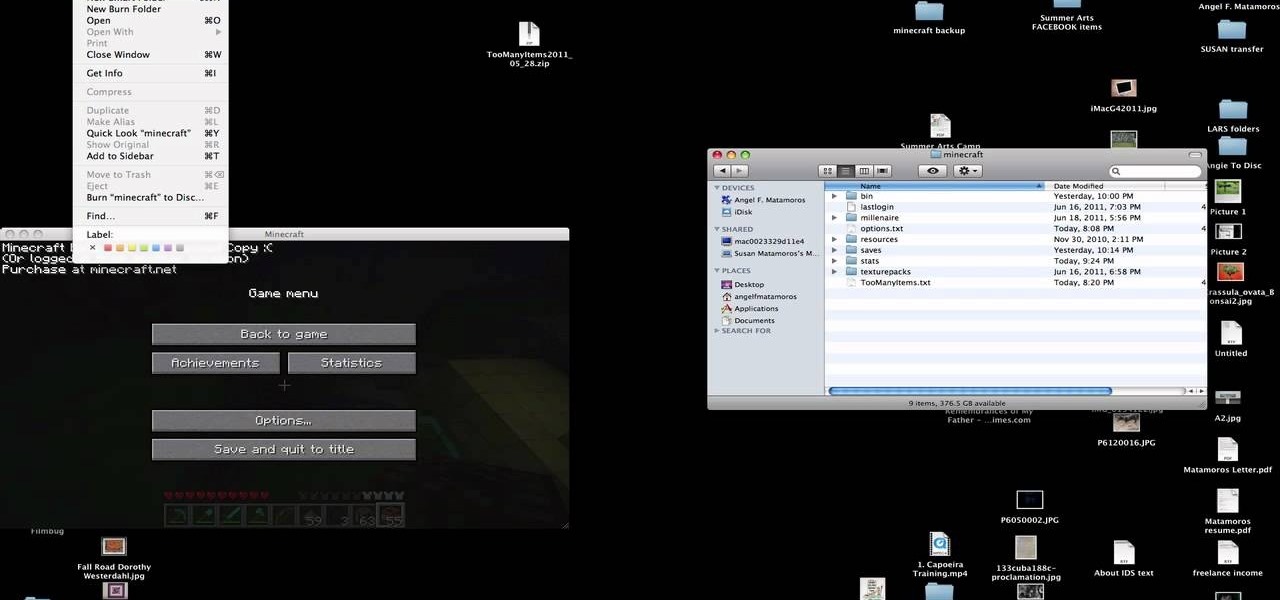
You have worked long and hard creating an entire world of Minecraft data. Make sure you have all of that saved data backed up. Watch this video to learn how to backup your Minecraft data. You will be glad that you did.

Thirty dollars a month may be a little steep for an unlimited data plan for iPad users. To cut down on your data usage, you can download the Offline Pages app to browse articles or blogs offline. InstaPaper is another account you can use as well, and both will cut down on your data usage per month.

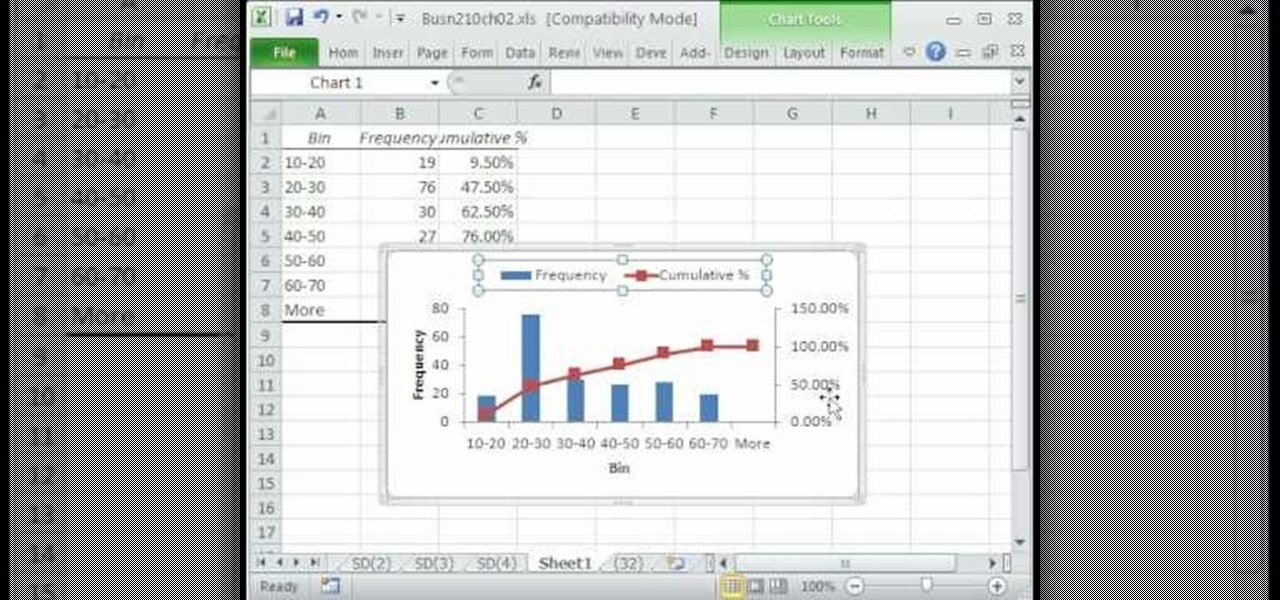
A histogram is a summary graph showing a count of data points that fall in various ranges. Histograms are used in statistics and other forms of mathematics. In this video, learn how to create your own histogram using data analysis on the computer. This tutorial will show you how to create a frequency distribution, a cumulative frequency distribution, a histogram chart and an ogive chart with the data analysis add-in.

In this six-part video tutorial, learn how to create an access database. The following six parts go over the following:

Looking to find the standard deviation of your set of values? Standard deviation quantifies how diverse the values of your data set are, and is useful in determining how different your numbers are from each other.

See how simple it is to create data-driven web sites using ASP.NET 2.0, Visual Web Developer 2005 Express Edition, and SQL Server 2005 Express Edition. Watch this video tutorial to learn how to create a database, add its data, and display that data on a web page.

In Halo: Reach for the Xbox 360, there is so much to do! The campaign, the multiplayer, the achievements! But One tough one to get is all 19 hidden data pads. Luckily for you, the first nine can be acquired on any difficulty, and in this video you will learn the locations of all nine of the initial data pads on levels such as Winter Contingency and Pillar of Autumn!

We all have our reasons for erasing personal data from a phone. Whether you just ended a bad relationship whose face you never want to see again (lots of text messages) or just want to restore your privacy on the cell phone, erasing may be your only option.

If you use Microsoft Excel on a regular basis, odds are you work with numbers. Put those numbers to work. Statistical analysis allows you to find patterns, trends and probabilities within your data. In this MS Excel tutorial from everyone's favorite Excel guru, YouTube's ExcelsFun, the 27th installment in his "Excel Statistics" series of free video lessons, you'll learn how to create a quantitative data dot plot chart using the REPT and COUNTIF functions.

If you use Microsoft Excel on a regular basis, odds are you work with numbers. Put those numbers to work. Statistical analysis allows you to find patterns, trends and probabilities within your data. In this MS Excel tutorial from everyone's favorite Excel guru, YouTube's ExcelsFun, the 16th installment in his "Excel Statistics" series of free video lessons, you'll learn how to cross tabulate & do percentage cross tabulation for categorical data using a pivot table (PivotTable).

If you use Microsoft Excel on a regular basis, odds are you work with numbers. Put those numbers to work. Statistical analysis allows you to find patterns, trends and probabilities within your data. In this MS Excel tutorial from everyone's favorite Excel guru, YouTube's ExcelsFun, the 17th installment in his "Excel Statistics" series of free video lessons, you'll learn how to cross tabulate & do percentage cross tabulation for categorical data using formulas rather than pivot tables.

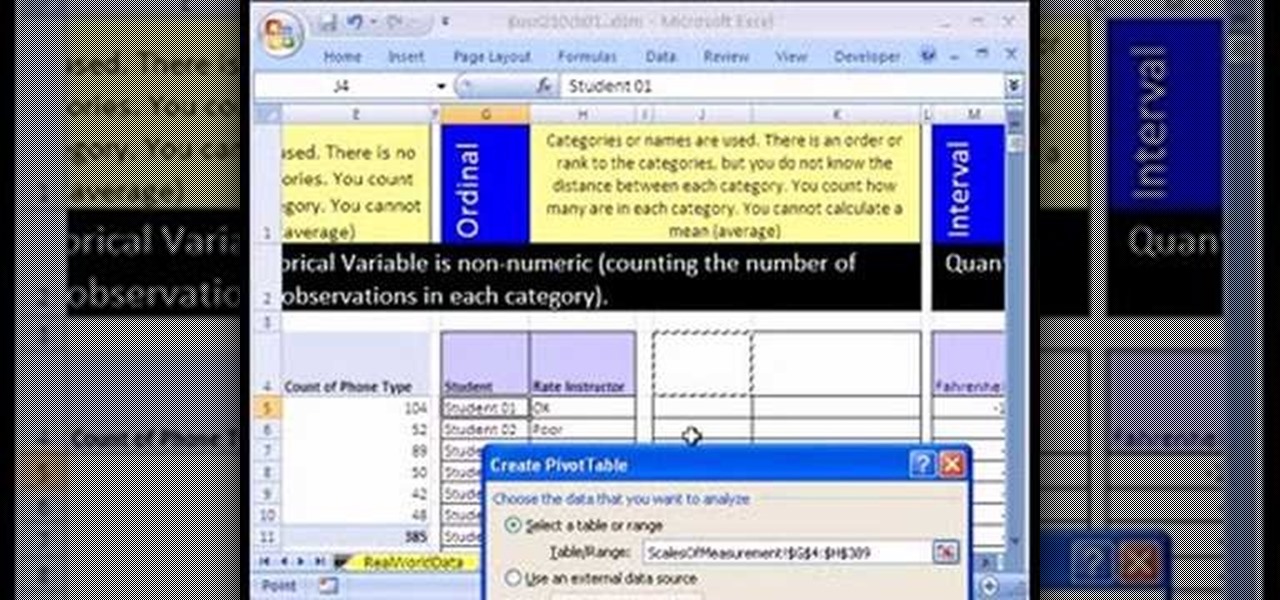
If you use Microsoft Excel on a regular basis, odds are you work with numbers. Put those numbers to work. Statistical analysis allows you to find patterns, trends and probabilities within your data. In this MS Excel tutorial from everyone's favorite Excel guru, YouTube's ExcelsFun, the 10th installment in his "Excel Statistics" series of free video lessons, you'll learn how about data sets and the nominal, ordinal, interval and ration scales/levels of measurement and see two Pivot Tables that...

Data can be troubling, especially if there's a ton of it plaguing your Excel worksheet. But Excel 2008 for Mac makes life a little easier and less confusing thanks to a few worksheet tips and features you can utilize to work with your data in worksheet cells. The Microsoft Office for Mac team shows you just how to work with worksheets in this how-to video.

Not every client or coworker likes to mine through a spreadsheet to find all the important data. So, with Excel 2008 for Mac, you can easily share that data without sending the entire Excel spreadsheet. To do this, all you need to do is to use the "copy as picture" option. The Microsoft Office for Mac team shows you just how to insert a spreadsheet snippet in this how-to video.

There is so much information in the world that trying to make sense of it all can be daunting. That's where data analytics comes in. By learning how to inspect and model data, you can take large data sets and transform them into highly valuable information that can take any business further.

Data is king. Nearly every carrier and MVNO offers unlimited talk and text with their cellular plans. Where they differ is the amount of data available, so that's the part that can save or cost you the most money.

Personal data is a hot topic right now, and for good reason. Never before has the public been so on edge about how companies use their information. Services like Facebook and Google now allow you to download all of the data each has on file. Soon, you'll be able to see exactly the same for Apple as well.

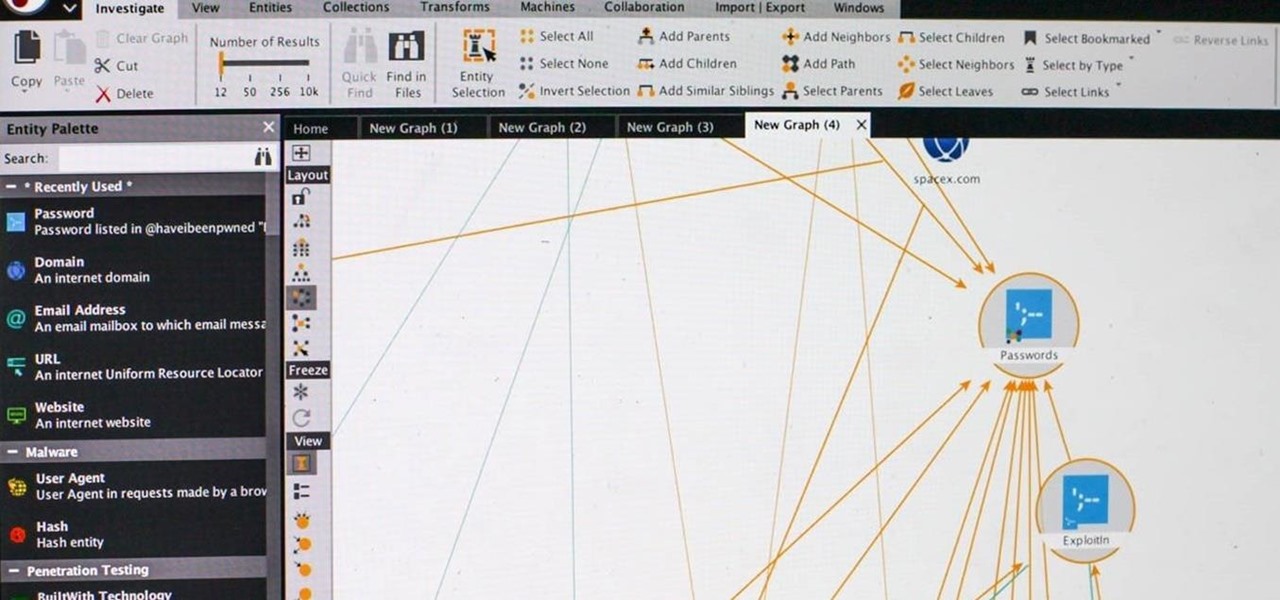
The easiest way around a security policy is to find users who don't follow it. The Have I Been Pwned database identifies accounts with information breached by major third parties like Yahoo and LinkedIn. With Maltego, hackers can locate breached accounts created using company email addresses, potentially giving attackers access to a company account if the employee reuses a compromised password.

Identifying vulnerable devices and services on a target router can be difficult without leaving logs and other traces of an active attacker on the network. However, there is a way to covertly decrypt and view Wi-Fi activity without ever connecting to the wireless network.

With the raw, visceral feeling of zooming around on the open road, it's easy to get carried away when you're out for a ride on your chopper, super bike, or scooter. This increases your chances of getting lost, plus routes can differ slightly for motorcyclists and cagers, unbeknownst to most drivers. Luckily, Waze has rolled out a feature that caters specifically to bikers.

The pictures we upload online are something we tend to think of as self-expression, but these very images can carry code to steal our passwords and data. Profile pictures, avatars, and image galleries are used all over the internet. While all images carry digital picture data — and many also carry metadata regarding camera or photo edits — it's far less expected that an image might actually be hiding malicious code.

Data for mapping and other applications is the lifeblood of machine-driven cars, and so far, Tesla has taken a definitive lead in information it has gathered ahead of other driverless players, including Waymo.

Technology has progressed by leaps and bounds and has blessed people in a number of ways, but at the same time, it has troubled them also. Computers are now used in every aspect of life. No matter if you are a businessman, an employee, a student, or even a housewife, a computer can assist you in your routine work. You save your personal information, documents, and other similar sensitive stuff on your computer that can hurt you if they get compromised.


