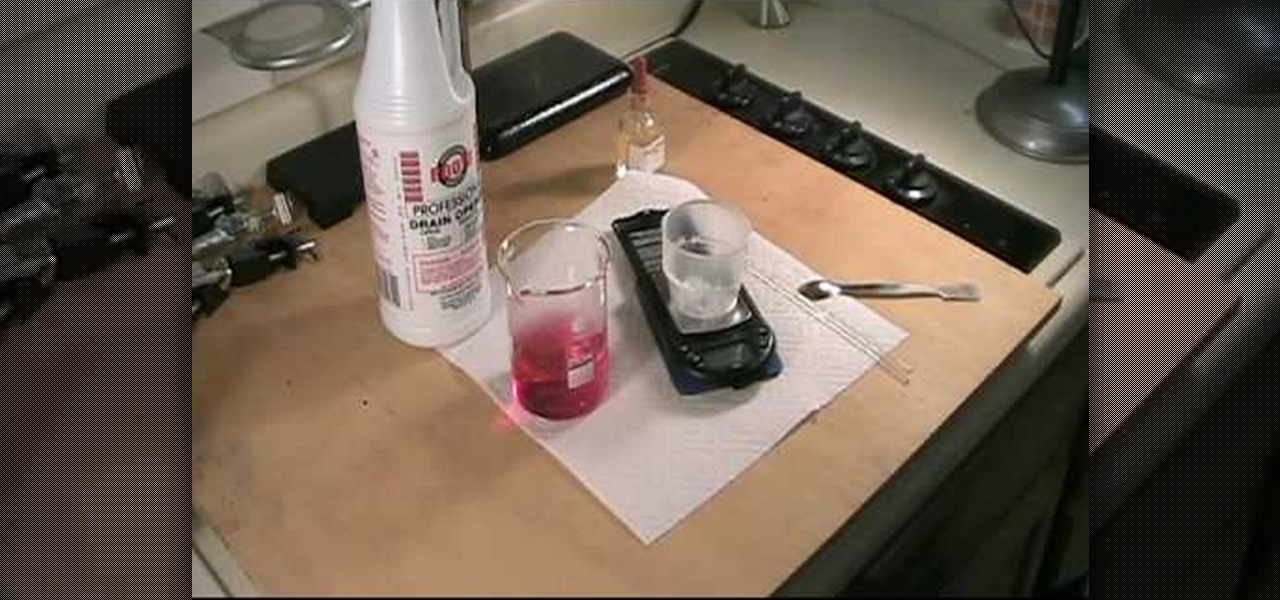
This video is based on a chemistry experiment. This video is going to explain to us how to use gravimetric analysis in order to analyze sulfuric acid. This experiment should not be done for those who do not have a fundamental knowledge of chemical compounds, reactions and chemical safety. He explains first what he is about to do before he does it. Sulfuric acid is acidic and can be toxic if ingested or in contact with the eyes. Take extreme care with this experiment.
Shrimp skewers are delish, and go especially well with some fresh made marinara sauce. But sometimes you want a deeper, richer flavor in the meat itself.

Nick at Greyscale Gorilla shows you how to do gamma correction at 2.2 in Cinema 4D. Opening up your gamma will allow you to see deeper into the shadows and the highlights while still keeping a crisp image.

Here are some meditation tips from Tara Stiles. Tara Stiles is a revered Ford Models yoga instructor. Meditation is a mental discipline by which one attempts to get beyond the conditioned, "thinking" mind into a deeper state of relaxation or awareness. Meditation often involves turning attention to a single point of reference. It is recognized as a component of almost all religions, and has been practiced for over 5,000 years.

Bert delves deeper into re-touching with Photoshop and shows us how to create two moody scenes from different images. You can do more with retouching than just fixing blemishes, as shown in this Photoshop tutorial.

Anyone can blow bubbles with that soap formula and a bubble wand, but what about blowing bubbles rings underwater. It surprisingly, isn't too much different from blowing regular bubbles underwater. You'll need to be able to hold your breath for a long time and to be able to stay under the water's surface (the deeper you can go, the longer the bubble ring will last). Watch this video bubble-blowing tutorial and learn how to blow bubble rings underwater.

This chess tutorial from Grandmaster Alexandra Kosteniuk is a perfect example of Retrograde Analysis.
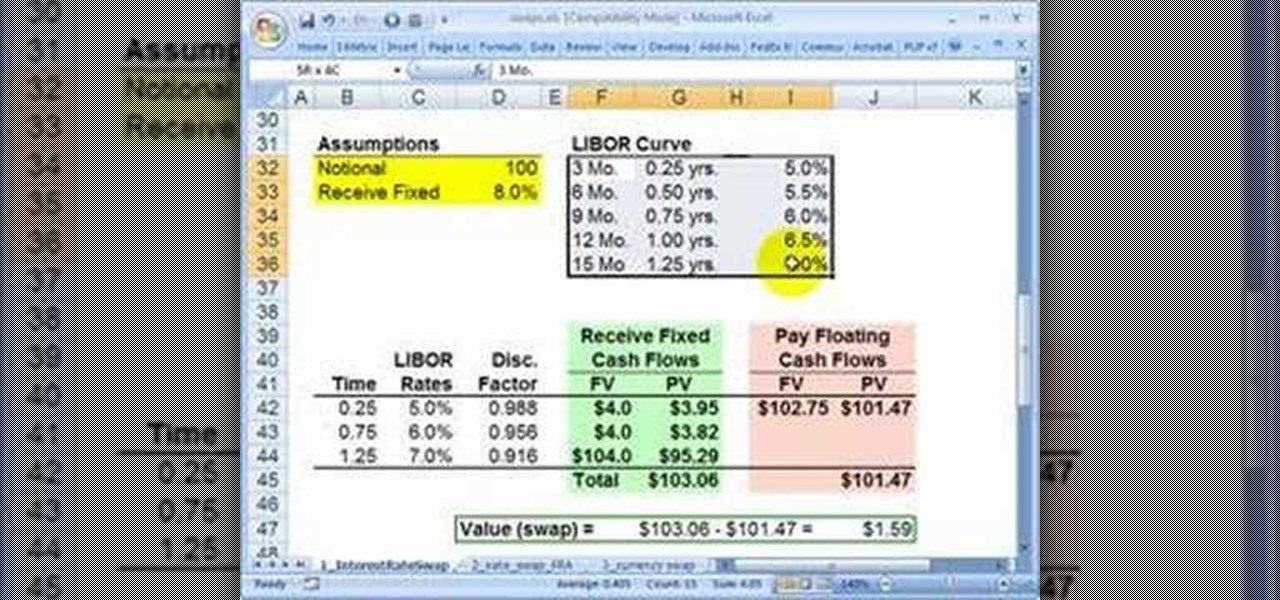
High finance and statistical analysis are too complex for most people once they forget what they learned in high school. If you are an investor or small business owner, you can't afford to forget this stuff. This video will teach you how to value an interest rate swap, good info for financial professionals and students.
If you use Microsoft Excel on a regular basis, odds are you work with numbers. Put those numbers to work. Statistical analysis allows you to find patterns, trends and probabilities within your data. In this MS Excel tutorial from everyone's favorite Excel guru, YouTube's ExcelsFun, the 45th installment in his "Excel Statistics" series of free video lessons, you'll learn how to see how to calculate a z-score.
If you use Microsoft Excel on a regular basis, odds are you work with numbers. Put those numbers to work. Statistical analysis allows you to find patterns, trends and probabilities within your data. In this MS Excel tutorial from everyone's favorite Excel guru, YouTube's ExcelsFun, the 35.2nd installment in his "Excel Statistics" series of free video lessons, you'll learn how to use Excel's GEOMEAN function to find geometric mean.
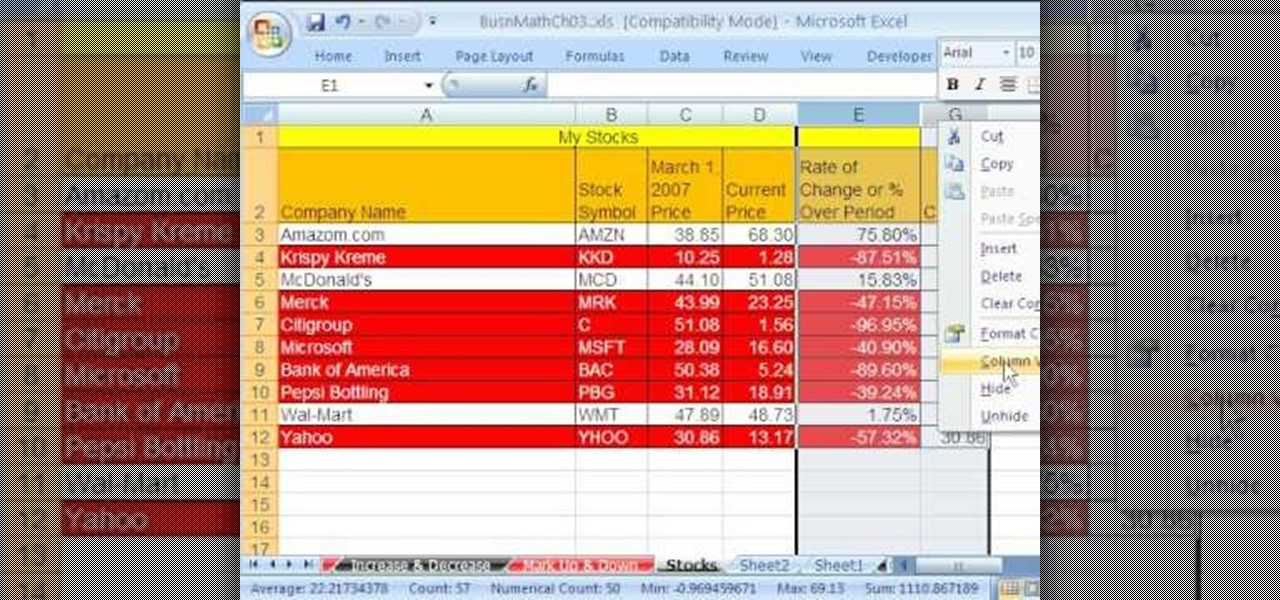
As you might guess, one of the domains in which Microsoft Excel really excels is business math. Brush up on the stuff for your next or current job with this how-to. In this tutorial from everyone's favorite digital spreadsheet guru, YouTube's ExcelIsFun, the 33rd installment in his "Excel Business Math" series of free video lessons, you'll learn how to add current stock prices to a stock analysis table in Excel using a web query.
If you use Microsoft Excel on a regular basis, odds are you work with numbers. Put those numbers to work. Statistical analysis allows you to find patterns, trends and probabilities within your data. In this MS Excel tutorial from everyone's favorite Excel guru, YouTube's ExcelsFun, the 40th installment in his "Excel Statistics" series of free video lessons, you'll learn how to calculate range & interquartile range for variability using the MAX, MIN, QUARTILE functions.
If you use Microsoft Excel on a regular basis, odds are you work with numbers. Put those numbers to work. Statistical analysis allows you to find patterns, trends and probabilities within your data. In this MS Excel tutorial from everyone's favorite Excel guru, YouTube's ExcelsFun, the 86th installment in his "Excel Statistics" series of free video lessons, you'll learn how to construct confidence intervals for proportions using NORMSINV function and other formulas.
If you use Microsoft Excel on a regular basis, odds are you work with numbers. Put those numbers to work. Statistical analysis allows you to find patterns, trends and probabilities within your data. In this MS Excel tutorial from everyone's favorite Excel guru, YouTube's ExcelsFun, the 87th installment in his "Excel Statistics" series of free video lessons, you'll learn how to calculate sample size (n) for confidence intervals.
If you use Microsoft Excel on a regular basis, odds are you work with numbers. Put those numbers to work. Statistical analysis allows you to find patterns, trends and probabilities within your data. In this MS Excel tutorial from everyone's favorite Excel guru, YouTube's ExcelsFun, the 27th installment in his "Excel Statistics" series of free video lessons, you'll learn how to create a quantitative data dot plot chart using the REPT and COUNTIF functions.
If you use Microsoft Excel on a regular basis, odds are you work with numbers. Put those numbers to work. Statistical analysis allows you to find patterns, trends and probabilities within your data. In this MS Excel tutorial from everyone's favorite Excel guru, YouTube's ExcelsFun, the 26th installment in his "Excel Statistics" series of free video lessons, you'll learn how to create quantitative data cumulative frequency distributions with pivot tables.
If you use Microsoft Excel on a regular basis, odds are you work with numbers. Put those numbers to work. Statistical analysis allows you to find patterns, trends and probabilities within your data. In this MS Excel tutorial from everyone's favorite Excel guru, YouTube's ExcelsFun, the 16th installment in his "Excel Statistics" series of free video lessons, you'll learn how to cross tabulate & do percentage cross tabulation for categorical data using a pivot table (PivotTable).
If you use Microsoft Excel on a regular basis, odds are you work with numbers. Put those numbers to work. Statistical analysis allows you to find patterns, trends and probabilities within your data. In this MS Excel tutorial from everyone's favorite Excel guru, YouTube's ExcelsFun, the 19th installment in his "Excel Statistics" series of free video lessons, you'll learn how to group categories in a frequency distribution with a formula (2 COUNTIF) and the pivot table (PivotTable) grouping fea...
If you use Microsoft Excel on a regular basis, odds are you work with numbers. Put those numbers to work. Statistical analysis allows you to find patterns, trends and probabilities within your data. In this MS Excel tutorial from everyone's favorite Excel guru, YouTube's ExcelsFun, the 17th installment in his "Excel Statistics" series of free video lessons, you'll learn how to cross tabulate & do percentage cross tabulation for categorical data using formulas rather than pivot tables.
If you use Microsoft Excel on a regular basis, odds are you work with numbers. Put those numbers to work. Statistical analysis allows you to find patterns, trends and probabilities within your data. In this MS Excel tutorial from everyone's favorite Excel guru, YouTube's ExcelsFun, the 35th installment in his "Excel Statistics" series of free video lessons, you'll learn how to calculate weighted and geometric means and see how to use the GEOMEAN function.
If you use Microsoft Excel on a regular basis, odds are you work with numbers. Put those numbers to work. Statistical analysis allows you to find patterns, trends and probabilities within your data. In this MS Excel tutorial from everyone's favorite Excel guru, YouTube's ExcelsFun, the 33rd installment in his "Excel Statistics" series of free video lessons, you'll learn how to use the AVEARGE, MEDIAN, MODE, PERCENTILE, QUARTILE and PERCENTILERANK functions to measure location.
If you use Microsoft Excel on a regular basis, odds are you work with numbers. Put those numbers to work. Statistical analysis allows you to find patterns, trends and probabilities within your data. In this MS Excel tutorial from everyone's favorite Excel guru, YouTube's ExcelsFun, the 4th installment in his "Excel Statistics" series of free video lessons, you'll learn how to create a frequency table and percentage frequency table using a Pivot Table (PivotTable).
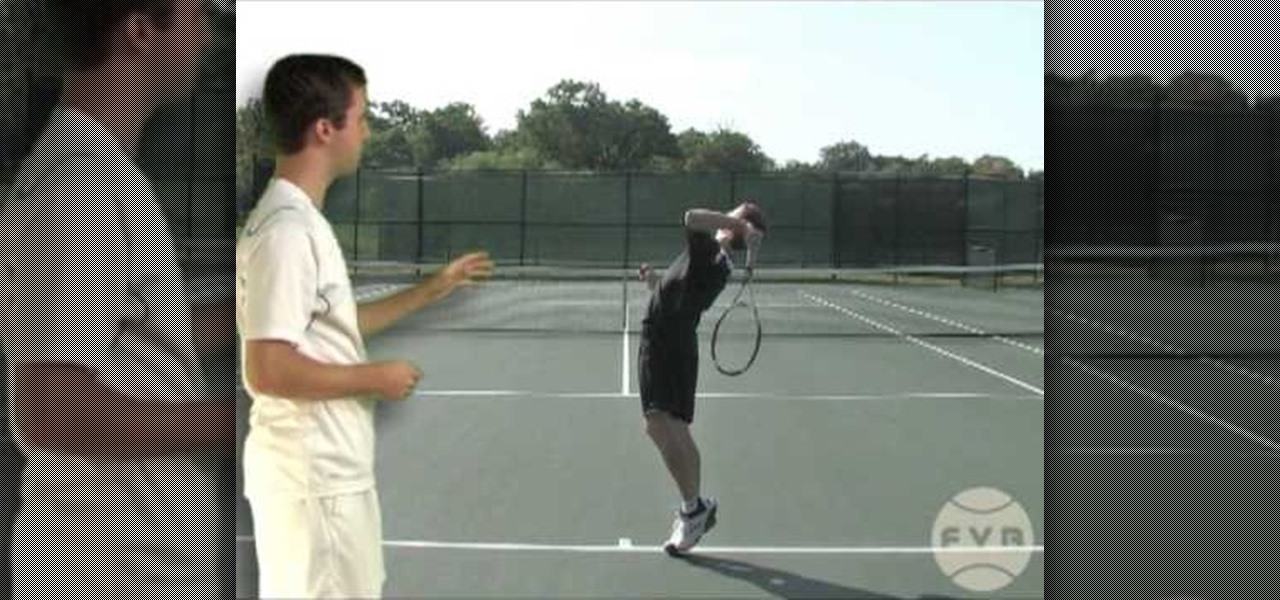
Welcome to a tennis lesson from FuzzyYellowBalls, the the best place to learn how to play tennis online. Our free video tennis lessons teach you how to play the game in a new way that combines technical analysis, visual learning, and step-by-step progressions.
Welcome to a tennis lesson from FuzzyYellowBalls, the the best place to learn how to play tennis online. Our free video tennis lessons teach you how to play the game in a new way that combines technical analysis, visual learning, and step-by-step progressions.
This tutorial goes over how to perform ni-cho zai. This kata utilizes 2 zai (sais), and the video includes the bunkai, or step-by-step analysis.
Watch this fine art video tutorial to learn how to master drawing an angry human eye in two minutes.
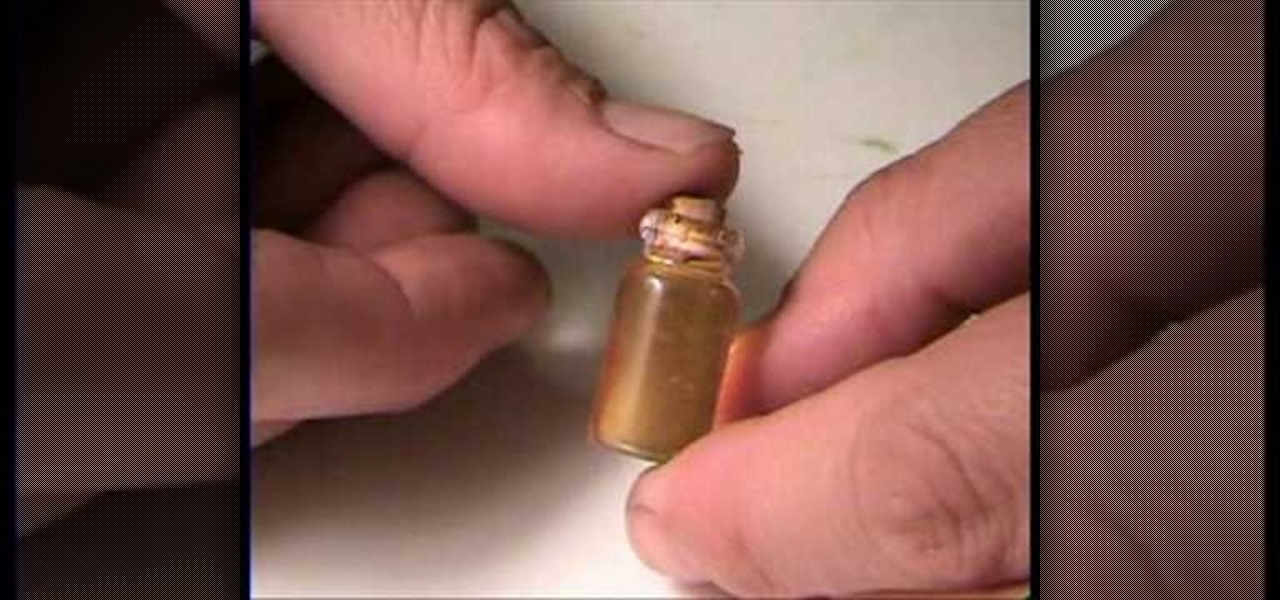
Making a dollhouse is fun especially when you do it with your little one. It can be a great time to bond with your daughter on a deeper level! When making a kitchen, one thing that you can put up on the shelf is a jar of honey. In this video you will get a quick tutorial on how to create your own with real honey!
Did you know that over a million people a year suffer from the effect of burns and over 1/3 of them wind up in the emergency room? If you have a burn of any kind, check out this clip. Dr. Savant will teach you exactly how to deal with burns of all degrees, from slight surface burns to deeper, higher degree singes. So, check out this clip and prepare, just in case!
In this video Jesse Liberty dives deeper into data-binding, demonstrating in detail how to create business classes that represent data retrieved from a web service, and how to bind them to various controls using a combination of Blend and Visual Studio. This is a detailed, easy to follow video, to help you use the program, and all it entails.
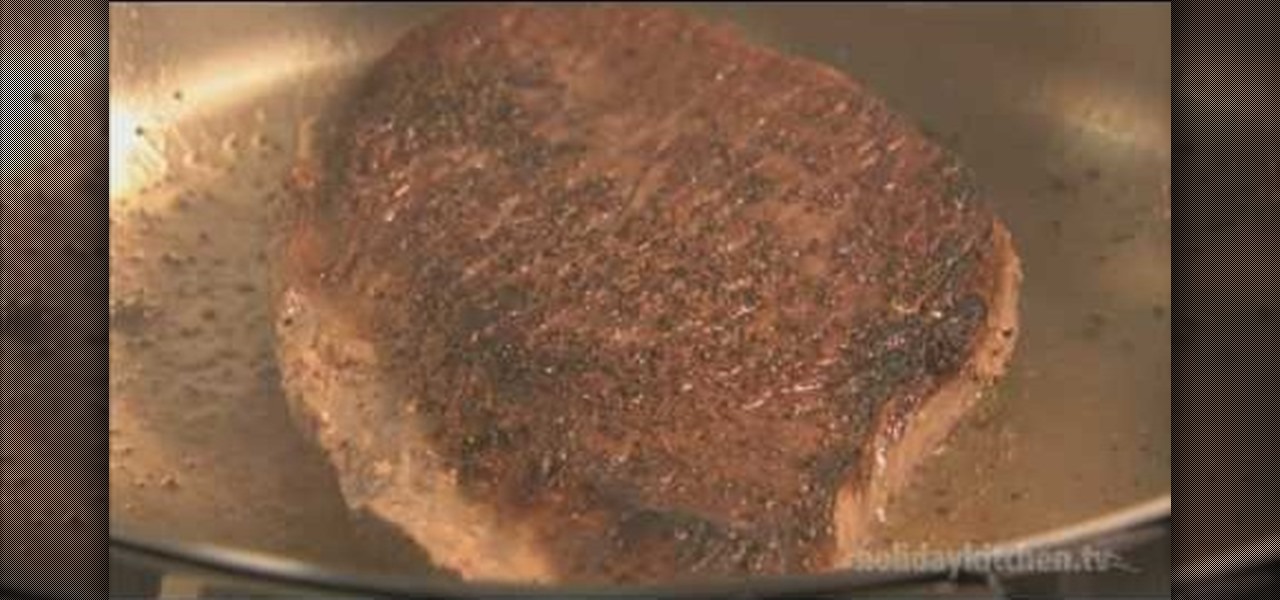
Learn how to sear meat when cooking. Searing meat is the process for caramelizing the sugars and browning the proteins present in meat and poultry, creating richer color and deeper flavor, and an appealing crust. To sear meat cuts, you'll need your meat or poultry, skillet, salt, pepper, and vegetable oil.
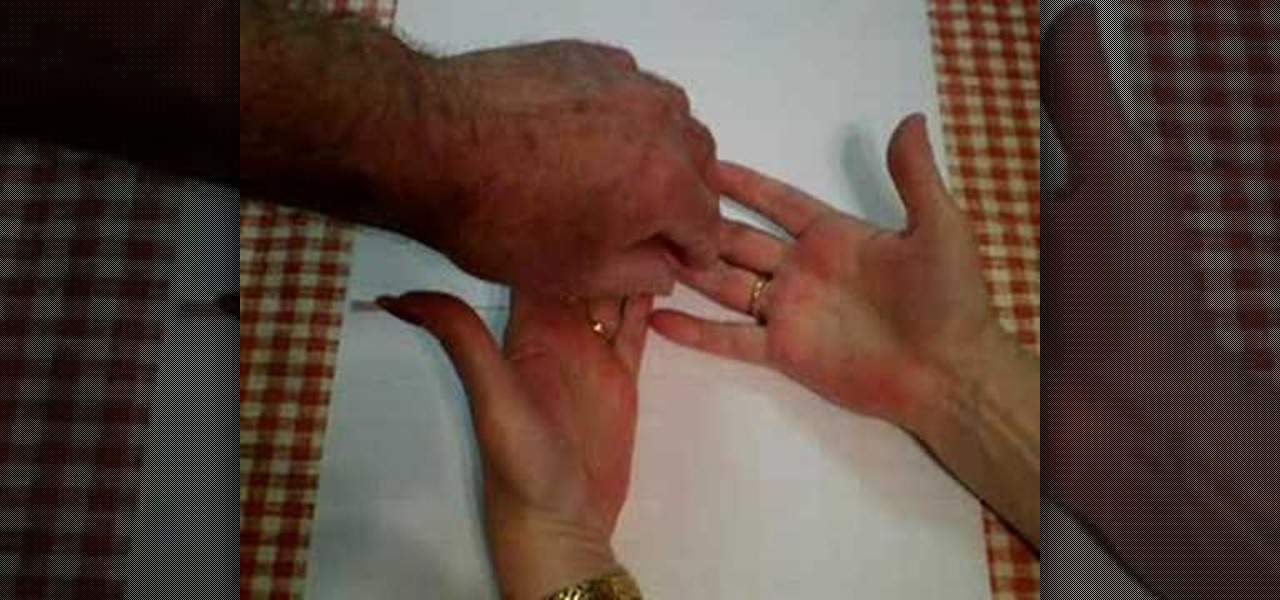
Astrologist and palmist Peter John demonstrates some of the basics of palm-reading in this how-to video. Everything from the lines in the hand to way the hands are held can reveal deeper meanings about a personality. This lesson covers the significance of the space between the fingers. Watch this video palmistry tutorial from Peter John and learn how to interpret the meaning of the space between the fingers when palm reading.
This do-it-yourself air filtration will keep the air in your house feeling fresh. All you need is a cheap box fan and an air filter (the MERV 11 is recommended). Watch this video tutorial and learn how to make an easy air filter and breathe a little deeper at home.
Peter John explains the meaning behind individual tarot cards in this video tutorial. The king of pentacles, the king of swords, the king of cups, and the king of wands all have a deeper understanding within a tarot card reading. Watch this tarot reading how to and learn how to predict and uncover the future by understanding the meaning of the king card.
Peter John explains the meaning behind individual tarot cards in this video tutorial. The queen of pentacles, the queen of swords, the queen of cups, and the queen of wands all have a deeper understanding within a tarot card reading. Watch this tarot reading how to and learn how to predict and uncover the future by understanding the meaning of the queen card.
Peter John explains the meaning behind individual tarot cards in this video tutorial. The knight of pentacles, the knight of swords, the knight of cups, and the knight of wands all have a deeper understanding within a tarot card reading. Watch this tarot reading how to and learn how to predict and uncover the future by understanding the meaning of the knight card.
Peter John explains the meaning behind individual tarot cards in this video tutorial. The ten of pentacles, the ten of swords, the ten of cups, and the ten of wands all have a deeper understanding within a tarot card reading. Watch this tarot reading how to and learn how to predict and uncover the future by understanding the meaning of the ten cards.
This how-to video introduces bound poses in yoga. Bound poses use interlocking body parts to take a yoga stretch deeper. Many people don't know where to start with these kind of poses, so we hope this yoga how-to video helps you unlock the mystery.
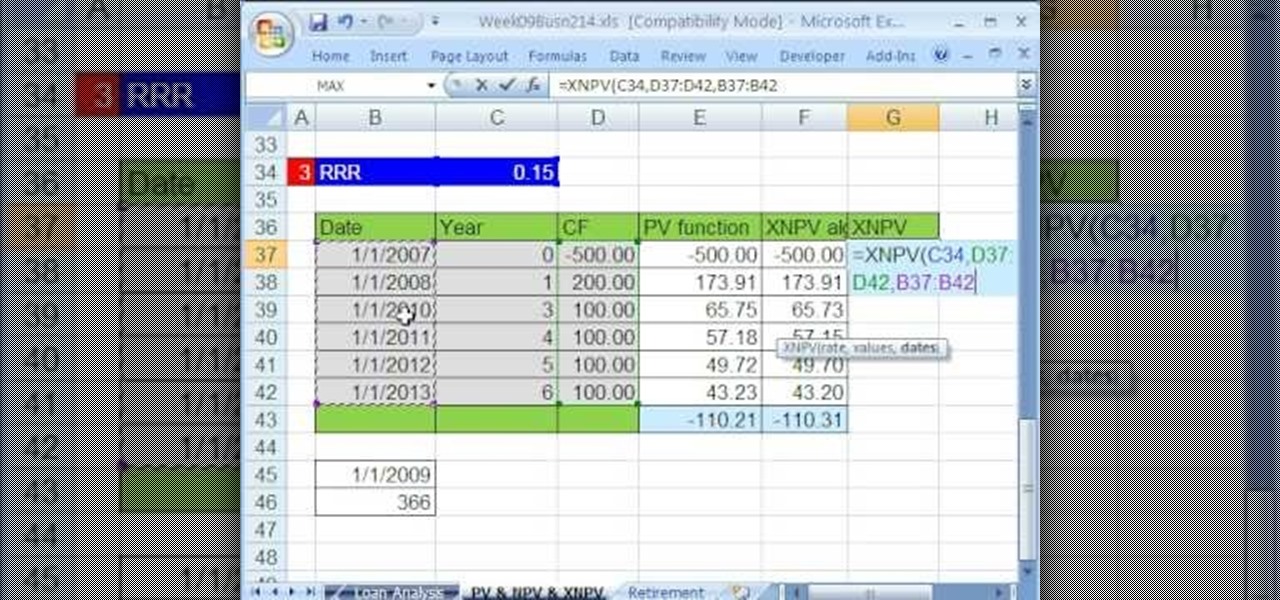
Whether you're interested in learning Microsoft Excel from the bottom up or just looking to pick up a few tips and tricks, you're in the right place. In this tutorial from everyone's favorite digital spreadsheet guru, ExcelIsFun, the 50th installment in his "Highline Excel Class" series of free video Excel lessons, you'll learn how to value an asset as well as perform discounted cash flow analysis with the Excel functions PV, NPV & XNPV.
If you use Microsoft Excel on a regular basis, odds are you work with numbers. Put those numbers to work. Statistical analysis allows you to find patterns, trends and probabilities within your data. In this MS Excel tutorial from everyone's favorite Excel guru, YouTube's ExcelsFun, the 44th installment in his "Excel Statistics" series of free video lessons, you'll learn how to use the SKEW function to calculate the skew in a distribution of data.
f you use Microsoft Excel on a regular basis, odds are you work with numbers. Put those numbers to work. Statistical analysis allows you to find patterns, trends and probabilities within your data. In this MS Excel tutorial from everyone's favorite Excel guru, YouTube's ExcelsFun, the 37th installment in his "Excel Statistics" series of free video lessons, you'll learn how to use the PERCENTILE and QUARTILE functions.