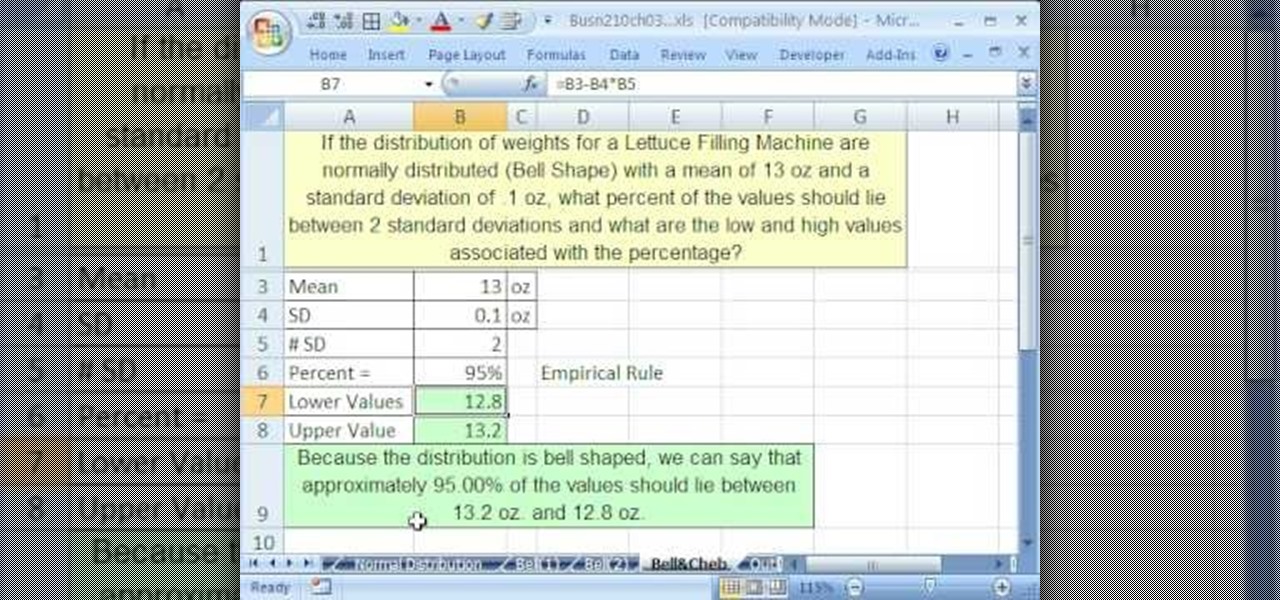
If you use Microsoft Excel on a regular basis, odds are you work with numbers. Put those numbers to work. Statistical analysis allows you to find patterns, trends and probabilities within your data. In this MS Excel tutorial from everyone's favorite Excel guru, YouTube's ExcelsFun, the 47th installment in his "Excel Statistics" series of free video lessons, you'll learn about the basics of the empirical rule (the bell curve) and how to apply it in various ways.

If you use Microsoft Excel on a regular basis, odds are you work with numbers. Put those numbers to work. Statistical analysis allows you to find patterns, trends and probabilities within your data. In this MS Excel tutorial from everyone's favorite Excel guru, YouTube's ExcelsFun, the 89th installment in his "Excel Statistics" series of free video lessons, you'll learn how to use the NORMSINV function for critical values and the NORSDIST function for p-values.

If you use Microsoft Excel on a regular basis, odds are you work with numbers. Put those numbers to work. Statistical analysis allows you to find patterns, trends and probabilities within your data. In this MS Excel tutorial from everyone's favorite Excel guru, YouTube's ExcelsFun, the 91st installment in his "Excel Statistics" series of free video lessons, you'll learn how to use TINV and TDIST functions to find critical values given an unknown sigma value.

If you use Microsoft Excel on a regular basis, odds are you work with numbers. Put those numbers to work. Statistical analysis allows you to find patterns, trends and probabilities within your data. In this MS Excel tutorial from everyone's favorite Excel guru, YouTube's ExcelsFun, the 80th installment in his "Excel Statistics" series of free video lessons, you'll learn how to construct confidence intervals when the sigma is known known using the CONFIDENCE and NORMSINV functions.

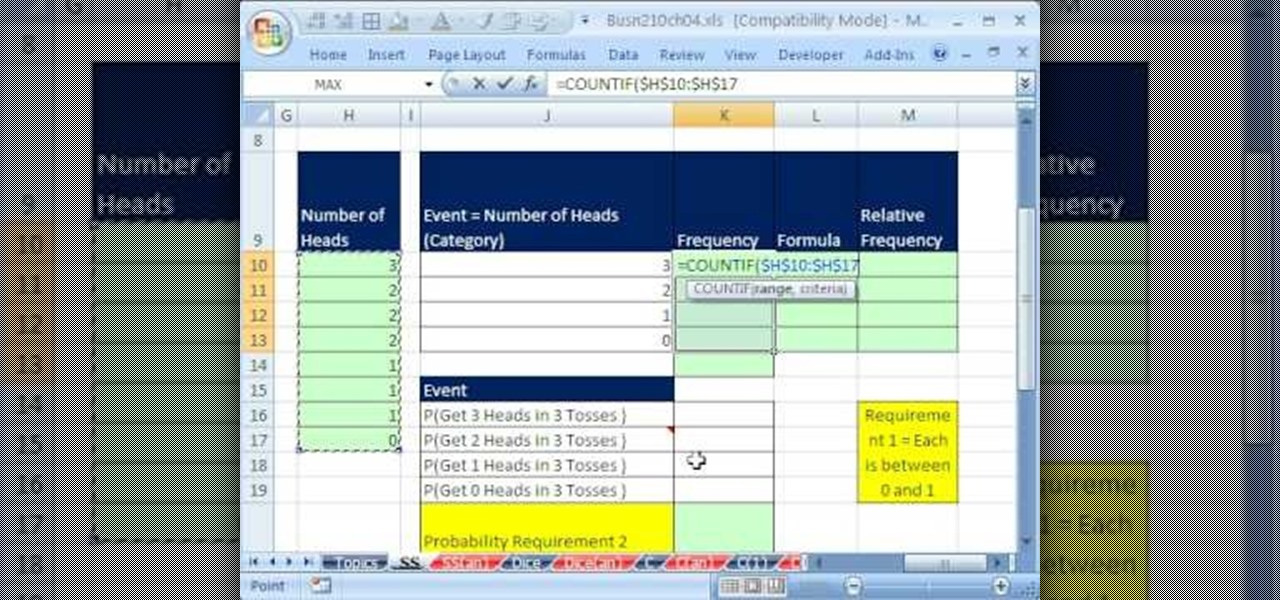
If you use Microsoft Excel on a regular basis, odds are you work with numbers. Put those numbers to work. Statistical analysis allows you to find patterns, trends and probabilities within your data. In this MS Excel tutorial from everyone's favorite Excel guru, YouTube's ExcelsFun, the 21st installment in his "Excel Statistics" series of free video lessons, you'll learn how to build labels and counting formulas for a frequency distribution.

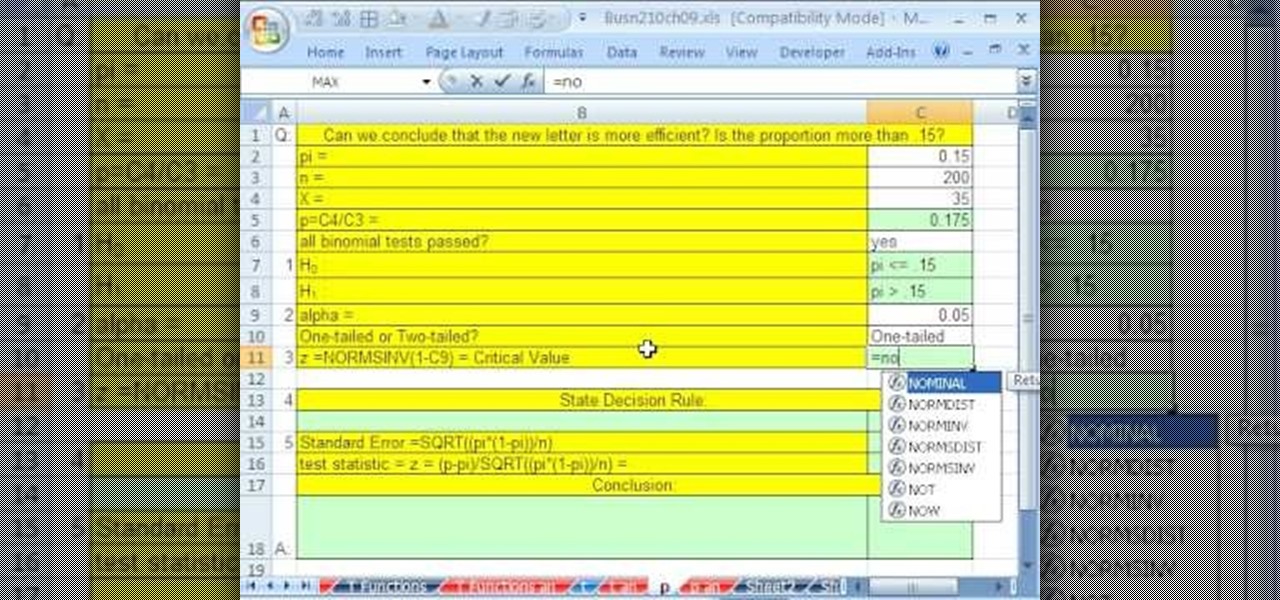
If you use Microsoft Excel on a regular basis, odds are you work with numbers. Put those numbers to work. Statistical analysis allows you to find patterns, trends and probabilities within your data. In this MS Excel tutorial from everyone's favorite Excel guru, YouTube's ExcelsFun, the 87th installment in his "Excel Statistics" series of free video lessons, you'll learn how to use NORMSINV to test a hypothesis with population standard deviation (sigma) known and proportions.

If you use Microsoft Excel on a regular basis, odds are you work with numbers. Put those numbers to work. Statistical analysis allows you to find patterns, trends and probabilities within your data. In this MS Excel tutorial from everyone's favorite Excel guru, YouTube's ExcelsFun, the 28th installment in his "Excel Statistics" series of free video lessons, you'll learn how to create quantitative data stem & leaf charts using the REPT and COUNTIF functions.
If you use Microsoft Excel on a regular basis, odds are you work with numbers. Put those numbers to work. Statistical analysis allows you to find patterns, trends and probabilities within your data. In this MS Excel tutorial from everyone's favorite Excel guru, YouTube's ExcelsFun, the 13th installment in his "Excel Statistics" series of free video lessons, you'll learn how to create a column chart from a frequency distribution for categorical data.
If you use Microsoft Excel on a regular basis, odds are you work with numbers. Put those numbers to work. Statistical analysis allows you to find patterns, trends and probabilities within your data. In this MS Excel tutorial from everyone's favorite Excel guru, YouTube's ExcelsFun, the 5th installment in his "Excel Statistics" series of free video lessons, you'll learn how to use relative and absolute cell references to save time when writing formulas.
Need some help improving your golf game? Ever hear of stack and tilt? Want to learn what all the fuss is about? Check out Brady Riggs’ analysis of Eric Axley’s full swing and find out about the “stack & tilt” technique. See exactly how to do this golf move for a better golf swing.
The Nessus vulnerability scanner, is the world-leader in active scanners, featuring high speed discovery, configuration auditing, asset profiling, sensitive data discovery and vulnerability analysis of your security posture. Nessus scanners can be distributed throughout an entire enterprise, inside DMZs, and across physically separate networks. In this network security video tutorial, you'll learn how to hack a network using Nessus 3.
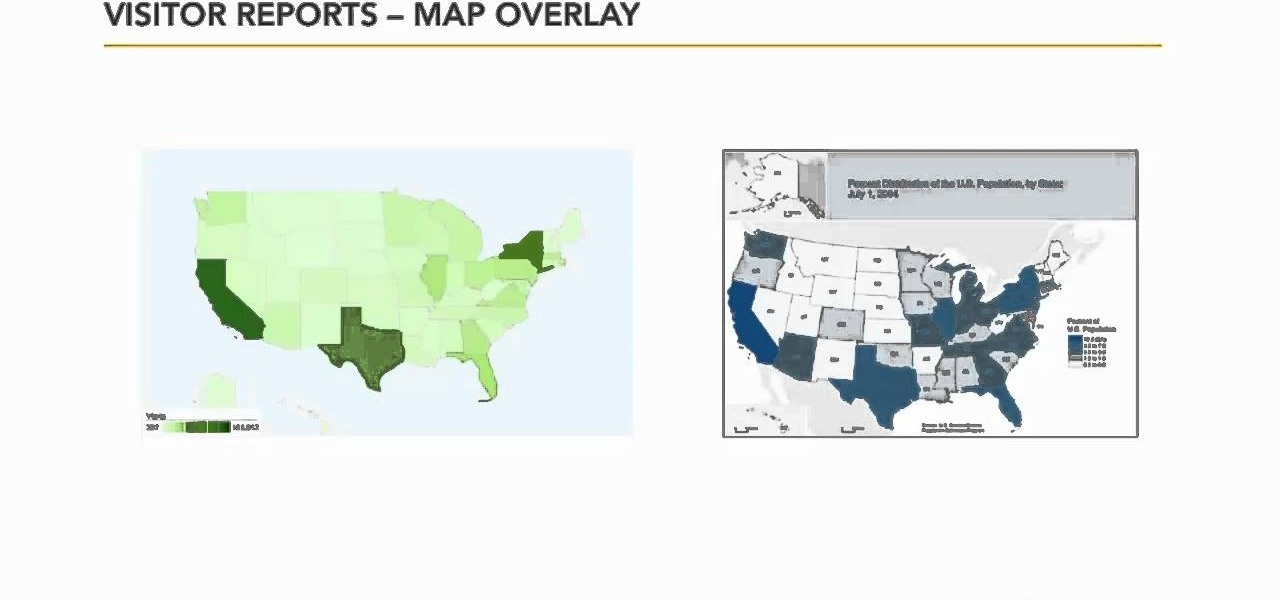
In this video tutorial, we learn how to use the Map Overlay feature when using the Google Analytics web tracking service. Whether you're new to Google's popular web analytics platform or a seasoned pro merely looking to pick up a few new tips and tricks, you're sure to be well served by this free video tutorial from Lynda.
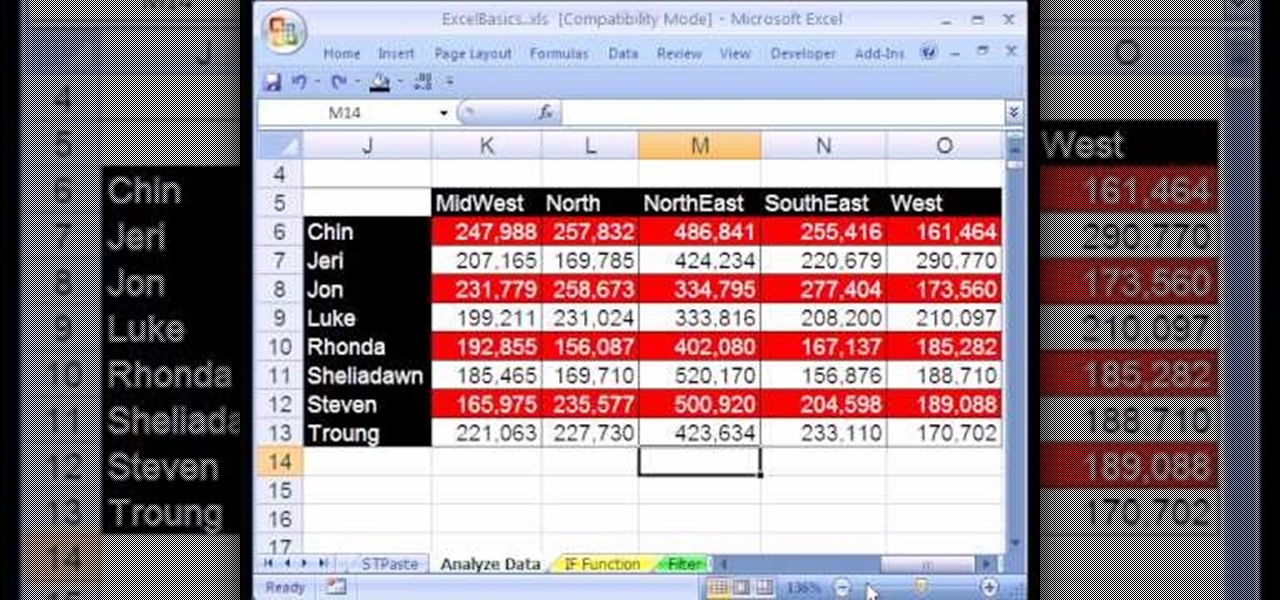
If you're looking to learn how to use Microsoft Excel, a video series from digital spreadsheet guru ExcelIsFun is a great place to start. But which of his many series should you choose? The one titled "Excel Basics," that's which! In this free video MS Excel lesson, the 20th installment in said basics series, you'll learn how to use pivot tables (PivotTables) to analyze and summarize data.
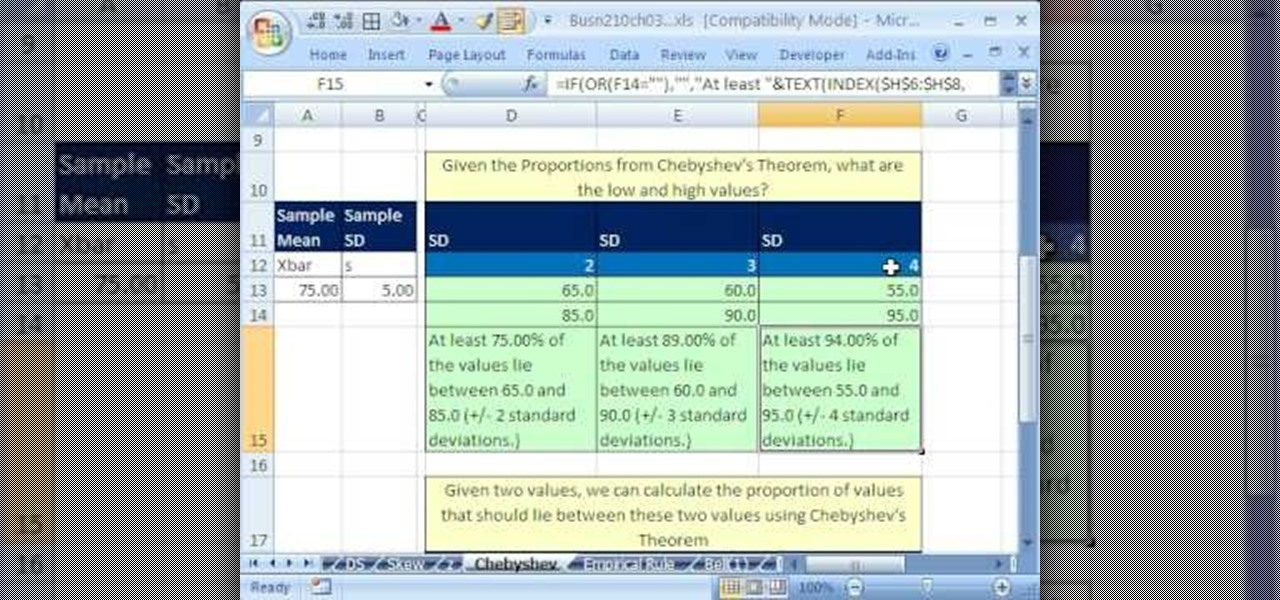
If you use Microsoft Excel on a regular basis, odds are you work with numbers. Put those numbers to work. Statistical analysis allows you to find patterns, trends and probabilities within your data. In this MS Excel tutorial from everyone's favorite Excel guru, YouTube's ExcelsFun, the 48th installment in his "Excel Statistics" series of free video lessons, you'll see comparison of Chebyshev's Theorem and the Empirical Rule (bell curve) and learn when to apply which.
If you use Microsoft Excel on a regular basis, odds are you work with numbers. Put those numbers to work. Statistical analysis allows you to find patterns, trends and probabilities within your data. In this MS Excel tutorial from everyone's favorite Excel guru, YouTube's ExcelsFun, the 46th installment in his "Excel Statistics" series of free video lessons, you'll learn about Chebyshev's Theorem and how to apply it in three different ways.
If you use Microsoft Excel on a regular basis, odds are you work with numbers. Put those numbers to work. Statistical analysis allows you to find patterns, trends and probabilities within your data. In this MS Excel tutorial from everyone's favorite Excel guru, YouTube's ExcelsFun, the 42nd installment in his "Excel Statistics" series of free video lessons, you'll learn how to calculate the coefficient of variation.
If you use Microsoft Excel on a regular basis, odds are you work with numbers. Put those numbers to work. Statistical analysis allows you to find patterns, trends and probabilities within your data. In this MS Excel tutorial from everyone's favorite Excel guru, YouTube's ExcelsFun, the 30th installment in his "Excel Statistics" series of free video lessons, you'll learn how to create a scatter diagram for 2 quantitative variables.
If you use Microsoft Excel on a regular basis, odds are you work with numbers. Put those numbers to work. Statistical analysis allows you to find patterns, trends and probabilities within your data. In this MS Excel tutorial from everyone's favorite Excel guru, YouTube's ExcelsFun, the 51st installment in his "Excel Statistics" series of free video lessons, you'll learn how to understand, work with and find simple probabilities in Microsoft Office Excel.
If you use Microsoft Excel on a regular basis, odds are you work with numbers. Put those numbers to work. Statistical analysis allows you to find patterns, trends and probabilities within your data. In this MS Excel tutorial from everyone's favorite Excel guru, YouTube's ExcelsFun, the 93rd installment in his "Excel Statistics" series of free video lessons, you'll learn how to use the NORMSINV and NORMSDIST functions to complete a hypothesis test about a population proportion.
If you use Microsoft Excel on a regular basis, odds are you work with numbers. Put those numbers to work. Statistical analysis allows you to find patterns, trends and probabilities within your data. In this MS Excel tutorial from everyone's favorite Excel guru, YouTube's ExcelsFun, the 83rd installment in his "Excel Statistics" series of free video lessons, you'll learn how to construct confidence intervals when the sigma (population standard deviation) in NOT known using the TINV function.
If you use Microsoft Excel on a regular basis, odds are you work with numbers. Put those numbers to work. Statistical analysis allows you to find patterns, trends and probabilities within your data. In this MS Excel tutorial from everyone's favorite Excel guru, YouTube's ExcelsFun, the 29th installment in his "Excel Statistics" series of free video lessons, you'll learn how to create quantitative data cross tabulation using a pivot table (PivotTable).
If you use Microsoft Excel on a regular basis, odds are you work with numbers. Put those numbers to work. Statistical analysis allows you to find patterns, trends and probabilities within your data. In this MS Excel tutorial from everyone's favorite Excel guru, YouTube's ExcelsFun, the 11th installment in his "Excel Statistics" series of free video lessons, you'll learn how to work with, and create charts for, cross-sectional and time-series data.
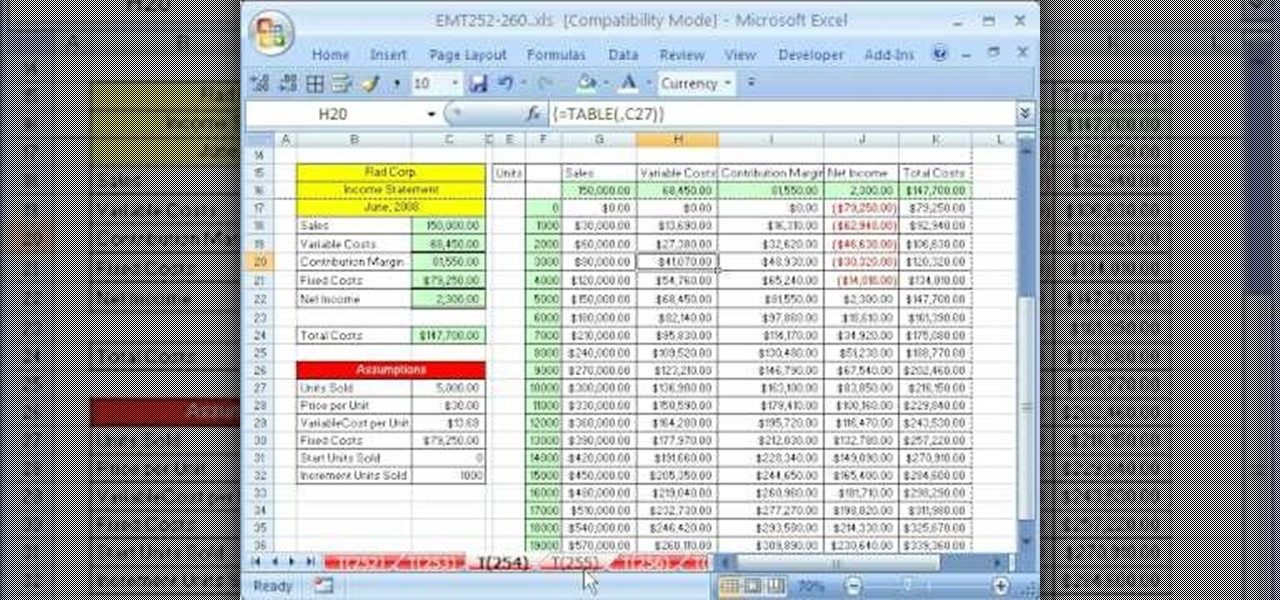
New to Microsoft Excel? Looking for a tip? How about a tip so mind-blowingly useful as to qualify as a magic trick? You're in luck. In this MS Excel tutorial from ExcelIsFun, the 254th installment in their series of digital spreadsheet magic tricks, you'll learn how to do contribution margin income statement analysis across various units using a one-variable data table.
Welcome to a tennis lesson from FuzzyYellowBalls, the the best place to learn how to play tennis online. Our free video tennis lessons teach you how to play the game in a new way that combines technical analysis, visual learning, and step-by-step progressions.
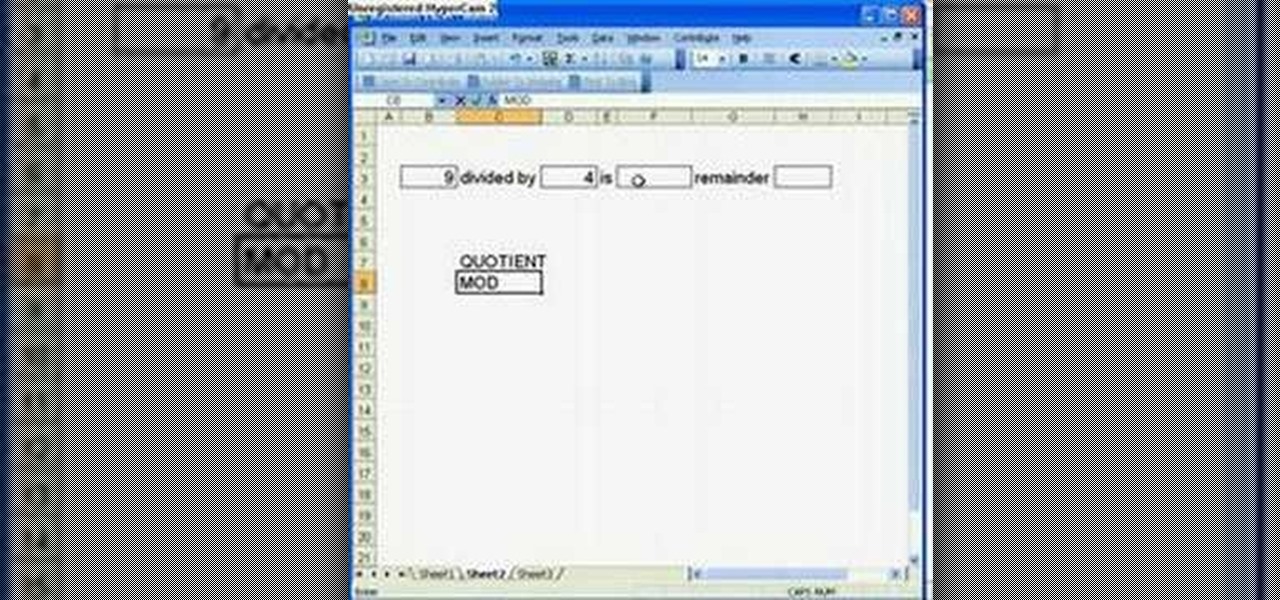
Microsoft Office Excel 2007 spreadsheet manager is a powerful tool that enables information workers to format spreadsheets, as well as analyze and share information to make more informed decisions. In this MS Excel video tutorial, you'll learn about the QUOTIENT and MOD functions. Note that, in urder to use these functions, you'll need to install the analysis ToolPak. For more information, watch this Excel how-to.
This video is a step-by-step analysis of each of the moves of the first bo kata, shu shi no kon, including what attack you are blocking and striking point on the opponent. A great way to learn these moves.
This video shows you how to perform timbei kata and gives an analysis (bunkai) of the timbei and rochin.
This video breaks down the kata, or form, utilizing the kama, the okinawan sickle. The second video gives an analysis (bunkai) of the kata. An excellent series that makes it easy to learn from.
San-cho zai is kata with three sai. This two part video shows you how to perform san-cho zai and then gives a more detailed explaination or analysis (called bunkai).
This video gives an analysis of second bo kata, cho un no kon and shows you how it is executed.
This video gives an analysis of strikes and blocks from the more advanced hojo-undo (but still the basics prior to a kata).
The rumor that the iPhone 8 will ship with 3D camera system is not a new one, but a new analysis by Morgan Stanley's Charlie Chan lends credibility to the speculation. Now, it appears more likely than ever that Apple's next iPhone will ship with 3D capabilities, increasing potential for AR and VR integration in the future.
Squats are important not only for toning your glutes and thighs, but if you do them often enough they also increase flexibility and core strength, making surviving a day at the office easier.
When you wear glasses it is important to make your eyes stand out. Your eyes will be hard to see behind your frames, so make sure to choose brighter colors and deeper lines that will help them pop. You don't want to put too much makeup on, however, because you don't want to look clownish. So, check out this video for great makeup tips that will help you look great, even with poor vision.
This slide show video, with helpful notes, demonstrates how to disassemble the Apple iPhone 3G. First remove the iPhone SIM card, then remove the display. Then dive right in to the bare components! This iPhone disassembly video breaks down the interior components for deeper understanding. Interesting for those who don't want to risk taking their own iPhone apart.
Data makes the world go round. It has gotten to the point that it's considered the most valuable resource, perhaps even more important than oil. Businesses use data to collect critical information about their users and improve their services; governments utilize it to improve things like public transportation; doctors analyze data to find more ways to save lives.
Onshore, or on a boat, have you ever wondered what swims below in the dark water? Using standard equipment and a new process, marine scientists can now get a good look at what is swimming by—just by analyzing the water.
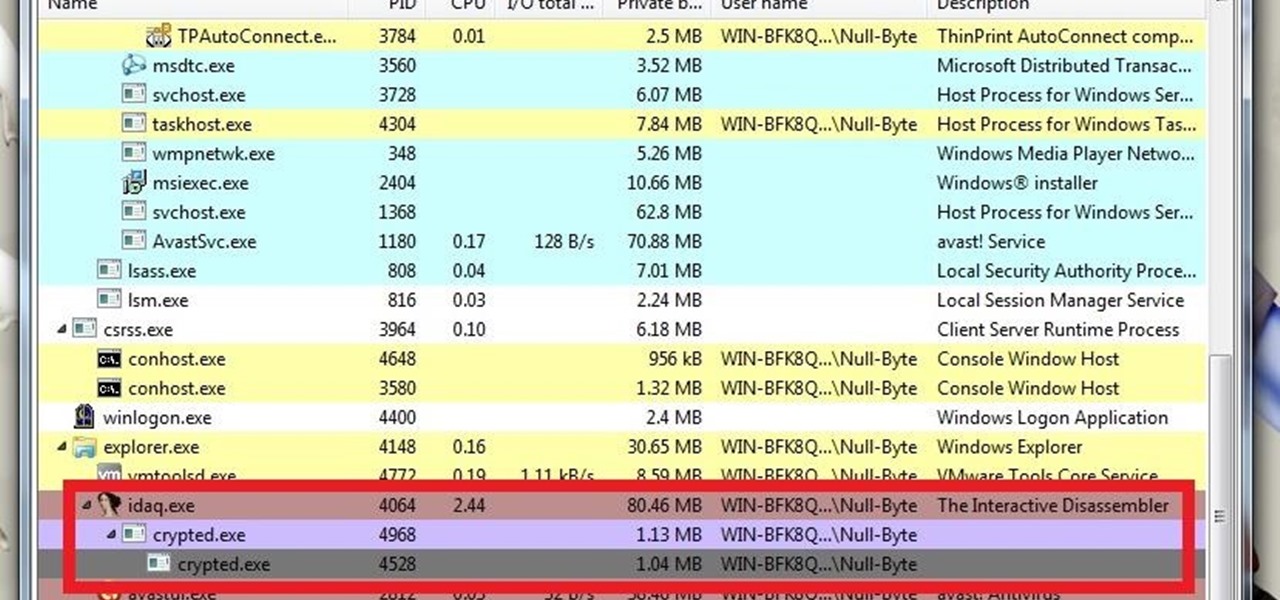
What's up guys? Welcome to a sort of general walkthrough on how one might approach a reversing and analysis on a crypted malware. This is by no means a universal technique so don't assume that this will occur in every scenario, it's more of a demonstration than anything really.
Welcome back, my budding hackers! One of the most basic skills the forensic investigator must master is the acquisition of data in a forensically sound manner. If data is not captured in a forensically sound manner, it may not be admissible in court. In my Kali Forensics series, I showed you how to acquire a forensically sound, bit-by-bit image of a storage device such as a hard drive or flash drive, but now let's dive into live memory.
It's time for another Achievement Hunter video from the guys who know how to do it best. The game they're playing this time is the first DLC for the psychological hit thriller, Alan Wake. The Signal takes players deeper into the story of Alan Wake and find out what's actually going on with his life.