In order to create your own personal yoga sequence and to personalize your yoga routine, you will need to remember to ask yourself about your needs. Remember that you shouldn't just do it as a routine. Having a routine is important, because it will encourage you to do your exercises everyday. However, you have to remember to be in the moment and to give your body what it is asking for and demanding.

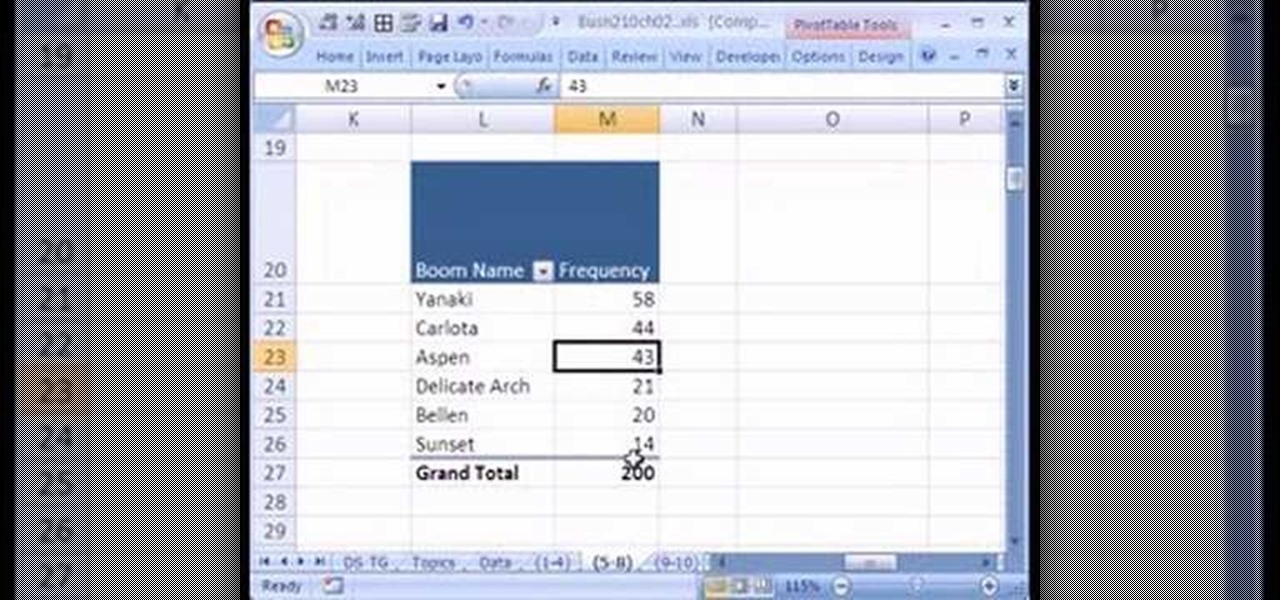
If you use Microsoft Excel on a regular basis, odds are you work with numbers. Put those numbers to work. Statistical analysis allows you to find patterns, trends and probabilities within your data. In this MS Excel tutorial from everyone's favorite Excel guru, YouTube's ExcelsFun, the 24th installment in his "Excel Statistics" series of free video lessons, you'll learn how to create quantitative data frequency distributions with pivot tables. See how to create the correct unambiguous labels ...

If you use Microsoft Excel on a regular basis, odds are you work with numbers. Put those numbers to work. Statistical analysis allows you to find patterns, trends and probabilities within your data. In this MS Excel tutorial from everyone's favorite Excel guru, YouTube's ExcelsFun, the 12th installment in his "Excel Statistics" series of free video lessons, you'll learn how to use Advanced Filter 'Unique Records Only" to extract a list of unique items from a data base, and then use the COUNTI...

This video shows you how to excavate a pond using hand tools and a jackhammer.First of all, you must organize your digging in shelves. A pond should have some parts deeper than others. You start by leveling the pond at the part where it will be more shallow (thus creating the first shelf). Then go to a deeper part and level that out. In this way you create shelves with different elevations.Your tools for excavating are the spade, the flat shovel, the pick, the wheelbarrow and the jackhammer. ...

Welcome to a tennis lesson from FuzzyYellowBalls, the the best place to learn how to play tennis online. Our free video tennis lessons teach you how to play the game in a new way that combines technical analysis, visual learning, and step-by-step progressions.

Welcome to a tennis lesson from FuzzyYellowBalls, the the best place to learn how to play tennis online. Our free video tennis lessons teach you how to play the game in a new way that combines technical analysis, visual learning, and step-by-step progressions.

Welcome to a tennis lesson from FuzzyYellowBalls, the the best place to learn how to play tennis online. Our free video tennis lessons teach you how to play the game in a new way that combines technical analysis, visual learning, and step-by-step progressions.
Welcome to a tennis lesson from FuzzyYellowBalls, the the best place to learn how to play tennis online. Our free video tennis lessons teach you how to play the game in a new way that combines technical analysis, visual learning, and step-by-step progressions.
Welcome to a tennis lesson from FuzzyYellowBalls, the the best place to learn how to play tennis online. Our free video tennis lessons teach you how to play the game in a new way that combines technical analysis, visual learning, and step-by-step progressions.
Welcome to a tennis lesson from FuzzyYellowBalls, the the best place to learn how to play tennis online. Our free video tennis lessons teach you how to play the game in a new way that combines technical analysis, visual learning, and step-by-step progressions.
Welcome to a tennis lesson from FuzzyYellowBalls, the the best place to learn how to play tennis online. Our free video tennis lessons teach you how to play the game in a new way that combines technical analysis, visual learning, and step-by-step progressions.
Welcome to a tennis lesson from FuzzyYellowBalls, the the best place to learn how to play tennis online. Our free video tennis lessons teach you how to play the game in a new way that combines technical analysis, visual learning, and step-by-step progressions.
Welcome to a tennis lesson from FuzzyYellowBalls, the the best place to learn how to play tennis online. Our free video tennis lessons teach you how to play the game in a new way that combines technical analysis, visual learning, and step-by-step progressions.
Welcome to a tennis lesson from FuzzyYellowBalls, the the best place to learn how to play tennis online. Our free video tennis lessons teach you how to play the game in a new way that combines technical analysis, visual learning, and step-by-step progressions.
Welcome to a tennis lesson from FuzzyYellowBalls, the the best place to learn how to play tennis online. Our free video tennis lessons teach you how to play the game in a new way that combines technical analysis, visual learning, and step-by-step progressions.
Learn how to employ proper tennis footwork. This video demonstrates the tennis footwork split step.
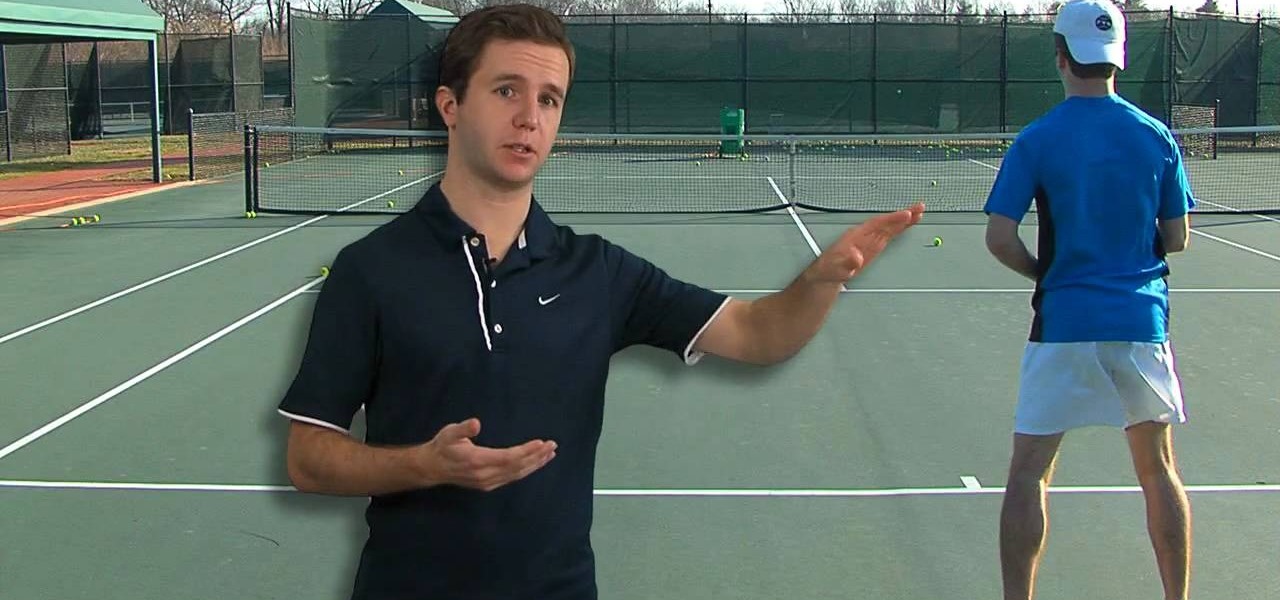
In this Forehand Fundamentals video, we talked about how you need to take your racket back to complete your preparation. This video goes into more detail about the backswing and discusses the wide variety of backswings you see on the pro tennis tour.
Want to know how to play some good music on the acoustic guitar? Well, this video tutorial will show you how to up your guitarist skills by learning to play "Not an Addict" by K's Choice. When you play this song from the lesson, play it like you mean it.
Sulphur Hexafluoride is actually heavier than air, leading to some very amusing phenomenon such as changing your voice. Try this little experiment at home with sulfur hexafluoride gas from a balloon, and then try it against regular air. What's the difference.
The third step to dissecting a human is looking at the muscles of the abdominal wall, or it can be your first step, or your second; the order's not important. What's important is that you get an "A" in anatomy class.
If you use Microsoft Excel on a regular basis, odds are you work with numbers. Put those numbers to work. Statistical analysis allows you to find patterns, trends and probabilities within your data. In this MS Excel tutorial from everyone's favorite Excel guru, YouTube's ExcelsFun, the 92nd installment in his "Excel Statistics" series of free video lessons, you'll learn how to use the TINV and TDIST functions to test a hypothesis.
If you use Microsoft Excel on a regular basis, odds are you work with numbers. Put those numbers to work. Statistical analysis allows you to find patterns, trends and probabilities within your data. In this MS Excel tutorial from everyone's favorite Excel guru, YouTube's ExcelsFun, the 85th installment in his "Excel Statistics" series of free video lessons, you'll learn how to construct confidence intervals for proportions using NORMSINV function and other formulas.
An intensive analysis of the "blue third," a quarter-tone that lies somewhere between the major and minor third and is a key constituent of the blues scale that all harmonica players must master. With Satan & Adam harpist Adam Gussow.
Looking to impress the ladies with your singer voice? Most of us could only sound like Barry White by gargling cockleburs. But you can pull off a throaty, soulful resonance with the right kind of practice.
It’s never too late to clean up your credit record – and save yourself thousands of dollars in exorbitant interest rates in the process. Learn how to repair your credit with this guide from Howcast.
New to Excel? Looking for a tip? How about a tip so mind-blowingly useful as to qualify as a magic trick? You're in luck. In this Excel tutorial from ExcelIsFun, the 237th installment in their series of digital spreadsheet magic tricks, you'll learn how to
In this Tutorial I will show you how you can use the frequency of letters to decrypt the famous Caesar cipher. I hope it is easy to understand and helpful for getting in touch with basic cryptanalysis. If you find any mistakes or have questions feel free to ask me. Finally I ask you to give me feedback which I will take into account for the next part.
How Do You Do A Business Plan? Part 1 of 5 (Series designed to discuss the parts of a business plan, what information is involved in each part, and why a business plan is needed.)
In order to create a Cleopatra inspired makeup look, you will need the following: lipstick, eyebrow pencil, blush, bold eye shadows, and false eyelashes.
Jazz music, along the lines of jazz greats like Coltrane and Thelonius Monk, is usually associated with the piano and the sax (as well as backup clarinets, oboes, etc.). But an equally fit instrument for playing jazz tunes is the acoustic guitar, which offers a light contrast to the larger, deeper toned instruments.
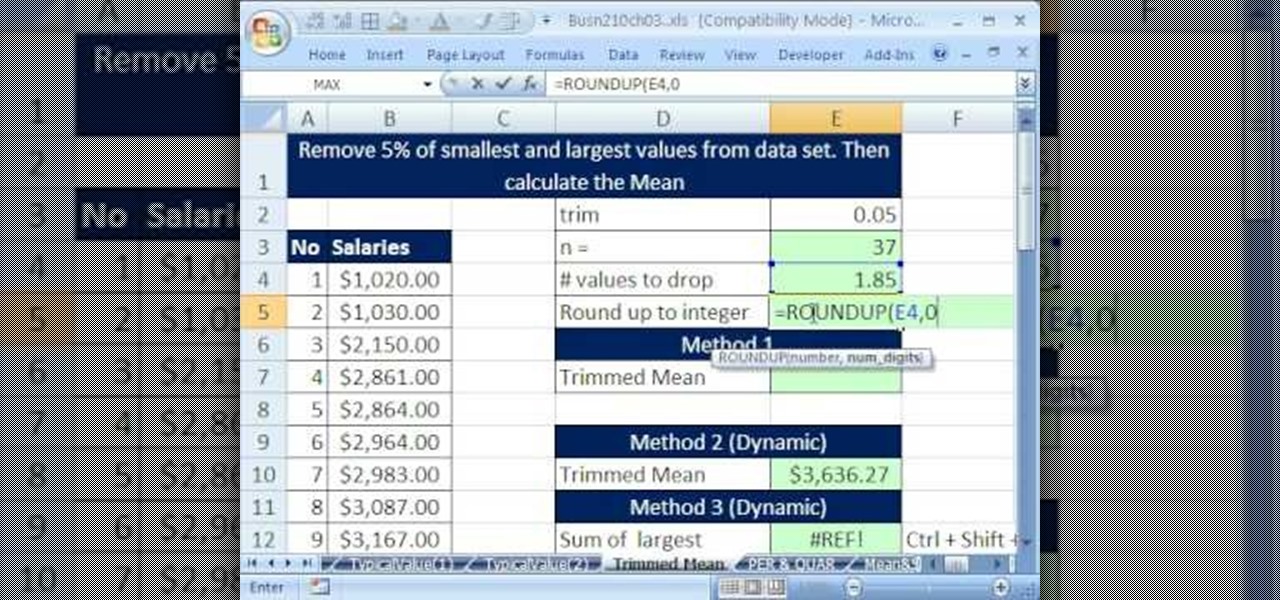
If you use Microsoft Excel on a regular basis, odds are you work with numbers. Put those numbers to work. Statistical analysis allows you to find patterns, trends and probabilities within your data. In this MS Excel tutorial from everyone's favorite Excel guru, YouTube's ExcelsFun, the 36th installment in his "Excel Statistics" series of free video lessons, you'll learn how to calculate a trimmed mean, which is used when there are extreme values in the data set that might skew the mean.
If you use Microsoft Excel on a regular basis, odds are you work with numbers. Put those numbers to work. Statistical analysis allows you to find patterns, trends and probabilities within your data. In this MS Excel tutorial from everyone's favorite Excel guru, YouTube's ExcelsFun, the 39th installment in his "Excel Statistics" series of free video lessons, you'll learn about variability (or dispersion or spread). Create an X-Y Scatter Diagram chart showing data points and the mean.
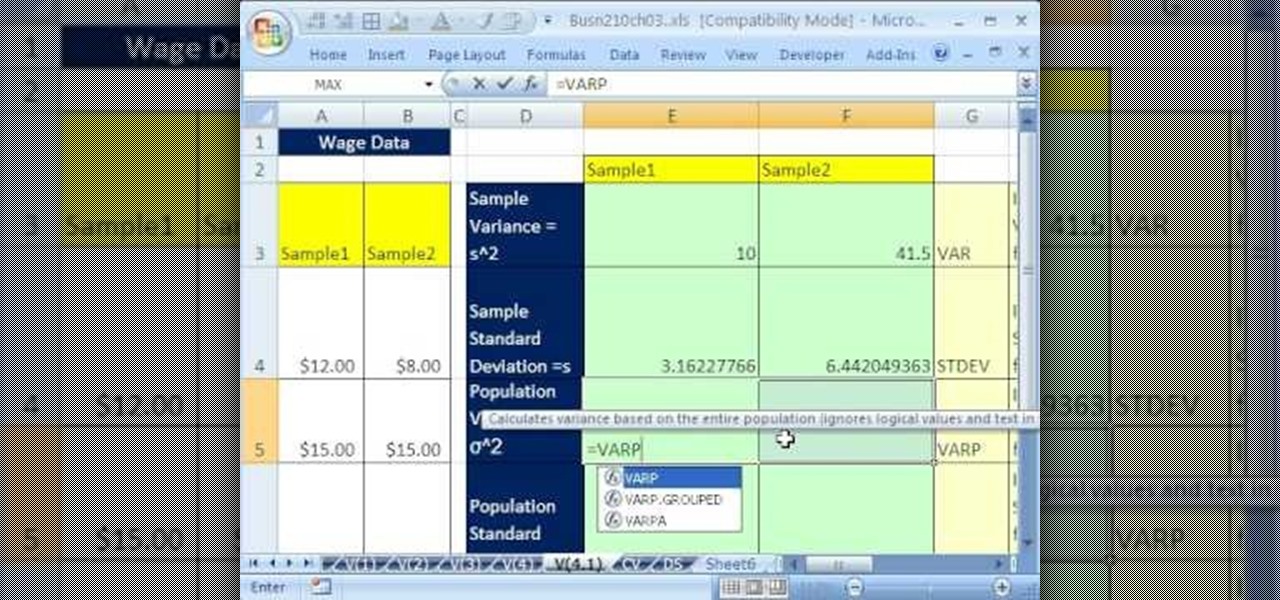
If you use Microsoft Excel on a regular basis, odds are you work with numbers. Put those numbers to work. Statistical analysis allows you to find patterns, trends and probabilities within your data. In this MS Excel tutorial from everyone's favorite Excel guru, YouTube's ExcelsFun, the 41st installment in his "Excel Statistics" series of free video lessons, you'll learn how to calculate deviations, variance and standard deviation for a sample and a population using Excel tables and the VAR, S...
If you use Microsoft Excel on a regular basis, odds are you work with numbers. Put those numbers to work. Statistical analysis allows you to find patterns, trends and probabilities within your data. In this MS Excel tutorial from everyone's favorite Excel guru, YouTube's ExcelsFun, the 32nd installment in his "Excel Statistics" series of free video lessons, you'll learn how to group when the quantitative data are whole numbers, integers or discrete data and how to group when the quantitative ...
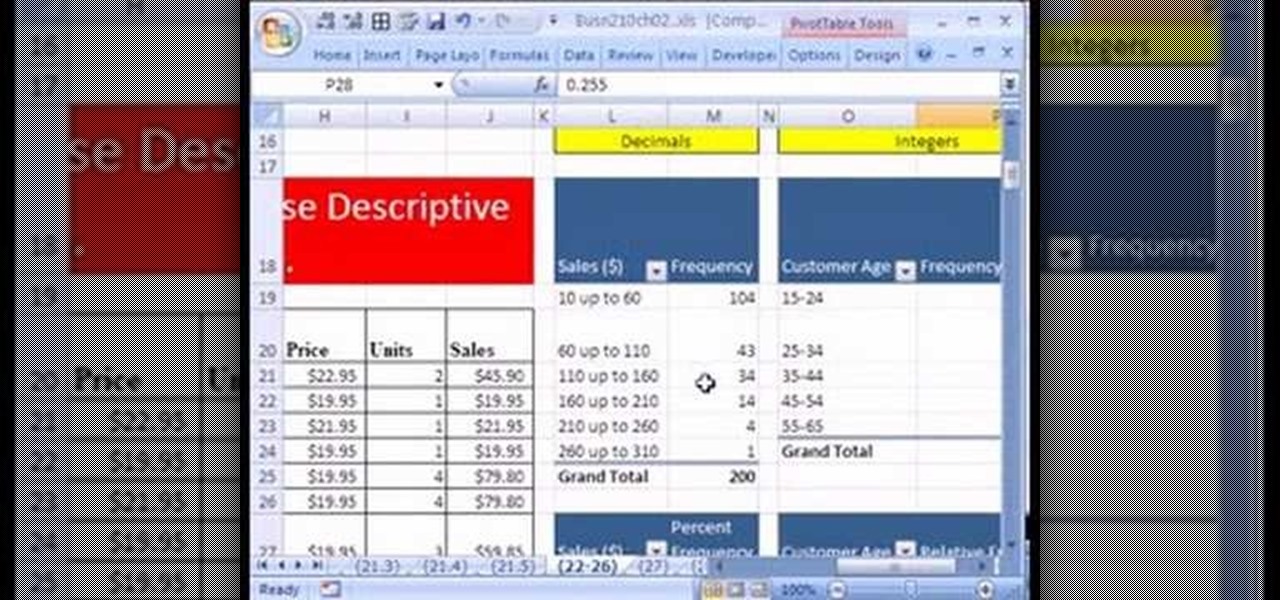
If you use Microsoft Excel on a regular basis, odds are you work with numbers. Put those numbers to work. Statistical analysis allows you to find patterns, trends and probabilities within your data. In this MS Excel tutorial from everyone's favorite Excel guru, YouTube's ExcelsFun, the 25th installment in his "Excel Statistics" series of free video lessons, you'll learn how to create quantitative data percent & relative frequency distributions with pivot tables. Also see how to create a histo...
If you use Microsoft Excel on a regular basis, odds are you work with numbers. Put those numbers to work. Statistical analysis allows you to find patterns, trends and probabilities within your data. In this MS Excel tutorial from everyone's favorite Excel guru, YouTube's ExcelsFun, the 22nd installment in his "Excel Statistics" series of free video lessons, you'll learn how to create a percent (%) cumulative frequency distribution with formulas, a histogram and an ogive chart. See how to add ...
If you use Microsoft Excel on a regular basis, odds are you work with numbers. Put those numbers to work. Statistical analysis allows you to find patterns, trends and probabilities within your data. In this MS Excel tutorial from everyone's favorite Excel guru, YouTube's ExcelsFun, the 15th installment in his "Excel Statistics" series of free video lessons, you'll learn how to use create a frequency distribution, relative frequency distribution, percent frequency distribution and pie chart wi...
If you use Microsoft Excel on a regular basis, odds are you work with numbers. Put those numbers to work. Statistical analysis allows you to find patterns, trends and probabilities within your data. In this MS Excel tutorial from everyone's favorite Excel guru, YouTube's ExcelsFun, the 10th installment in his "Excel Statistics" series of free video lessons, you'll learn how about data sets and the nominal, ordinal, interval and ration scales/levels of measurement and see two Pivot Tables that...
Liven up your parties by making your own fog machine, using items that you can find around the house.
Welcome to a tennis lesson from FuzzyYellowBalls, the the best place to learn how to play tennis online. Our free video tennis lessons teach you how to play the game in a new way that combines technical analysis, visual learning, and step-by-step progressions.