Matt covers some lines with a black ...Bg4. He found the first game with analysis on the Kenilworth Chess Club site. Most of the analysis he gave for this game is taken verbatim, but he does mention a couple side variations that you should be curious about. So watch!

If you ever had trouble trying to properly write a research paper then this quirky, 1950's style filmstrip movie will break it down for you, even if you're a dummy. The Oscar-worthy performances in this movie will help teach you valuable lessons when it comes to preparing and working on a research paper. The narrator in the movie will give you essential tips and strategies to guide you in the research paper writing process. The key things the movie will share with you are: (1) Choosing a topi...

Ramen noodles don't have to be just plain old noodles. Cheap meals don't have to taste cheap. Take Ramen noodles to the next level with some green onions, mushrooms, red bell peppers and more. Check out this video tutorial to learn how to rock out and make ramen noodle stir fry.

MAKE and Collin Cunningham brings the do-it-yourself mindset to all the technology in your life. Make Magazine celebrates your right to tweak, hack, and bend any technology to your own will.

The come command is the most valuable training tool for your dog. Learn the importance of dog training and how to get your dog to come with this free dog training video series.

In this scientific video tutorial, undergraduate students in a forensic chemistry lab demonstrate how to perform gunshot residue analysis (GSR). Learn how to perform gun shot residue analysis (GSR)! Just like in CSI.

EXPAND YOUR VISION: So many people don't achieve their goals and dreams in life because they don't have a big enough vision for themselves. The biggest enemy lies within. Picture and see yourself achieving your goals, becoming financially independent, making yourself more valuable to the market place, or losing that excess weight that you have always wanted to lose.

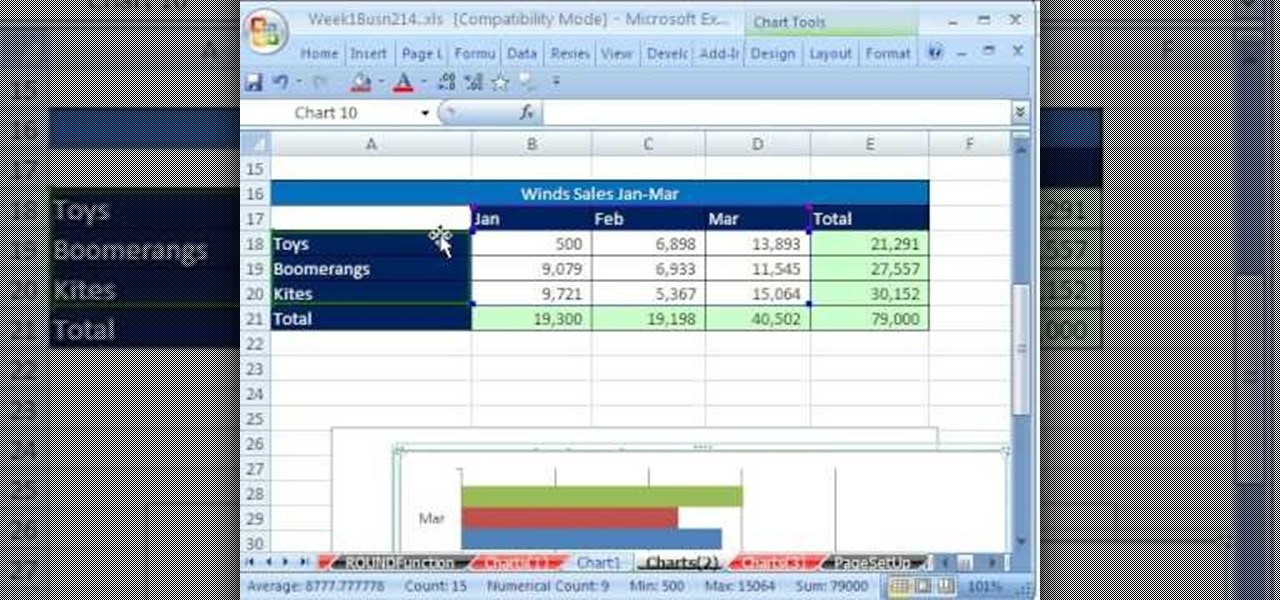
Whether you're interested in learning Microsoft Excel from the bottom up or just looking to pick up a few tips and tricks, you're in the right place. In this tutorial from everyone's favorite digital spreadsheet guru, ExcelIsFun, the 5th installment in his "Highline Excel Class" series of free video Excel lessons, you'll learn how to create seven types of charts — X-Y scatter diagrams, pie charts, column charts, bar charts, stacked bar charts, line charts, and column and line chart combined. ...

If you use Microsoft Excel on a regular basis, odds are you work with numbers. Put those numbers to work. Statistical analysis allows you to find patterns, trends and probabilities within your data. In this MS Excel tutorial from everyone's favorite Excel guru, YouTube's ExcelsFun, the very first installment in his "Excel Statistics" series of free video lessons, you'll learn how to get started doing statistical analysis in Microsoft Excel 2007.

This how-to video is about how to enable the commenting tools in the free Adobe Reader using Acrobat 9 Pro and Acrobat 9 Pro Extended.

"Buy low and sell high" is great advice, but how do you accomplish it? While the stock market can be unpredictable, it's not a complete enigma. There are patterns to watch for that can make you a successful trader.

If you're reading this, you're likely a tech-savvy coding pro whose analytical talents are mostly applied to designing apps, cracking passwords, and infiltrating networks — all of which are admirable activities for both aspiring and seasoned white hat hackers. But there are other profitable ways that you can put these types of skills to use, namely in the world of investment and trading.

We all know how volatile the stock market is, especially during times of crisis. That does not mean that the market is impossible to gauge, however. Day traders are trained to read charts in order to recognize market trends and price patterns, giving them the insight they need to make their trades as profitable as possible.

The Department of Biological Sciences at the University of Alberta brings you this flash animated video tutorial specifically relevant to your student laboratory courses, specifically microbiology. If you're a student at any school of biology, this information will be helpful for learning how to perform a microbiological analysis of food.

As someone who suffered the indignities of an Oakland school education, I'm always thrilled to hear about education reforms that take place and are successful. In this video, you'll get to hear about the program that lets Oakland high school students participate in rooftop gardening and learn valuable skills. And recognition of vegetables other than French fries.

Keep your dog from chewing. Puppies chew because they are teething, bored, or curious. It's up to you to protect your valuables. Give your dog a toy to chew. Keep your dog from chewing.

Unlock the "Closer Analysis: Hidden Intel" trophy in Call of Duty: Black Ops! This achievement is won by finding the hidden intelligence documents in Missions 11, 12 & 13.

Unlock the third "Closer Analysis: Hidden Intel" trophy in Call of Duty: Black Ops! This achievement is won by finding the hidden intelligence documents in Missions 14 & 15.

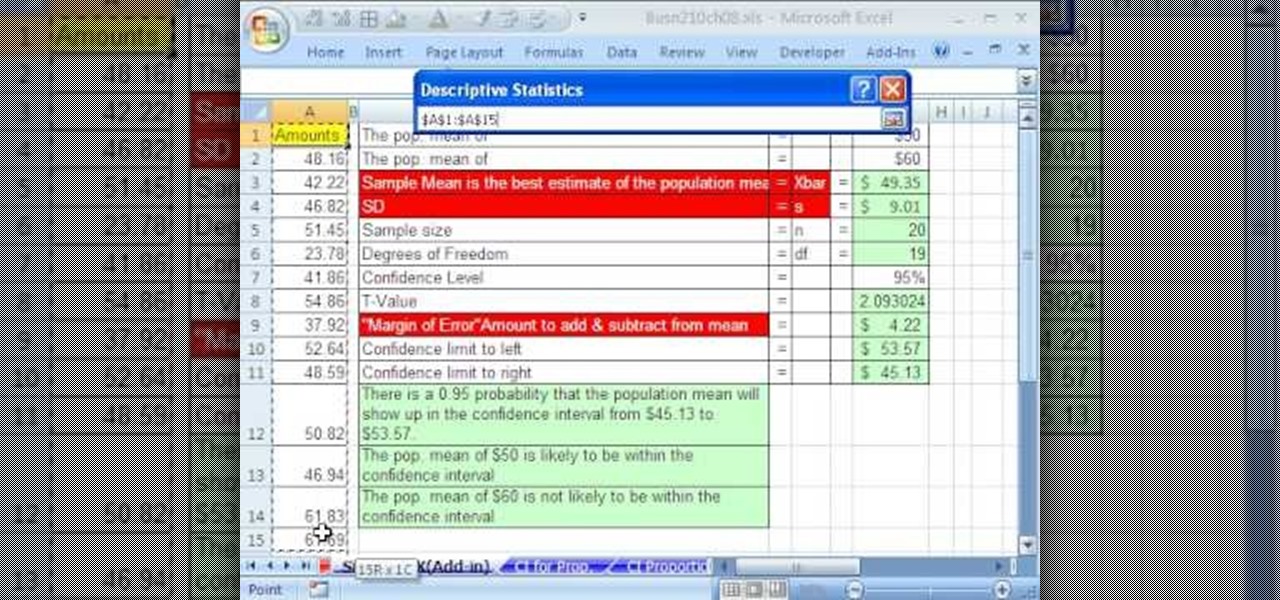
If you use Microsoft Excel on a regular basis, odds are you work with numbers. Put those numbers to work. Statistical analysis allows you to find patterns, trends and probabilities within your data. In this MS Excel tutorial from everyone's favorite Excel guru, YouTube's ExcelsFun, the 84th installment in his "Excel Statistics" series of free video lessons, you'll learn how to construct confidence intervals when the sigma is NOT known using the Descriptive Statistics data analysis add-in.

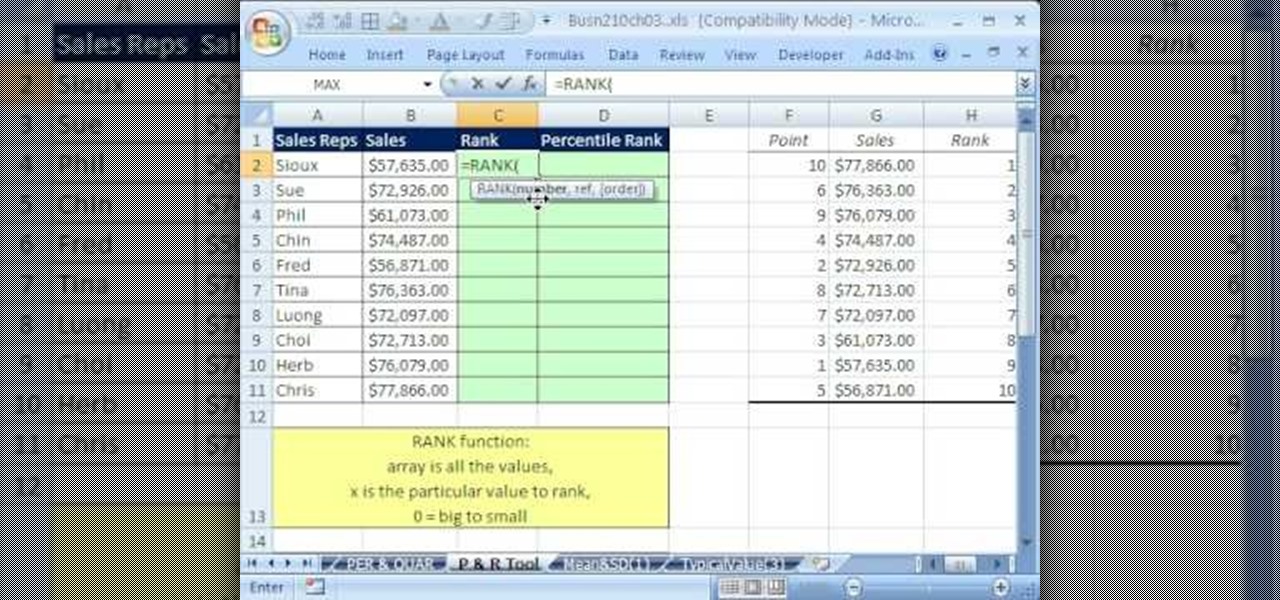
If you use Microsoft Excel on a regular basis, odds are you work with numbers. Put those numbers to work. Statistical analysis allows you to find patterns, trends and probabilities within your data. In this MS Excel tutorial from everyone's favorite Excel guru, YouTube's ExcelsFun, the 38th installment in his "Excel Statistics" series of free video lessons, you'll learn how to use the RANK and PERCENTRANK functions as well as the Data Analysis add-in's Rank & Percentile tools.

"I was wondering if you could take the triad Harmonic Analysis lesson you had done a step further and cover the concept of Transposing chord progressions into other keys?" Before you begin you do have to know some background information about your key signatures, knowing major, minor and diminished steps in triad analysis, and seventh chord harmony. The idea of transposing is that your take a set of notes and change they key it is originally played in. Andrew will walk you through all the ste...

This video is based on a chemistry experiment. This video is going to explain to us how to use gravimetric analysis in order to analyze sulfuric acid. This experiment should not be done for those who do not have a fundamental knowledge of chemical compounds, reactions and chemical safety. He explains first what he is about to do before he does it. Sulfuric acid is acidic and can be toxic if ingested or in contact with the eyes. Take extreme care with this experiment.

Few things are more important than being well-versed in data analytics and interpretation when it comes to succeeding in today's increasingly data-driven world. As a data scientist, these skills are the key to a high-paying career. For hackers, there's no better way to defeat the enemy than to become the enemy.

The Super Bowl of bicycle racing, the Tour de France, added augmented reality to its TV broadcast this year.

Confused by TikTok? Trying to grow your Instagram fanbase? Aiming to create the perfect Facebook ad? Growing an audience might be challenging, but with the right strategies, it is possible — and fun.

Demand for Tesla's driverless features as well as its ultra-long battery ranges and a reputation for offering the best-in-class electric car driving experience helped Tesla see a 32% surge in its value as a brand, topping out at $5.9 billion in the BrandZ Top 100 Most Valuable Global Brands study, released June 5.

Chopping veggies is pretty straightforward: grab the right knife and start slicing. Nothing to it! However, the way you cut your food does affect the length of time it takes to cook, as well as how evenly it cooks. So the next time you need to get your vegetable from hard and crunchy to perfectly soft in mere minutes, give the oblique cut a try.

The Null Byte community is all about learning white hat hacking skills. In part, this is because I believe that hacking skills will become the most valuable and important skill set of the 21st century.

Nowadays, protecting your valuables can be challenging especially when you're on the go. That's why I decided to make a little secret compartment inside my car. Only you'll know it's there because nobody will be able to find it. Not only that, but you'll have easy access to it. It's fairly cheap and the total cost was under $5.00. Let me show you how to make it. You can watch the video or scroll down below for the written guide.
Dimensional analysis is the process of analyzing units to decide which conversion factors to use. You can use this in real life if you want to figure your gas mileage. Here is a link to a website to help you Dimensional Analysis definitions | Quizlet.

Robert Templeman from the Naval Surface Warfare Center in Crane, Indiana and several of his friends from Indiana University recently developed an Android application that is capable of gathering pictures and videos from mobile devices in order to reconstruct a user's environment in 3D. The malware would come coded inside of a camera application that the user would download. The malware, called PlaceRaider, would then randomly take pictures throughout the day and carefully piece them together ...

Nolan's Express Tips: Hall of Famer Nolan Ryan describes how he learned to throw his change-up. Pitching legend Nolan Ryan developed his change-up out of necessity. He describes the challenges and how he made it a valuable pitch to throw. This is an MLB official pitcher's lesson to bring your baseball game to pro level. Throw a change-up pitch with Nolan Ryan.

This chess tutorial from Grandmaster Alexandra Kosteniuk is a perfect example of Retrograde Analysis.

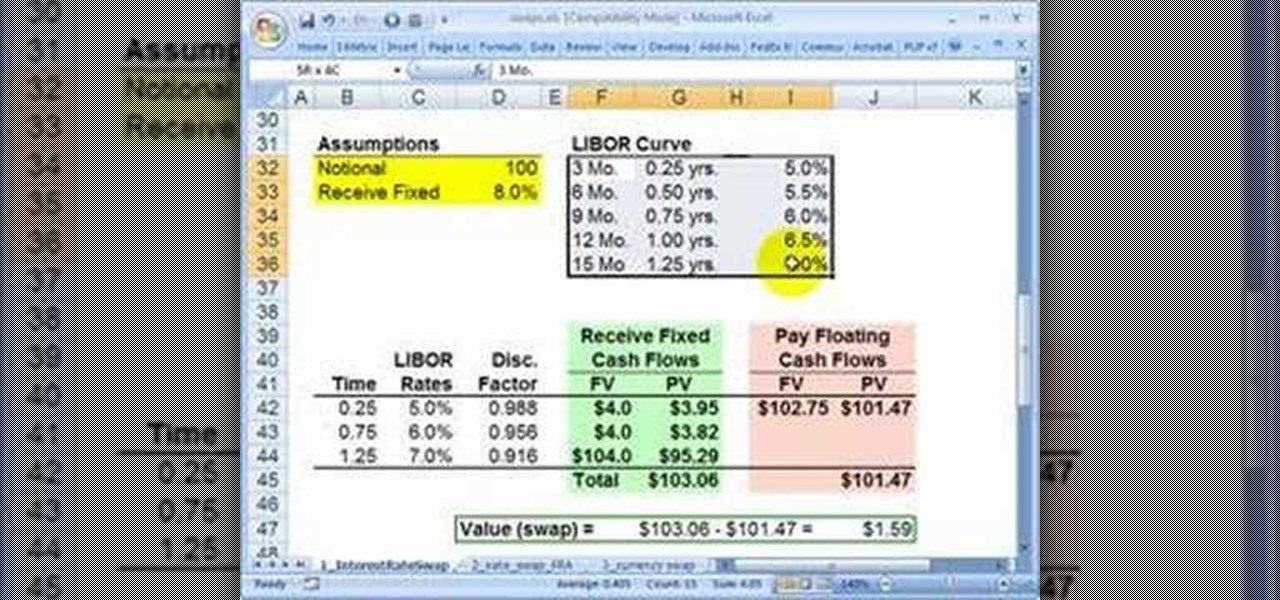
High finance and statistical analysis are too complex for most people once they forget what they learned in high school. If you are an investor or small business owner, you can't afford to forget this stuff. This video will teach you how to value an interest rate swap, good info for financial professionals and students.

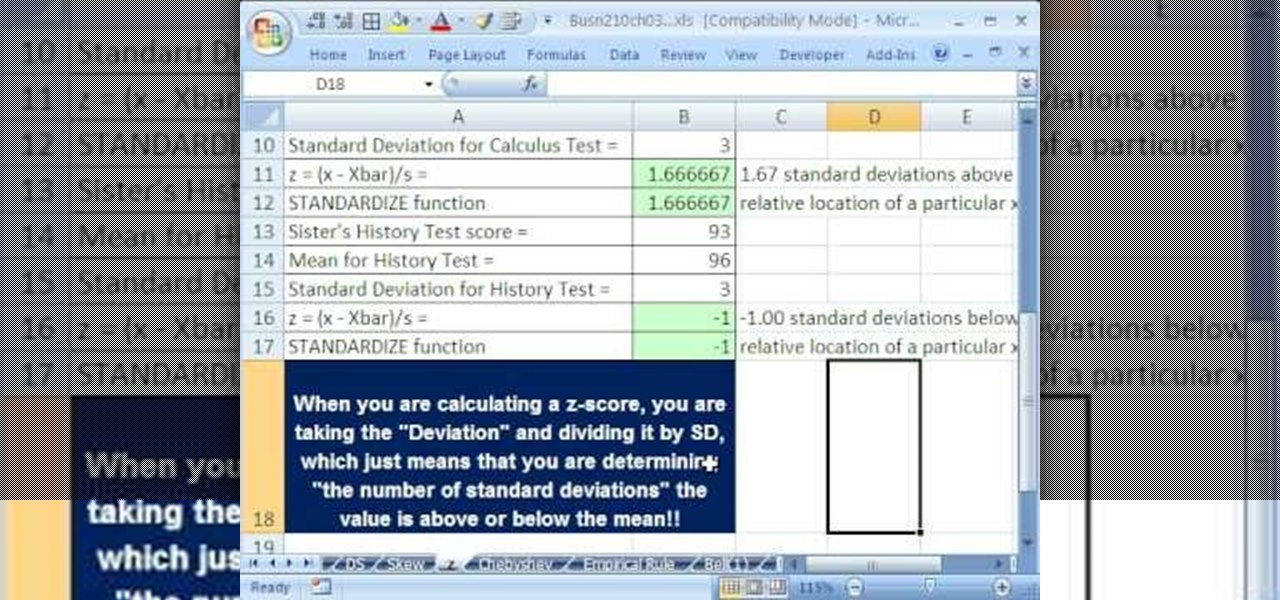
If you use Microsoft Excel on a regular basis, odds are you work with numbers. Put those numbers to work. Statistical analysis allows you to find patterns, trends and probabilities within your data. In this MS Excel tutorial from everyone's favorite Excel guru, YouTube's ExcelsFun, the 45th installment in his "Excel Statistics" series of free video lessons, you'll learn how to see how to calculate a z-score.

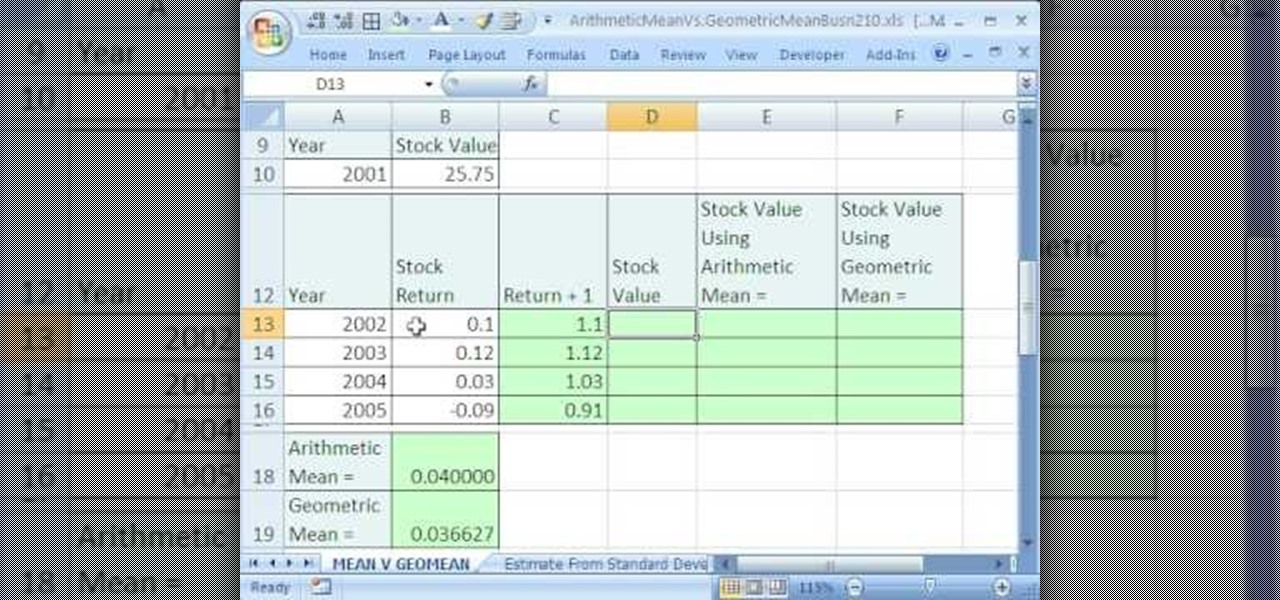
If you use Microsoft Excel on a regular basis, odds are you work with numbers. Put those numbers to work. Statistical analysis allows you to find patterns, trends and probabilities within your data. In this MS Excel tutorial from everyone's favorite Excel guru, YouTube's ExcelsFun, the 35.2nd installment in his "Excel Statistics" series of free video lessons, you'll learn how to use Excel's GEOMEAN function to find geometric mean.

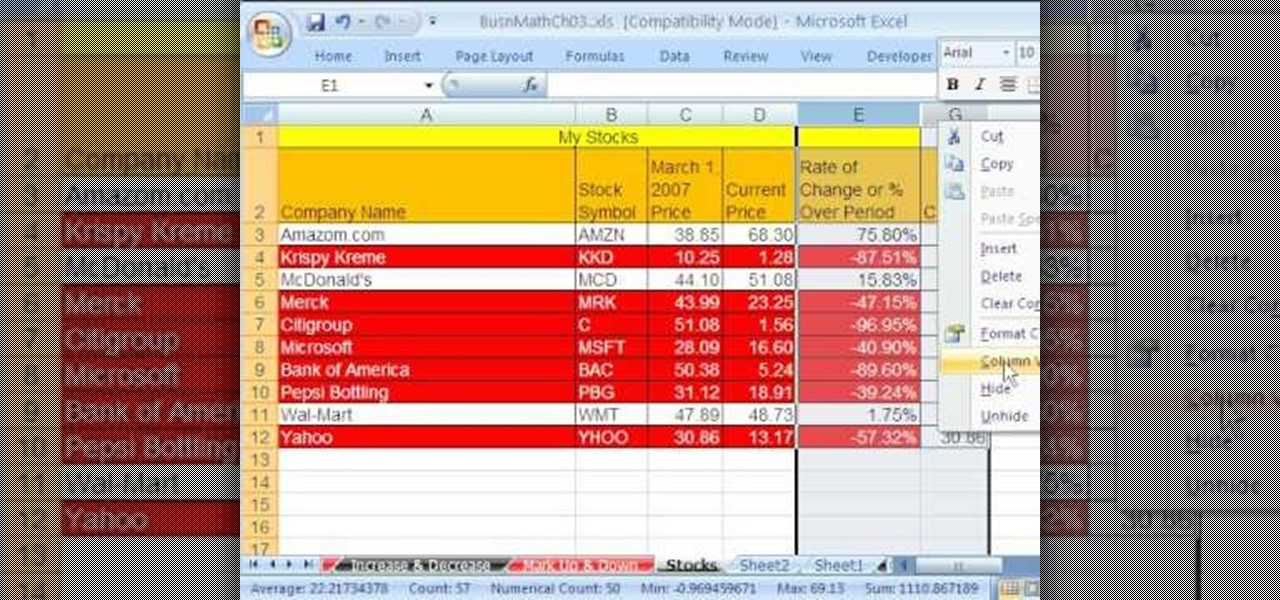
As you might guess, one of the domains in which Microsoft Excel really excels is business math. Brush up on the stuff for your next or current job with this how-to. In this tutorial from everyone's favorite digital spreadsheet guru, YouTube's ExcelIsFun, the 33rd installment in his "Excel Business Math" series of free video lessons, you'll learn how to add current stock prices to a stock analysis table in Excel using a web query.

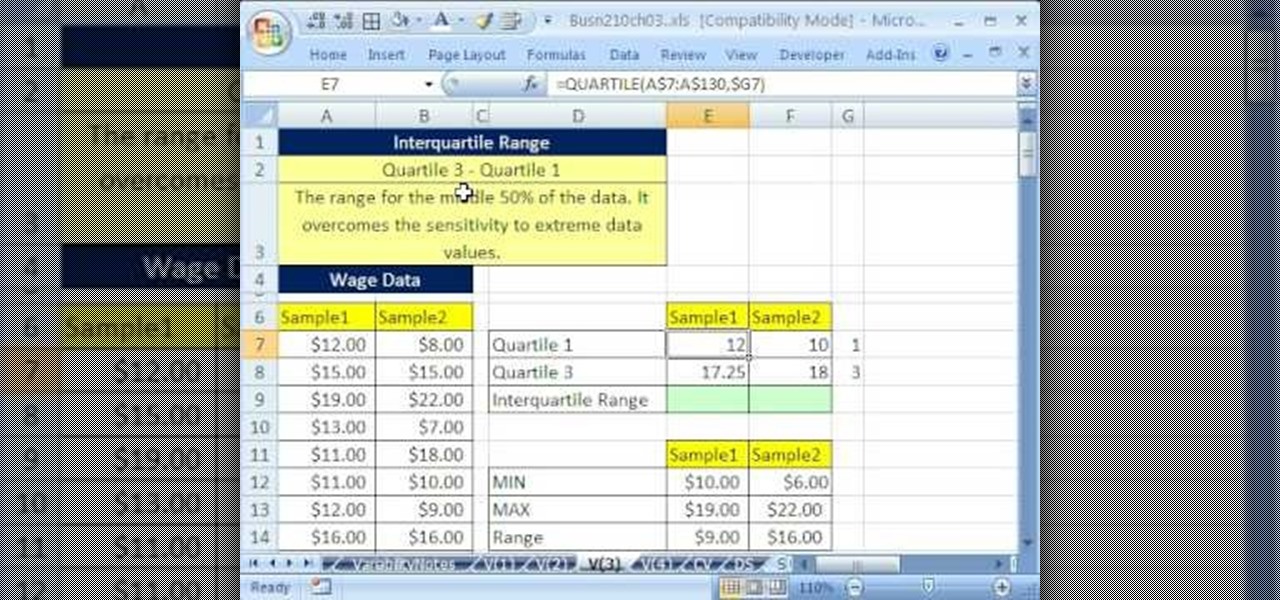
If you use Microsoft Excel on a regular basis, odds are you work with numbers. Put those numbers to work. Statistical analysis allows you to find patterns, trends and probabilities within your data. In this MS Excel tutorial from everyone's favorite Excel guru, YouTube's ExcelsFun, the 40th installment in his "Excel Statistics" series of free video lessons, you'll learn how to calculate range & interquartile range for variability using the MAX, MIN, QUARTILE functions.

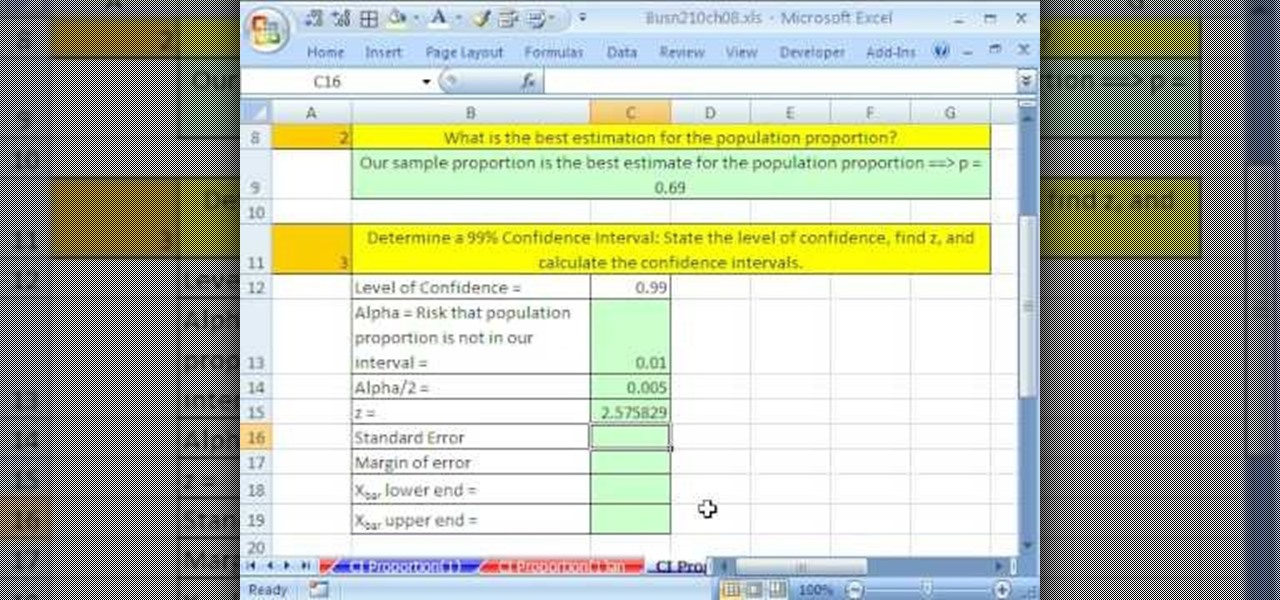
If you use Microsoft Excel on a regular basis, odds are you work with numbers. Put those numbers to work. Statistical analysis allows you to find patterns, trends and probabilities within your data. In this MS Excel tutorial from everyone's favorite Excel guru, YouTube's ExcelsFun, the 86th installment in his "Excel Statistics" series of free video lessons, you'll learn how to construct confidence intervals for proportions using NORMSINV function and other formulas.


