
How To: Secure a wireless network with MAC address filtering
The Lab Rats, Andy Walker and Sean Carruthers, explain Media Access Control (MAC) addresses. Filtering MAC addresses allow you to very specifically control access to your wireless network.


The Lab Rats, Andy Walker and Sean Carruthers, explain Media Access Control (MAC) addresses. Filtering MAC addresses allow you to very specifically control access to your wireless network.

If you use Microsoft Excel on a regular basis, odds are you work with numbers. Put those numbers to work. Statistical analysis allows you to find patterns, trends and probabilities within your data. In this MS Excel tutorial from everyone's favorite Excel guru, YouTube's ExcelsFun, the 26th installment in his "Excel Statistics" series of free video lessons, you'll learn how to create quantitative data cumulative frequency distributions with pivot tables.

If you use Microsoft Excel on a regular basis, odds are you work with numbers. Put those numbers to work. Statistical analysis allows you to find patterns, trends and probabilities within your data. In this MS Excel tutorial from everyone's favorite Excel guru, YouTube's ExcelsFun, the 19th installment in his "Excel Statistics" series of free video lessons, you'll learn how to group categories in a frequency distribution with a formula (2 COUNTIF) and the pivot table (PivotTable) grouping fea...
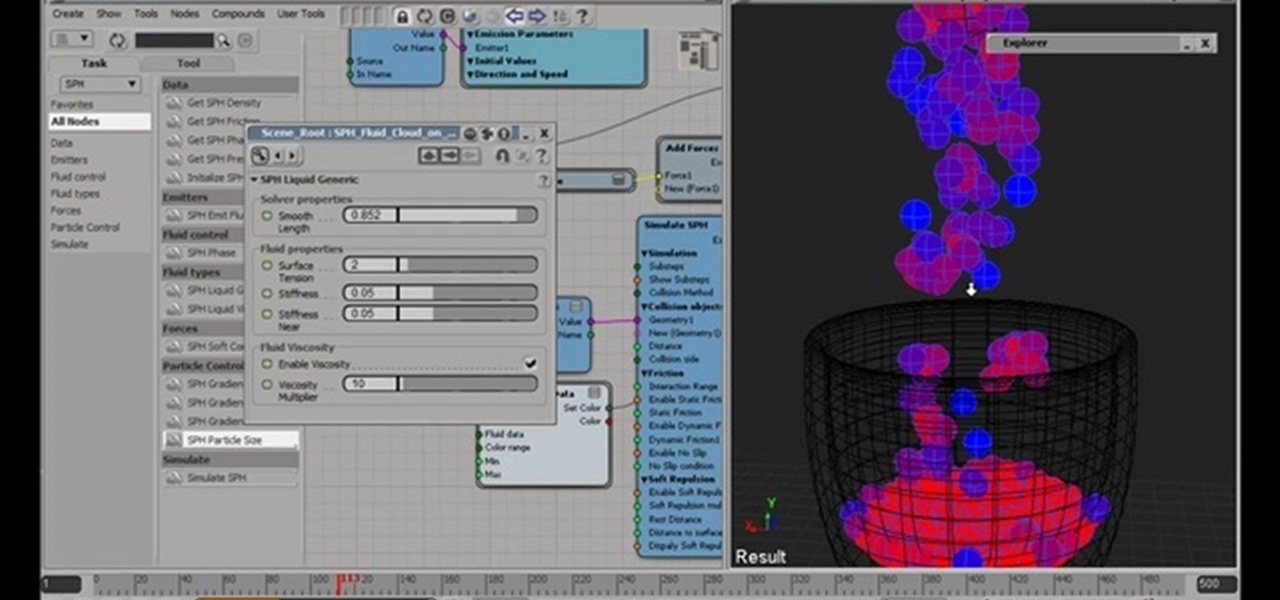
This is a tutorial on the SPH fluids nodes. This is a particle-based distributed fluid simulator application designed for Hewlett-Packard Scalabe Visualization Array. This application uses volume domain distribution among the nodes.
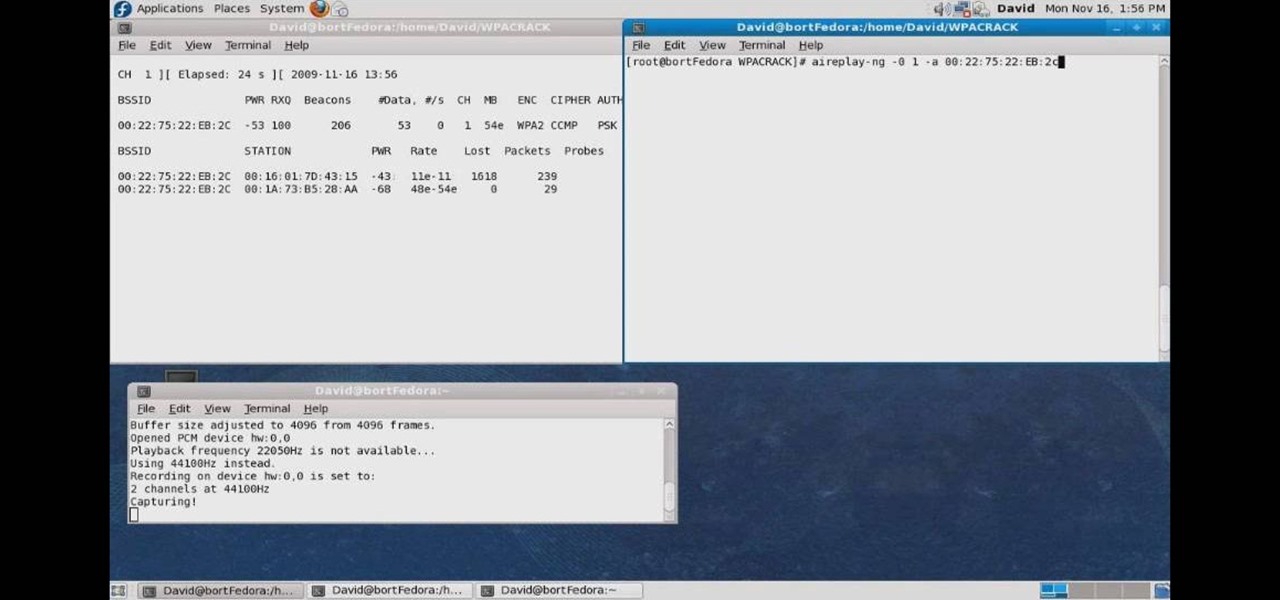
In this how to video, you will learn how to crack a WPA encrypted wireless network. To do this, you will need the Air Crack package for Linux. First, disable the wireless adapter and enable monitor mode. Next, identify the channel in the wireless network and Mac address. Once you have this, you can listen to the traffic coming to and from this point. Wait for the handshake or disconnect something in order to force it to reconnect. From here, you are ready to perform the attack. With any encry...
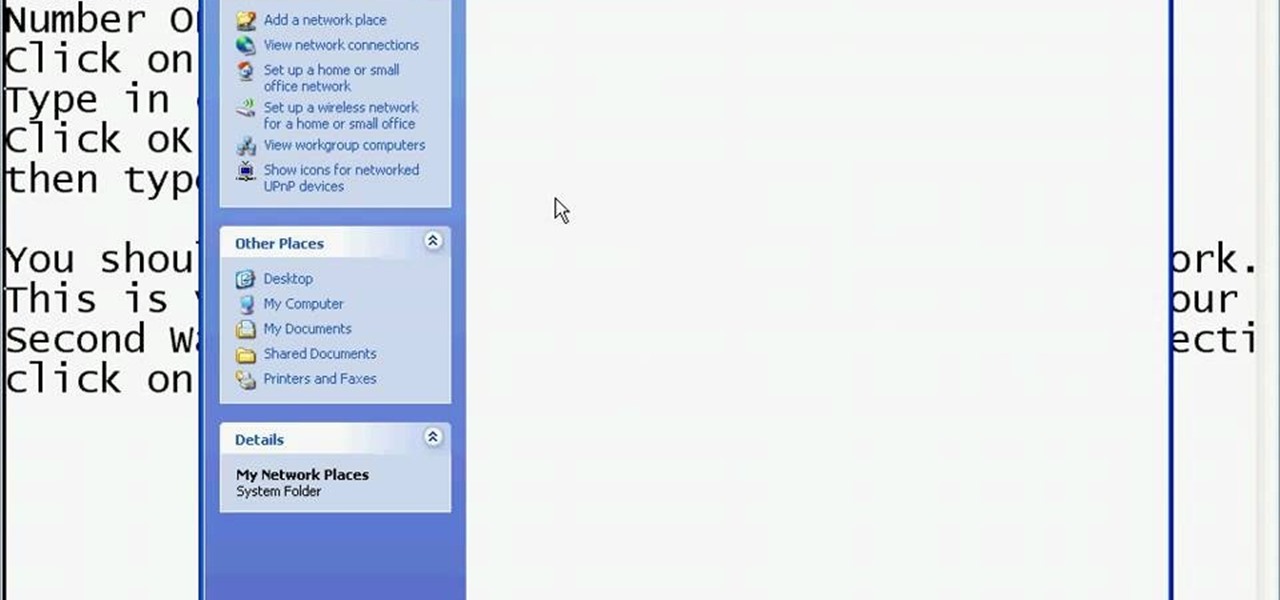
This video shows you the method to find if someone else is using your Internet connection. There are two methods for this. The first method involves opening the start menu and click on 'Run'. Type cmd in the text box which opens as a result of clicking on 'Run'. Type NET VIEW at the command prompt. This will show all people using your network. The second method involves going to Start menu. Go to Connect to and Show all connections. Click on My network places. Click on 'View workgroup compute...
Hak5 isn't your ordinary tech show. It's hacking in the old-school sense, covering everything from network security, open source and forensics, to DIY modding and the homebrew scene. Damn the warranties, it's time to Trust your Technolust. In this episode, see how to map networks with Spiceworks.
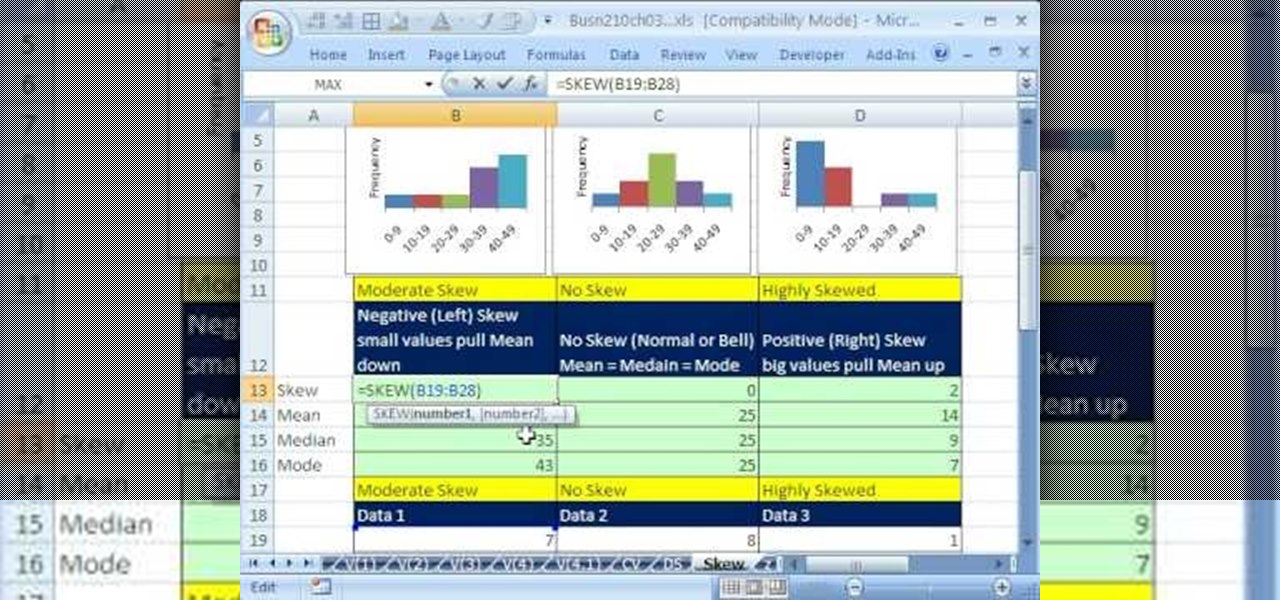
If you use Microsoft Excel on a regular basis, odds are you work with numbers. Put those numbers to work. Statistical analysis allows you to find patterns, trends and probabilities within your data. In this MS Excel tutorial from everyone's favorite Excel guru, YouTube's ExcelsFun, the 44th installment in his "Excel Statistics" series of free video lessons, you'll learn how to use the SKEW function to calculate the skew in a distribution of data.
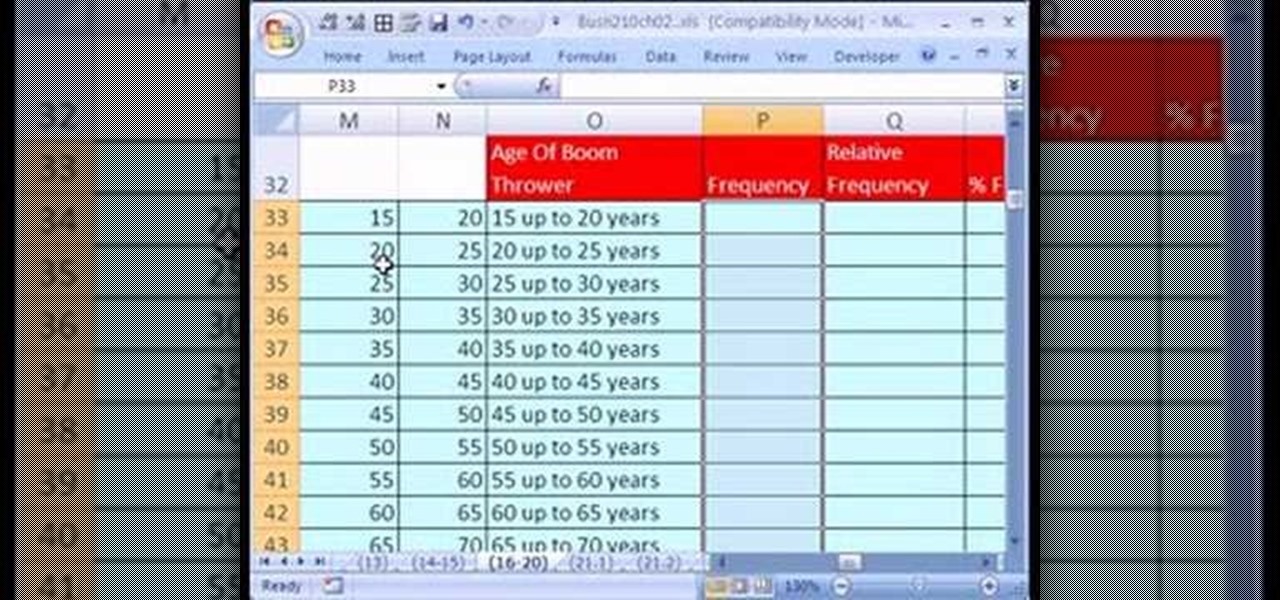
If you use Microsoft Excel on a regular basis, odds are you work with numbers. Put those numbers to work. Statistical analysis allows you to find patterns, trends and probabilities within your data. In this MS Excel tutorial from everyone's favorite Excel guru, YouTube's ExcelsFun, the 21st installment in his "Excel Statistics" series of free video lessons, you'll learn how to build labels and counting formulas for a frequency distribution.
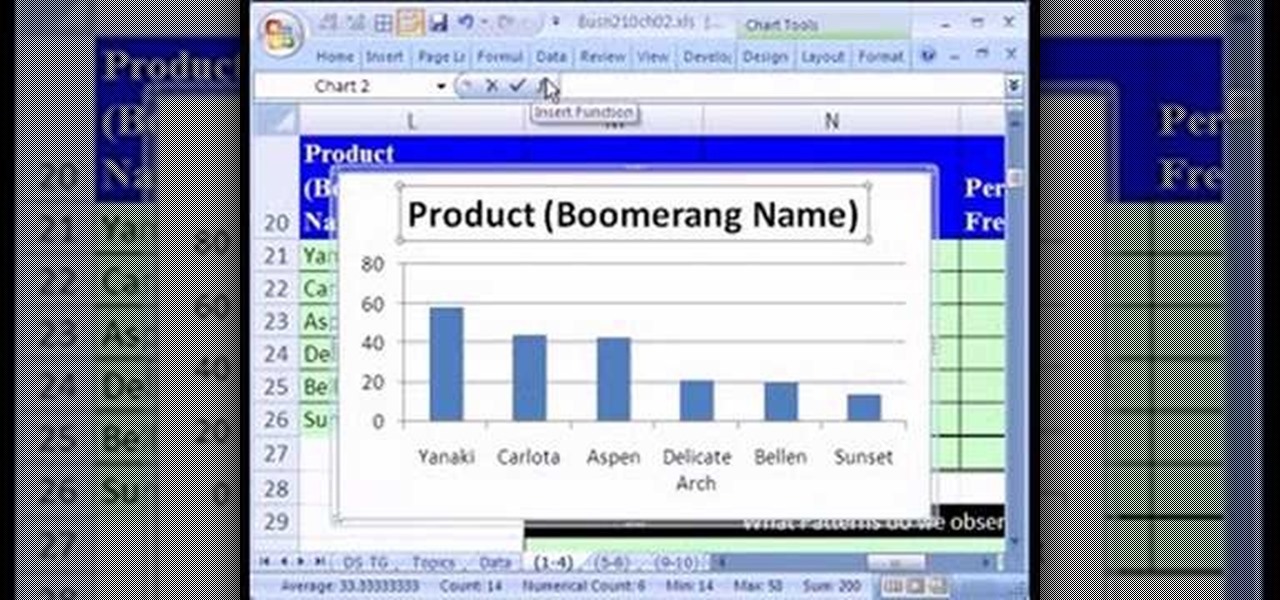
If you use Microsoft Excel on a regular basis, odds are you work with numbers. Put those numbers to work. Statistical analysis allows you to find patterns, trends and probabilities within your data. In this MS Excel tutorial from everyone's favorite Excel guru, YouTube's ExcelsFun, the 13th installment in his "Excel Statistics" series of free video lessons, you'll learn how to create a column chart from a frequency distribution for categorical data.

See how to install part number 7903 the Draw-Tite weight distribution assembly for our 1200 pounds tongue weight and 12000 pounds trailer weight. This video uses a Dodge Ram Pickup but it can be used on any truck.
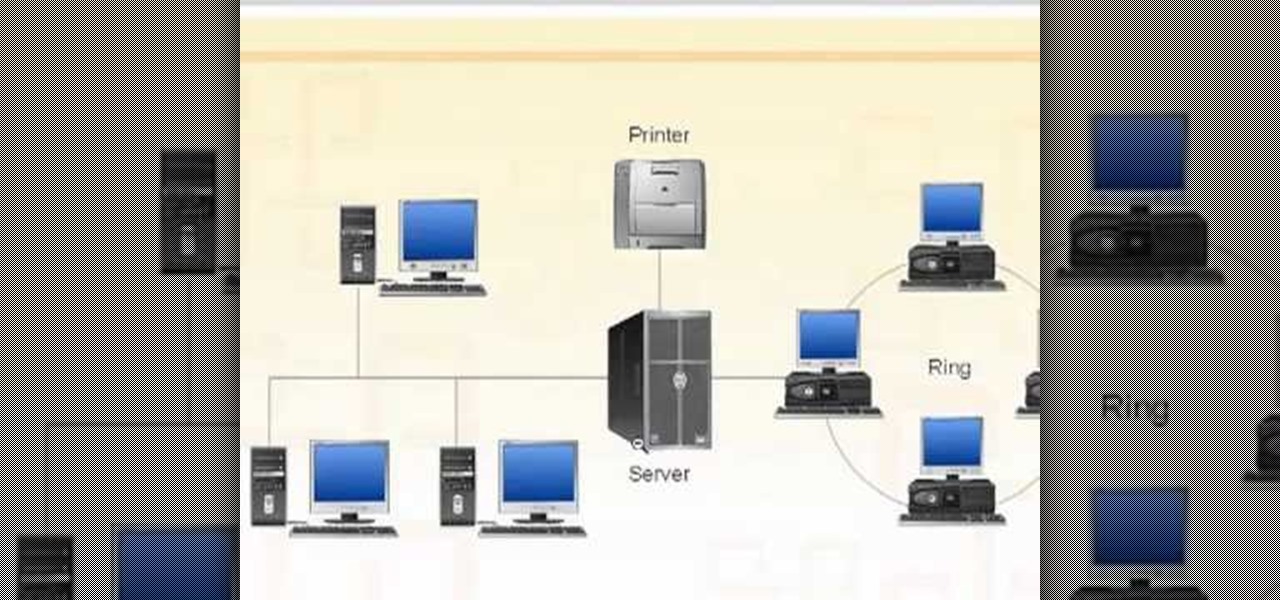
Need some help figuring out the ins and outs of LAN networks? They're easy enough to understand. And this brief video tutorial from the folks at Butterscotch will teach you everything you need to know. For more information, and to learn more about LAN networks yourself, watch this helpful video guide.

The first of a two part series on setting up your linux server and network for external access through your cable modem or DSL. Covers modifying the Linux servers network setting to a static IP address.

If you want to connect your Mac notebook or desktop to a wireless network, you'll need to set up the wifi connection on your computer first. Take a look at this walkthrough to find out how to find and connect to available wireless networks in OS X. This is a great skill to know if you own an Apple laptop and need to connect to the Wi-Fi networks at different locations.
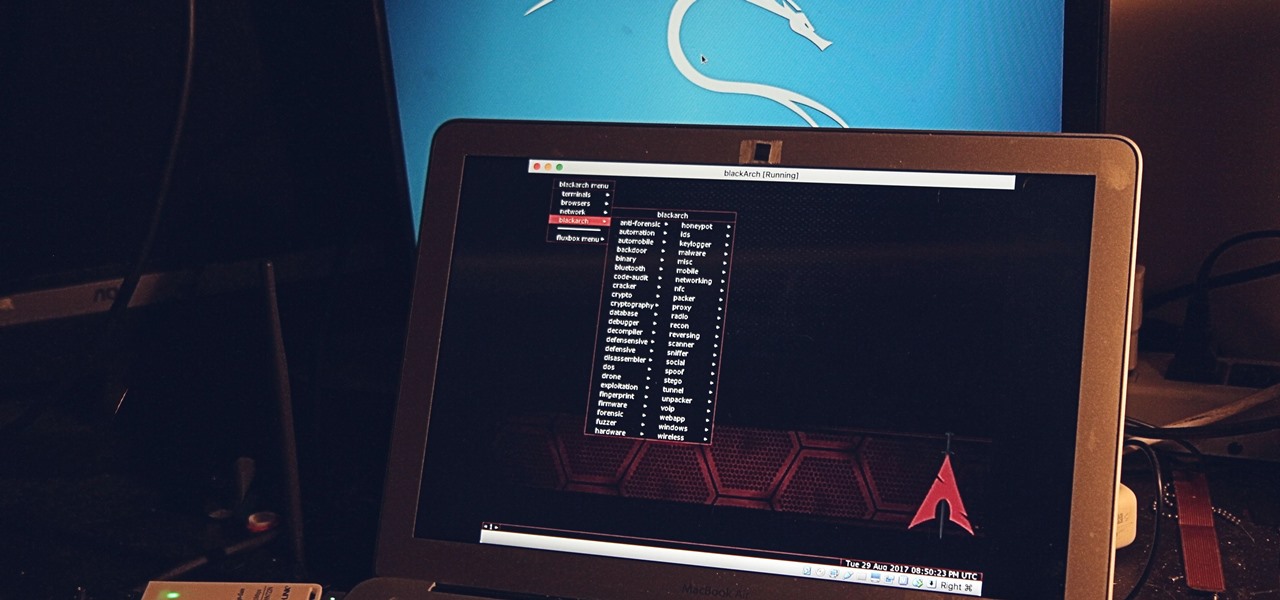
In 2013, Offensive Security released Kali Linux, a rebuild of BackTrack Linux derived from Debian. Since then, Kali has gone on to become somewhat of a standard for penetration testing. It comes preconfigured with a collection of tools accessible by a menu system, tied together with the Gnome desktop environment. However, Kali Linux isn't the only penetration-testing distribution available.

If your iPhone is a business tool for you, you'll want ways to send out mass e-mails, either to your customers or employees and coworkers. You can use the iEDL, or Email Distribution App, published by MerckTech, to set up a distribution list that will let you send out mass emails as often as you need. This video shows you all the ins and outs of this awesome little app. Expand your productivity and marketing reach for your business and personal projects!
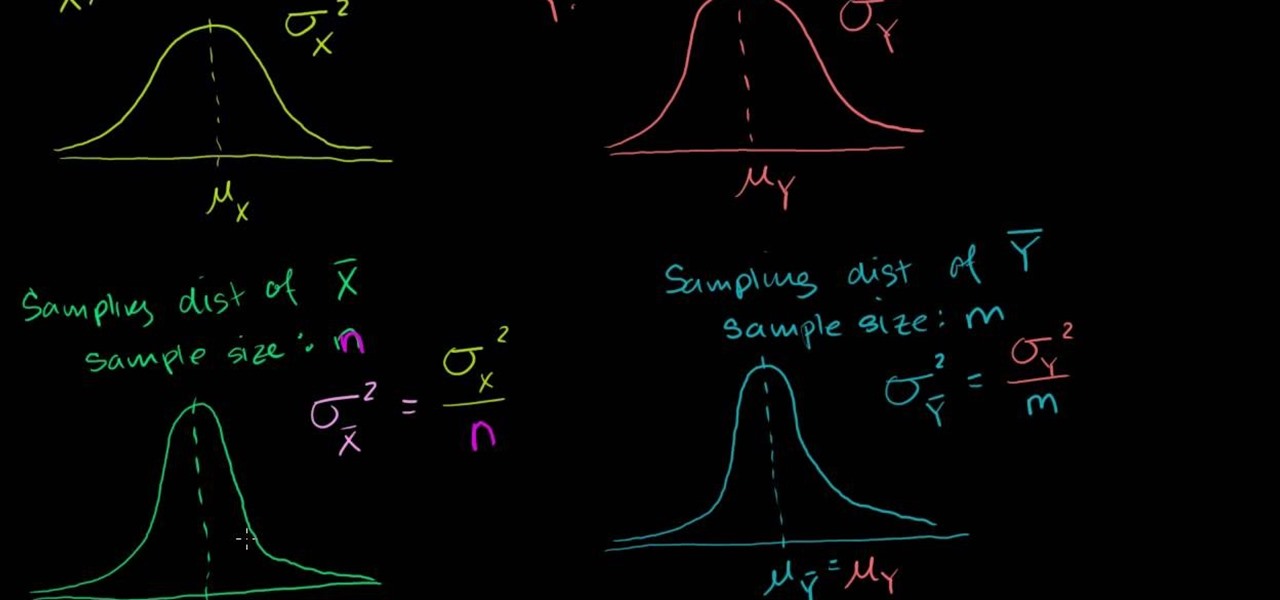
From Ramanujan to calculus co-creator Gottfried Leibniz, many of the world's best and brightest mathematical minds have belonged to autodidacts. And, thanks to the Internet, it's easier than ever to follow in their footsteps. With this installment from Internet pedagogical superstar Salman Khan's series of free math tutorials, you'll learn how to find the sampling distribution for the difference between means.

From Ramanujan to calculus co-creator Gottfried Leibniz, many of the world's best and brightest mathematical minds have belonged to autodidacts. And, thanks to the Internet, it's easier than ever to follow in their footsteps (or just study for that next big test). With this installment from Internet pedagogical superstar Salman Khan's series of free math tutorials, you'll learn how to calculate mean and variance for a Bernouilli distribution.

From Ramanujan to calculus co-creator Gottfried Leibniz, many of the world's best and brightest mathematical minds have belonged to autodidacts. And, thanks to the Internet, it's easier than ever to follow in their footsteps (or just study for that next big test). With this installment from Internet pedagogical superstar Salman Khan's series of free math tutorials, you'll learn how to calculate sample distribution in statistics.

From Ramanujan to calculus co-creator Gottfried Leibniz, many of the world's best and brightest mathematical minds have belonged to autodidacts. And, thanks to the Internet, it's easier than ever to follow in their footsteps (or just study for that next big test). With this installment from Internet pedagogical superstar Salman Khan's series of free math tutorials, you'll learn how to calculate the mean and variance of a Bernouilli distribution.

In need of a general (and quick) introduction to the Ubuntu GNU/Linux distribution or just Linux more generally? Let this video be your guide. For more information, and to learn more about Ubuntu Linux, watch this home-computing how-to from the folks at Butterscotch.
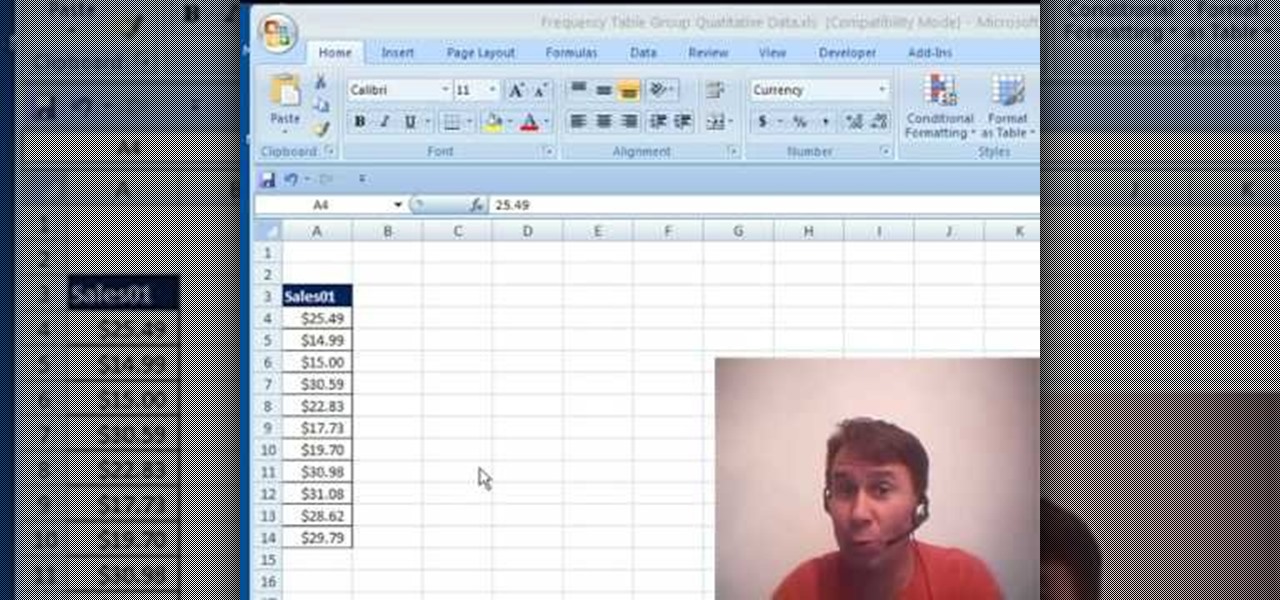
New to Microsoft Excel? Looking for a tip? How about a tip so mind-blowingly useful as to qualify as a magic trick? You're in luck. In this MS Excel tutorial from ExcelIsFun and Mr. Excel, the 15th installment in their joint series of digital spreadsheet magic tricks, you'll learn how to use a pivot table with grouping and a count function to create a frequency distribution.
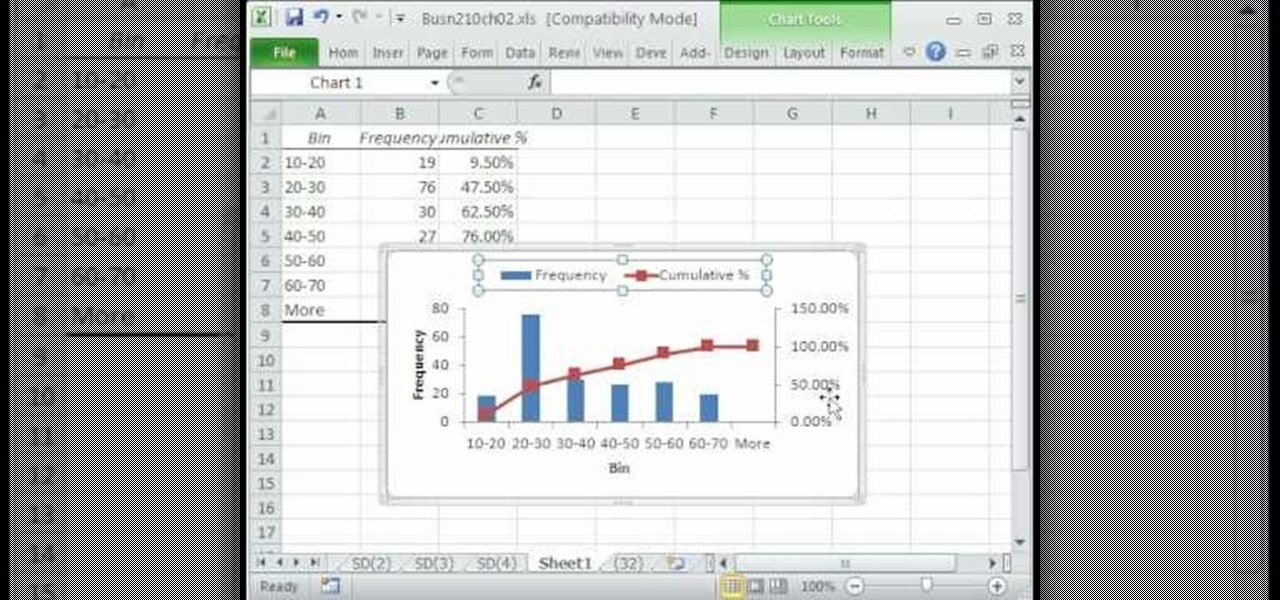
A histogram is a summary graph showing a count of data points that fall in various ranges. Histograms are used in statistics and other forms of mathematics. In this video, learn how to create your own histogram using data analysis on the computer. This tutorial will show you how to create a frequency distribution, a cumulative frequency distribution, a histogram chart and an ogive chart with the data analysis add-in.

Nmap ("Network Mapper") is a free and open source (license) utility for network exploration or security auditing. Many systems and network administrators also find it useful for tasks such as network inventory, managing service upgrade schedules, and monitoring host or service uptime. Nmap uses raw IP packets in novel ways to determine what hosts are available on the network, what services (application name and version) those hosts are offering, what operating systems (and OS versions) they a...
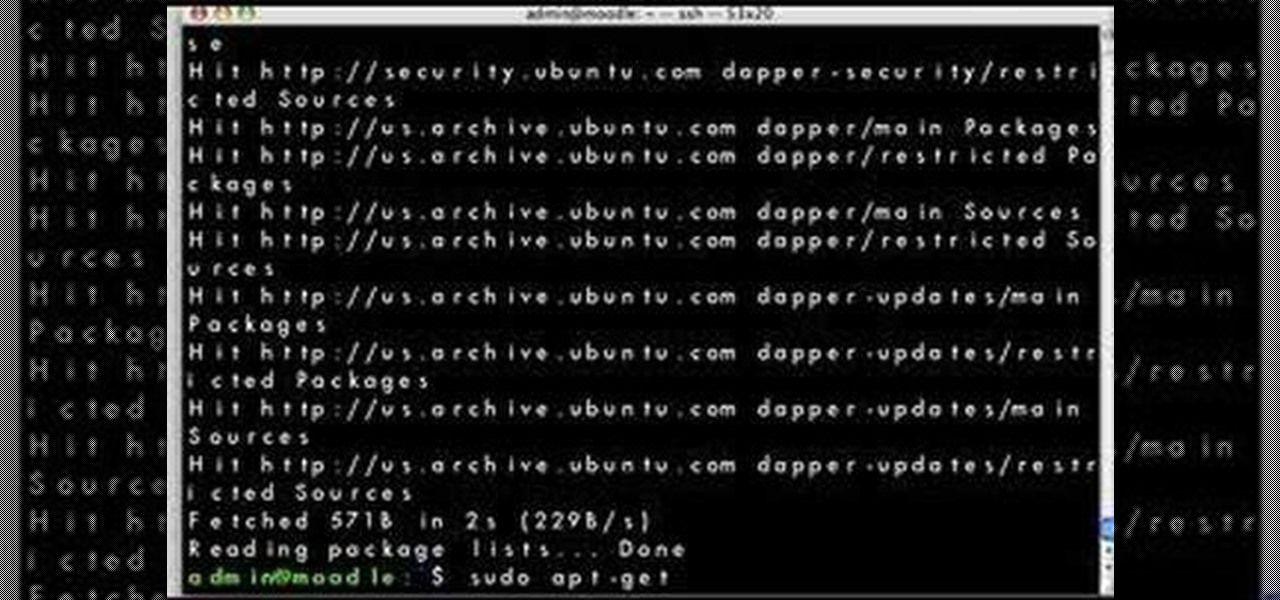
Looking for a simple way to update your Linux distribution? This video tutorial demonstrates how to upgrade your Linux distribution via the apt-get command in the terminal. To get started using the apt-get update tool, press play!

This video will show you how to subnet using CIDR notation. If you're curious about how to determine networks, subnet masks, broadcast addresses and what makes a host range valid. A great video for anyone currently studying computer networking technology.
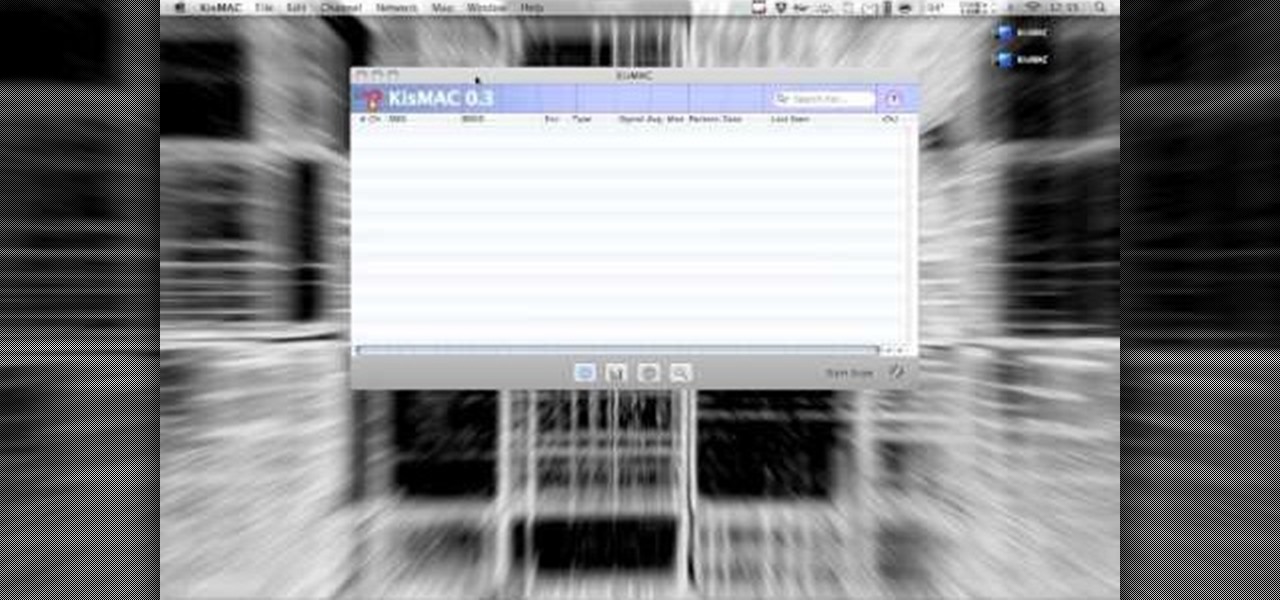
This video will teach you how to hack a WEP wifi network on a Mac. You'll need to follow the link, grab the prog and follow the steps. It's not too hard, so give it a try. Remember, stealing is illegal!

Want to see whether your PC is being accessed by hackers? Netstat (network statistics) is a command-line tool that displays network connections (both incoming and outgoing), routing tables, and a number of network interface statistics. It is available on Unix, Unix-like, and Windows NT-based operating systems. This video tutorial presents a basic introduction to working with the netstat tool. Determine whether you've been hacked with this how-to.

Anyone can set up their own wireless network. All you need is a little know-how. You will need a computer with wireless capability, a high-speed modem, a wireless router, and a broadband internet connection. Don't get tied to the wall; a wireless connection will allow you to move the computer freely around your home and still get an internet connection. Watch this video tutorial and learn how to hook up a wireless network at home.

Tekzilla shows you how to troubleshoot network woes with ping and traceroute.
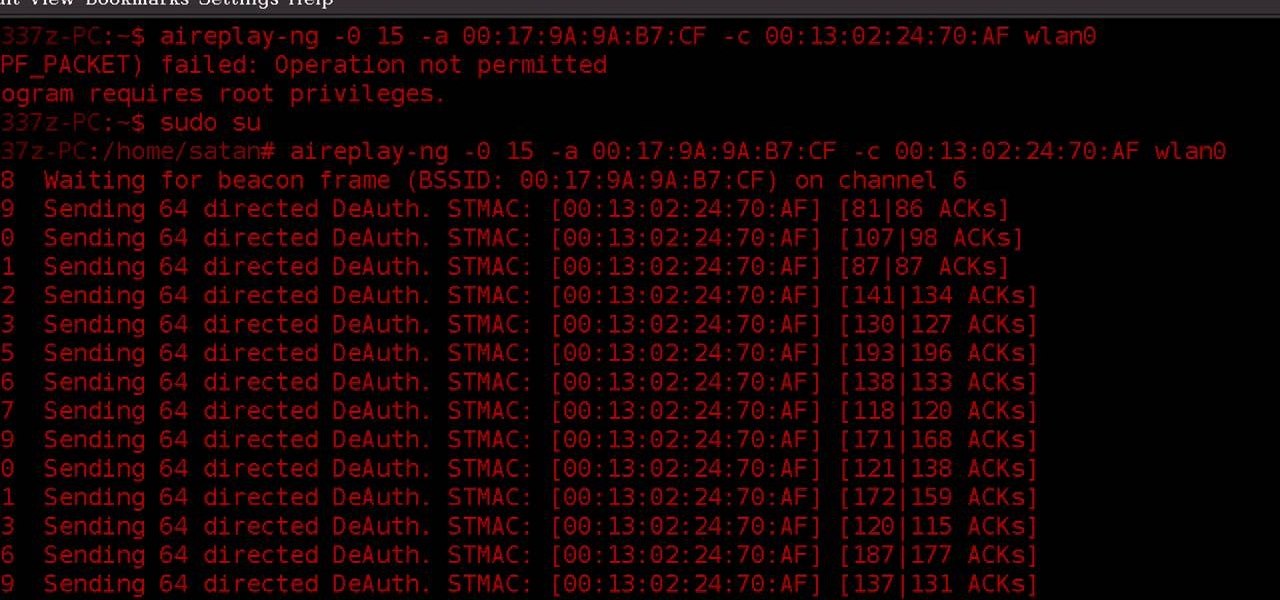
WPA-secured wireless networks, or WiFI Protected Access, is a form of internet security that secures your wireless LAN from being accessed by unauthorized users. Safer than WEP, or wireless equivalent privacy, WPA still has weaknesses that are prone to cracking - IF, that is, you know what you're doing.

Need some help figuring out how to put a password on your wireless router? This home-computing how-to from the folks at CNET TV will teach you everything you'll need to know to do just that. For detailed information, and to get started protecting your own wireless network helpful video guide.
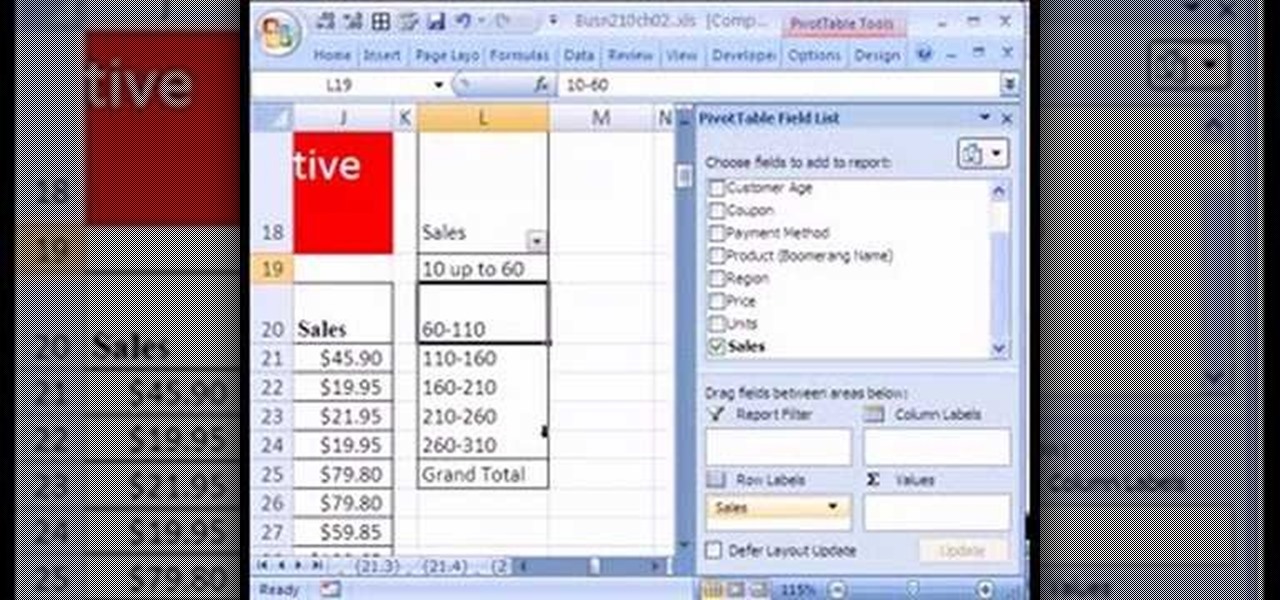
If you use Microsoft Excel on a regular basis, odds are you work with numbers. Put those numbers to work. Statistical analysis allows you to find patterns, trends and probabilities within your data. In this MS Excel tutorial from everyone's favorite Excel guru, YouTube's ExcelsFun, the 24th installment in his "Excel Statistics" series of free video lessons, you'll learn how to create quantitative data frequency distributions with pivot tables. See how to create the correct unambiguous labels ...

If you use Microsoft Excel on a regular basis, odds are you work with numbers. Put those numbers to work. Statistical analysis allows you to find patterns, trends and probabilities within your data. In this MS Excel tutorial from everyone's favorite Excel guru, YouTube's ExcelsFun, the 12th installment in his "Excel Statistics" series of free video lessons, you'll learn how to use Advanced Filter 'Unique Records Only" to extract a list of unique items from a data base, and then use the COUNTI...

Netcat is a featured networking utility which reads and writes data across network connections, using the TCP/IP protocol.

If you're just itching for an excuse to reuse that retired desktop PC or laptop sitting in your closet there here's your chance. This tutorial offers a look at the basics of installing FreeNAS, an open-source DIY NAS. So instead of spending money on off the shelf options why not save yourself some cash and make use of the stuff you already have and get a super customizable network storage device to boot?
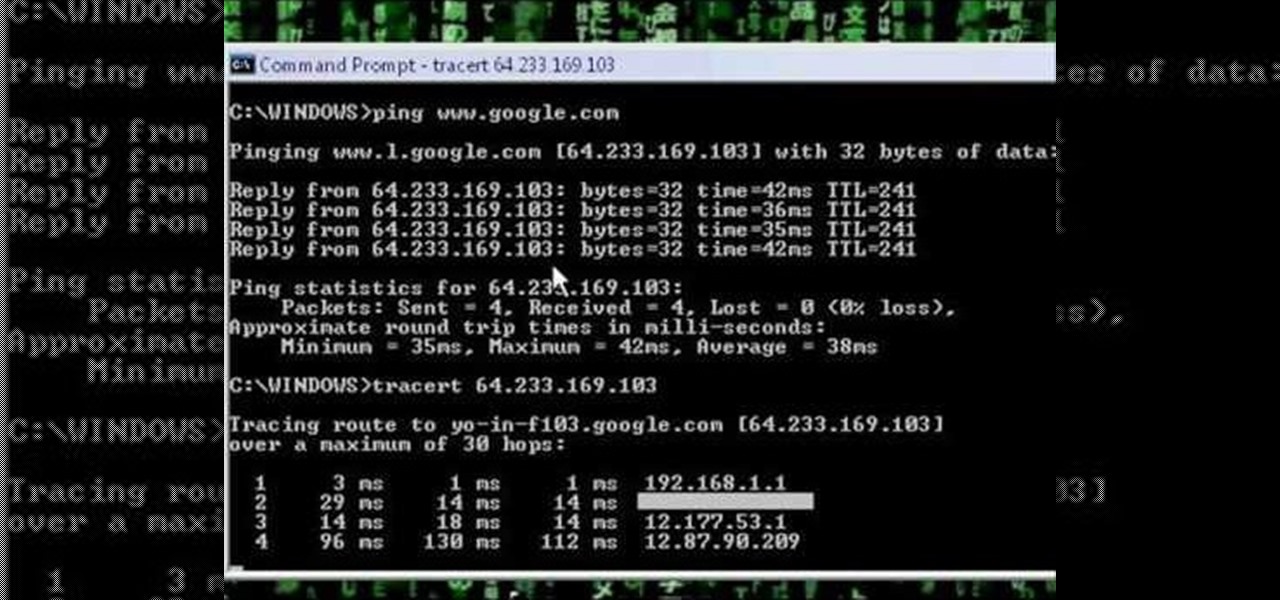
A network security tutorial on using ping and tracert to show th IP of a webserver, your own IP, your ISP's IP, who they connect to, and what computers your request goes through before reaching a destination.

Learn the ins and outs of do-it-yourself network cable installation including how to modify other cables into Ethernet cables.

Do you have an old computer that may be too slow to play video games? You may think it's totally useless, but CNET Video teaches you how to turn it into a network server that functions as a centralized depository for your files!

In this tutorial, you'll learn about the cables required for setting up a small home or office network. Fortunately, cable selection is an easy process and this video presents a complete guide. For more information, including a full demonstration and detailed, step-by-step instructions, watch this helpful home-computing how-to.