There is so much information in the world that trying to make sense of it all can be daunting. That's where data analytics comes in. By learning how to inspect and model data, you can take large data sets and transform them into highly valuable information that can take any business further.

Before the internet, acquiring enough data to analyze was challenging. Now we have the opposite problem: a deluge of data makes trying to sort through it nearly impossible. That's where data science comes in.

If you're reading this, you're likely a tech-savvy coding pro whose analytical talents are mostly applied to designing apps, cracking passwords, and infiltrating networks — all of which are admirable activities for both aspiring and seasoned white hat hackers. But there are other profitable ways that you can put these types of skills to use, namely in the world of investment and trading.

You don't need to work in the accounting department of a Fortune 500 company to use and appreciate Microsoft Excel. Although primarily associated with a wide variety of functions pertaining to accounting and finance, Excel is actually an incredibly powerful and multifaceted platform that can be found at the heart of many large-scale analytics environments.

Watch the video to learn what it is all about. Locationary is a new system which rewards you for sharing your local knowledge.
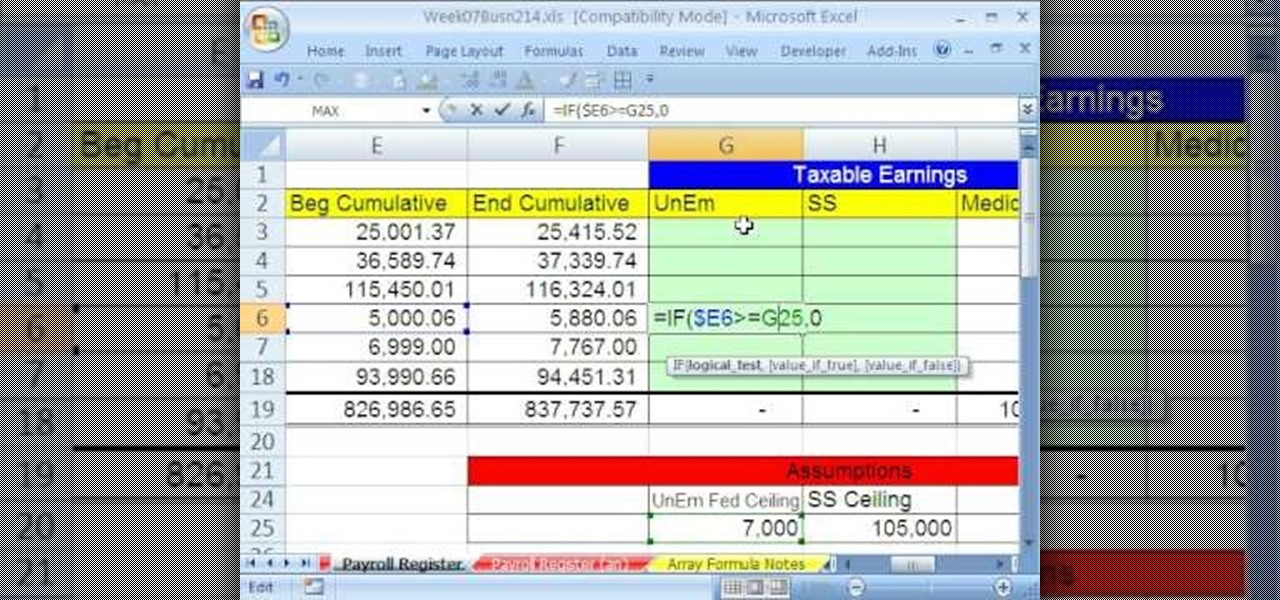
Whether you're interested in learning Microsoft Excel from the bottom up or just looking to pick up a few tips and tricks, you've come to the right place. In this tutorial from everyone's favorite digital spreadsheet guru, ExcelIsFun, the 34th installment in his "Highline Excel Class" series of free video Excel lessons, you'll learn how to create a formula that will calculate the taxable earnings for a payroll period when there are ceilings (hurdles maximum) for taxable earnings (above which ...

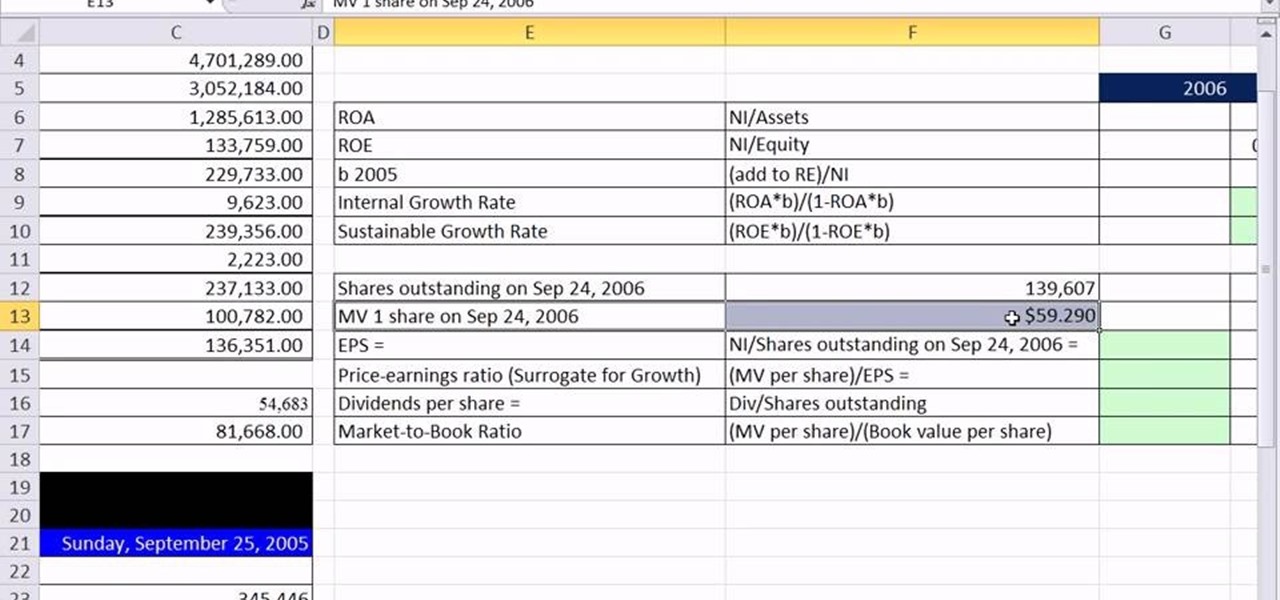
As you might guess, one of the domains in which Microsoft Excel really excels is finance math. Brush up on the stuff for your next or current job with this how-to. In this tutorial from everyone's favorite digital spreadsheet guru, YouTube's ExcelIsFun, the 11th installment in his "Excel Finance Class" series of free video lessons, you'll learn how to calculate the Earnings per Share EPS, Price to Earnings (PE), Dividends per Share, Internal Growth and Sustainable Growth ratios in Excel.
After closing its 2017 financial books on a high note, Snap, Inc. is planning to ride the momentum of its augmented reality products into the new year. That's the main takeaway following the company's 2017 earnings conference call, which was held on Tuesday.
The Chinese government's tight restrictions on gathering data by foreign firms for 3D mapping, the lifeblood of machine-taught driverless systems, could at least slow down access to the market by Waymo, Tesla, General Motors (GM), Ford, and other players hoping to make inroads there.
During Snap Inc.'s quarterly earnings report, released on Tuesday, the company disclosed that it snagged a revenue total of $230.8 million for the first quarter of 2018, an increase of 54% compared to last year, largely fueled by its augmented reality offerings and other advertising products.
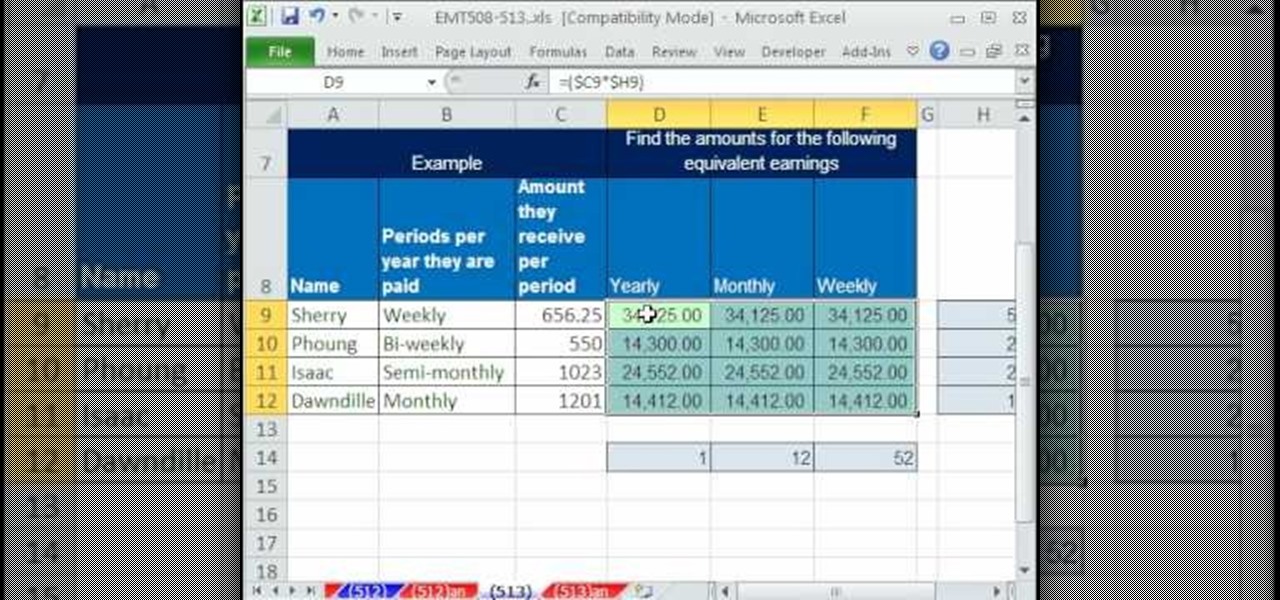
In this video, ExcellsFun takes you step by step on how to calculate your employee payroll using an excel spread sheet. ExcellsFun teaches you how to take the base pay of various employees' salaries and determines how much you are paying them over a week, month, and year. Excellsfun also shows you how to incorporate various pay periods including weekly, semi-weekly, bi-weekly, and monthly on the same form using the same calculation for the entire spread sheet. After watching this video, you w...
Earnings calls can be a mixed bag. If things are business as usual, the meetings can be, well, boring.
Apple computers have long been maligned as the computer for Starbucks aficionados and graphic artists. "Dude, have you used Excel on a Mac? It's terrible," says everyone that owns a Dell. The whole PC versus Mac battle was encapsulated in what I think to be the greatest ad campaign of all time, "I'm a PC and I'm a Mac." And yes, I know that PC really stands for Personal Computer, which means that a Mac would be a PC, but for the sake of the article, it will mean all things non Mac.
With the Super Bowl just days away, it seems appropriate to draw parallels between football and the professional sport of technology business, or, more specifically, the augmented reality segment.
I was a slap-happy T-Mobile customer before, but now, after hearing that the company sent out a box of rolling papers to certain media sites with memes bad mouthing #VerHIGHzon ... I love you even more, John Legere!
Welcome to the maiden voyage of our new Market Reality column. Each Friday, NextReality will give you a roundup of news briefs from the financial end of the augmented and mixed reality industry. We'll cover funding news, market analysis, and more.
This week's Apple earnings offered a report of solid performance and guarded optimism about future iPhone sales, which may be impacted later this year by issues around the current coronavirus epidemic in China.
Get a crash course on HScript Expressions, Variables, and Attributes in Houdini 10. If you don't even know what this means, then you probably need to check this video tutorial series out. Understanding how to massage data in Houdini is key to giving yourself the creative edge and allowing you to unleash mind-blowing visual effects. This 18-part video series covers a variety of simple yet essential weapons in your arsenal including Global, Standard and Custom Variables to Math and String Modif...
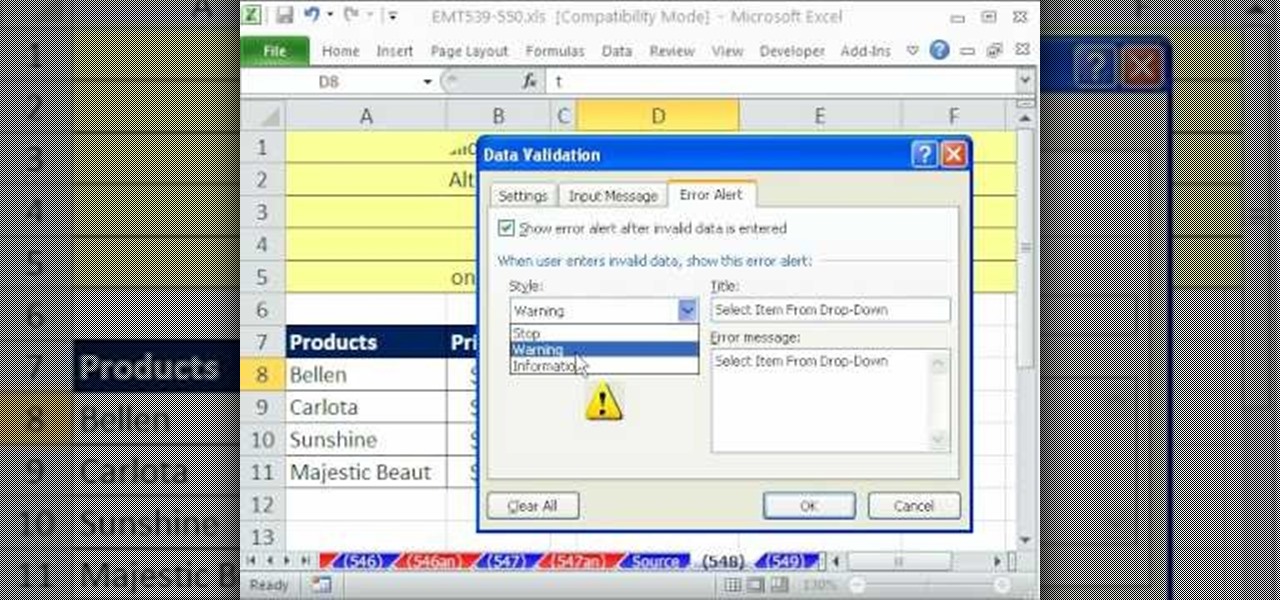
In this video tutorial, viewers learn how to create drop down menus in Microsoft Excel. This task is very easy, fast and easy to do. Begin by highlighting a desired cell. Then click on the Data tab and click on Data Validation under Data Tools. When the Data Validates window opens, click on the Error tab and deselect "Show error alert after invalid data is entered". Then click on OK. Now simply type in the data into the selected cell. This video will benefit those viewers who use Microsoft Ex...
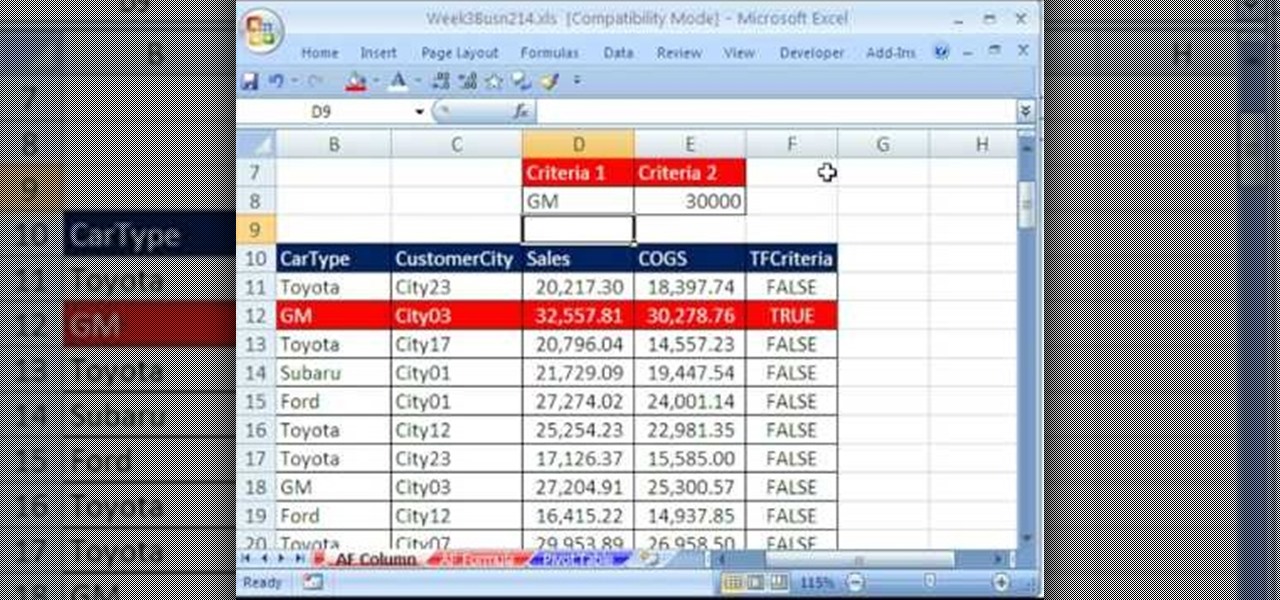
Whether you're interested in learning Microsoft Excel from the bottom up or just looking to pick up a few tips and tricks, you're in the right place. In this tutorial from everyone's favorite digital spreadsheet guru, ExcelIsFun, the 19th installment in his "Highline Excel Class" series of free video Excel lessons, you'll learn about using Advanced Filter to extract data from an Excel List/Table/Database. See these 7 Advanced Filter examples:
Even Halo: Reach on the Xbox 360 has hidden collectable items! All in the convenient (for the people hiding them) size of a small data pad! Earlier you got access to the first 9 data pads that you can get on any difficulty. Next, you will get a look on the next 9 data pads that you can only acquire while being on Legendary difficulty!
If you use Microsoft Excel on a regular basis, odds are you work with numbers. Put those numbers to work. Statistical analysis allows you to find patterns, trends and probabilities within your data. In this MS Excel tutorial from everyone's favorite Excel guru, YouTube's ExcelsFun, the 32nd installment in his "Excel Statistics" series of free video lessons, you'll learn how to group when the quantitative data are whole numbers, integers or discrete data and how to group when the quantitative ...
New to Microsoft Excel? Looking for a tip? How about a tip so mind-blowingly useful as to qualify as a magic trick? You're in luck. In this MS Excel tutorial from ExcelIsFun, the 255th installment in their series of digital spreadsheet magic tricks, you'll learn how to create a two-variable data table in Excel for what-if analysis. See the PMT function and learn about the formula equivalent to a data table.
This video shows how to make a quick pivot table data filtering by using Excel 2010's ‘Slicer’ functionality. ‘Slicer’ delivers enhanced visual filtering method to allow you to get the data you need more quickly. When selecting a cell in the pivot table you will find ‘Slicer’ in the filter group of the ‘Insert’ tab. Click on ‘Slicer’ and an 'Insert Slicer' dialogue shows up where you can pick particular data fields from the slider list. Once you click on ‘OK’, the ‘Slicer’ objects with filter...
Data thieves don't have to be programming wizards to get their hands on your personal information. They often find hard drives that contain financial and other sensitive data at flea markets, charity shops, the city dump—even on eBay. In this video tutorial, PC World explains how to completely erase sensitive data from old drives before recycling or discarding them. Wipe your old hard drives with this how-to.
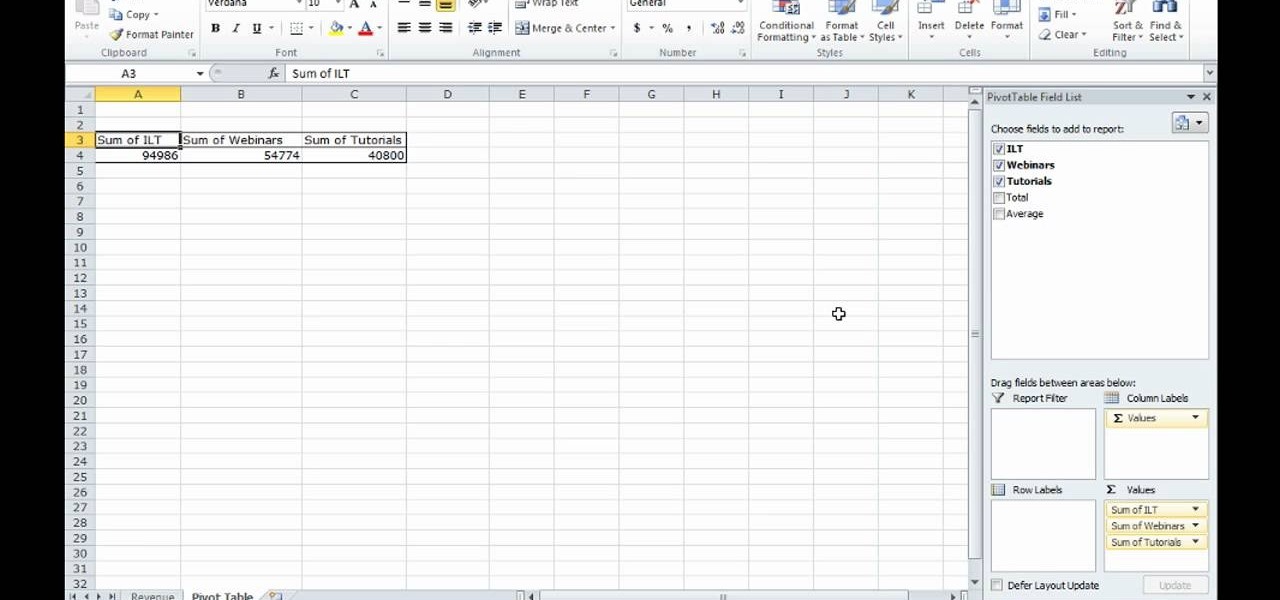
If you use Microsoft Excel on a regular basis, odds are you work with numbers. Put those numbers to work. Statistical analysis allows you to find patterns, trends and probabilities within your data. In this MS Excel tutorial from everyone's favorite Excel guru, YouTube's ExcelsFun, the 24th installment in his "Excel Statistics" series of free video lessons, you'll learn how to create quantitative data frequency distributions with pivot tables. See how to create the correct unambiguous labels ...
If you use Microsoft Excel on a regular basis, odds are you work with numbers. Put those numbers to work. Statistical analysis allows you to find patterns, trends and probabilities within your data. In this MS Excel tutorial from everyone's favorite Excel guru, YouTube's ExcelsFun, the 12th installment in his "Excel Statistics" series of free video lessons, you'll learn how to use Advanced Filter 'Unique Records Only" to extract a list of unique items from a data base, and then use the COUNTI...
Check out this informative video tutorial from Apple on how to format data values with the format bar in Numbers '09.
Core Data is a powerful data-management framework introduced with Mac OS X v10.4 Tiger. When you take advantage of Core Data, it slashes the amount of custom code you need to write in order to manage application data. Opening, saving and undo management can all be handled by Core Data, freeing you to concentrate on creating unique features for your application. This video tutorial, which presents a general introduction to using Core Data, will walk you through the process of building a simple...
This five-part series on C# programming covers many things. First, you learn how to save to the Microsoft SQL Server. Then, you'll learn how to retrieve that data. You'll also learn how to navigate the DataSet, edit SQL data, and delete data. If you have Microsoft Visual Studio and SQL Server, give this lesson a try.
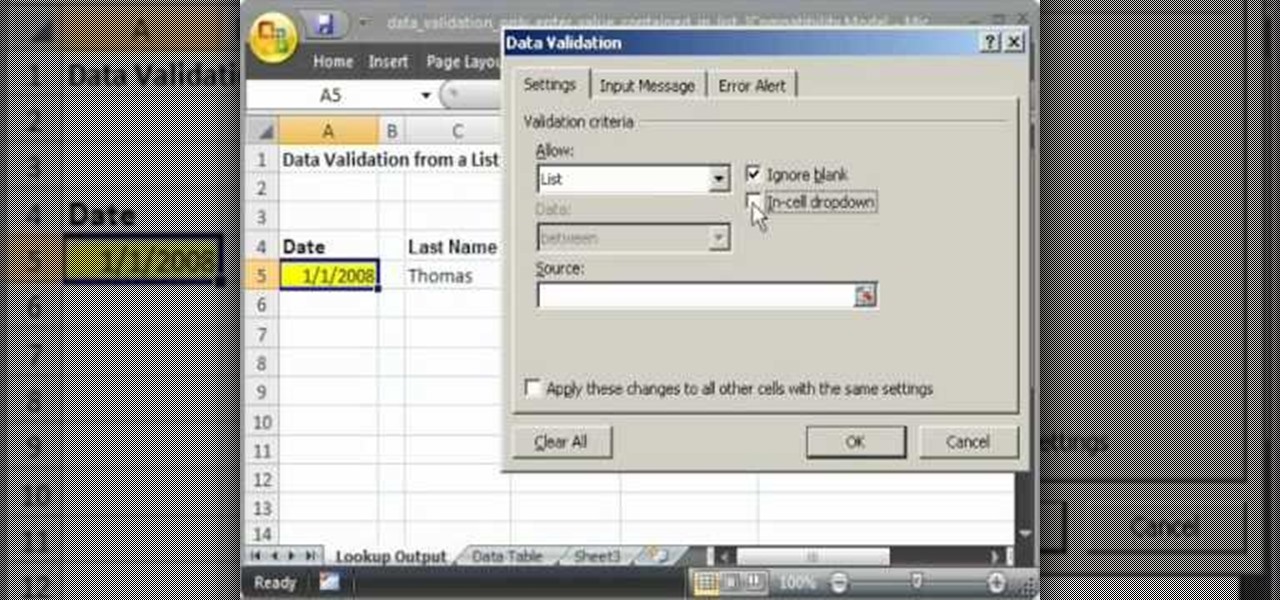
This video shows you how to idiot-proof a data set in Excel pretty much. It demonstrates how to enable data validation in a cell, so that when you type something in it must be in a predetermined list or will not work. Start by typing in your data table in a second tab. His example is a date, then information about certain employees based on that day. To enter the data validation menu, click the cell you want to use and then hit ALT+D+L to bring it up. Go to settings, then under the Allow menu...
Looking to find the standard deviation of your set of values? Standard deviation quantifies how diverse the values of your data set are, and is useful in determining how different your numbers are from each other.
We all have our reasons for erasing personal data from a phone. Whether you just ended a bad relationship whose face you never want to see again (lots of text messages) or just want to restore your privacy on the cell phone, erasing may be your only option.
If you use Microsoft Excel on a regular basis, odds are you work with numbers. Put those numbers to work. Statistical analysis allows you to find patterns, trends and probabilities within your data. In this MS Excel tutorial from everyone's favorite Excel guru, YouTube's ExcelsFun, the 10th installment in his "Excel Statistics" series of free video lessons, you'll learn how about data sets and the nominal, ordinal, interval and ration scales/levels of measurement and see two Pivot Tables that...
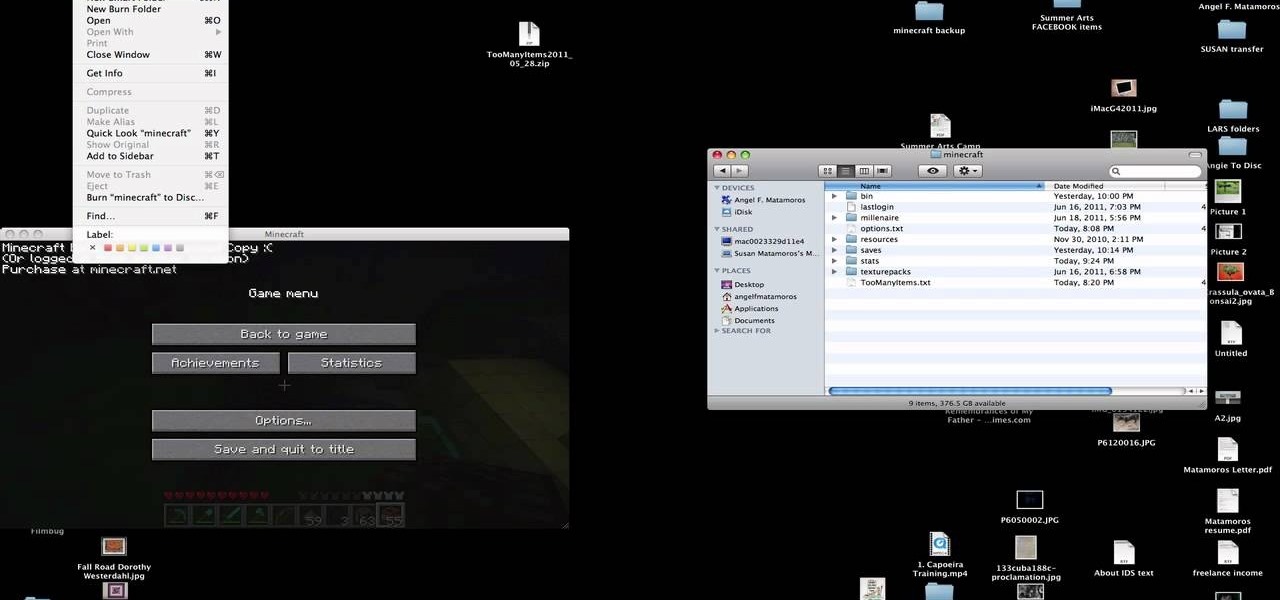
You have worked long and hard creating an entire world of Minecraft data. Make sure you have all of that saved data backed up. Watch this video to learn how to backup your Minecraft data. You will be glad that you did.
Thirty dollars a month may be a little steep for an unlimited data plan for iPad users. To cut down on your data usage, you can download the Offline Pages app to browse articles or blogs offline. InstaPaper is another account you can use as well, and both will cut down on your data usage per month.
If you want to manage what sort of data is entered into your Excel spreadsheet, data validation will help you to accomplish just that. In this Excel tutorial from ExcelIsFun, the 549th installment in their series of Excel magic tricks, you'll learn how to use data validation to full effect in your Microsoft Office projects.
A histogram is a summary graph showing a count of data points that fall in various ranges. Histograms are used in statistics and other forms of mathematics. In this video, learn how to create your own histogram using data analysis on the computer. This tutorial will show you how to create a frequency distribution, a cumulative frequency distribution, a histogram chart and an ogive chart with the data analysis add-in.
See how simple it is to create data-driven web sites using ASP.NET 2.0, Visual Web Developer 2005 Express Edition, and SQL Server 2005 Express Edition. Watch this video tutorial to learn how to create a database, add its data, and display that data on a web page.
The would-be role of Snap Inc. as the first step toward mainstreaming wearable tech in the form of glasses has stalled, and now we have proof. In the company's third quarter financial results report, released on Tuesday, Snap Inc. revealed that it will lose nearly $40 million due to unsold Spectacles, the camera glasses first sold at kiosks throughout the US.