
News: Form Adds Support for Heart Rate Tracking via Polar Sensors to AR Swim Goggles
Less than a month after launching its augmented reality Swim Goggles, wearables startup Form is preparing to add a major new feature for aquatic athletes.

Less than a month after launching its augmented reality Swim Goggles, wearables startup Form is preparing to add a major new feature for aquatic athletes.

We're all aware that Google collects a notable portion of our data. Thanks to the increasing awareness, Google has added a number of privacy controls to limit data collection. But Google doesn't just collect personal data for no reason — many of your favorite apps will use this info to improve their services and add new features.

If you use Microsoft Excel on a regular basis, odds are you work with numbers. Put those numbers to work. Statistical analysis allows you to find patterns, trends and probabilities within your data. In this MS Excel tutorial from everyone's favorite Excel guru, YouTube's ExcelsFun, the 24th installment in his "Excel Statistics" series of free video lessons, you'll learn how to create quantitative data frequency distributions with pivot tables. See how to create the correct unambiguous labels ...

If you use Microsoft Excel on a regular basis, odds are you work with numbers. Put those numbers to work. Statistical analysis allows you to find patterns, trends and probabilities within your data. In this MS Excel tutorial from everyone's favorite Excel guru, YouTube's ExcelsFun, the 12th installment in his "Excel Statistics" series of free video lessons, you'll learn how to use Advanced Filter 'Unique Records Only" to extract a list of unique items from a data base, and then use the COUNTI...

Check out this informative video tutorial from Apple on how to enhance your photos with a single click in iPhoto '09.
Check out this informative video tutorial from Apple on how to format data values with the format bar in Numbers '09.

This five-part series on C# programming covers many things. First, you learn how to save to the Microsoft SQL Server. Then, you'll learn how to retrieve that data. You'll also learn how to navigate the DataSet, edit SQL data, and delete data. If you have Microsoft Visual Studio and SQL Server, give this lesson a try.
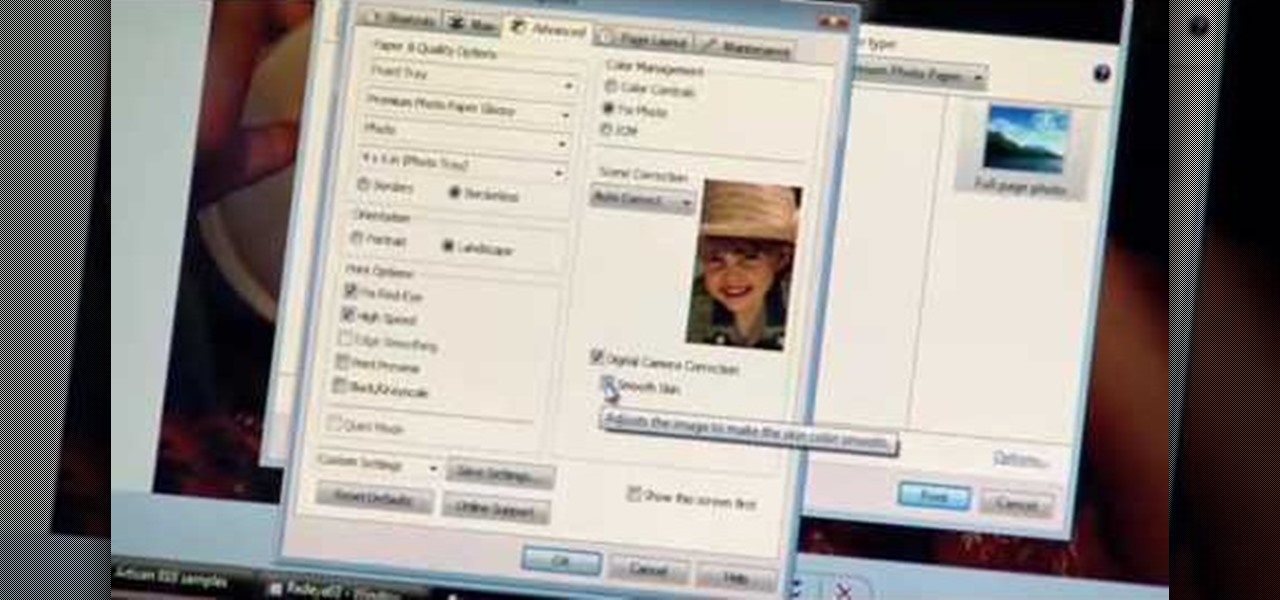
Watch this Epson video tutorial to learn how to automatically enhance digital pics with the Epson Artisan 810 All-in-One Printer.
Core Data is a powerful data-management framework introduced with Mac OS X v10.4 Tiger. When you take advantage of Core Data, it slashes the amount of custom code you need to write in order to manage application data. Opening, saving and undo management can all be handled by Core Data, freeing you to concentrate on creating unique features for your application. This video tutorial, which presents a general introduction to using Core Data, will walk you through the process of building a simple...

Learn how to use traditional Jewish mysticism, from the Kabbalah, to enhance your life.

See how to use Chromakey to enhance your videos and photos. Chromakey is the process of removing one color and replacing it with another but it most often refers to removing green screen or blue screen backgrounds and replacing them with composited videos or images. This lesson uses Pinnacle software for the final video editing, but any editing software can be used - it's more about the principles of the process and setting up the cameras that you'll learn from this video.

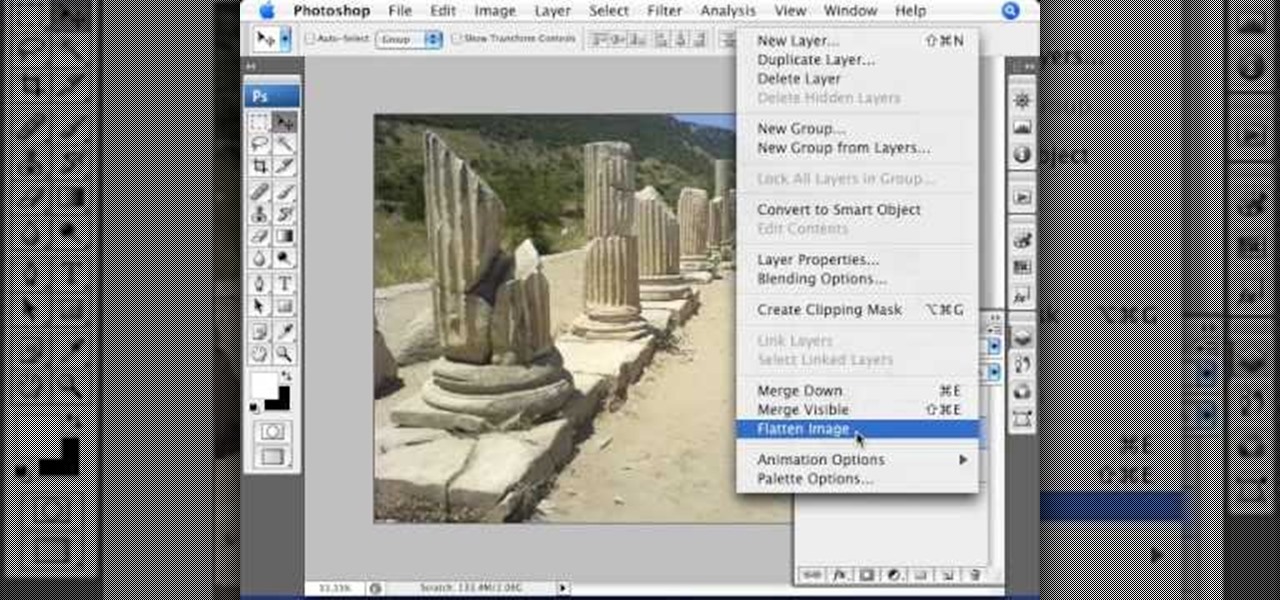
In this video you will learn to enhance a sunrise or sunset using Photoshop. Learn to use the sample tool and gradient to do the job. You won't believe how easy is til you watch this video!

If you use Microsoft Excel on a regular basis, odds are you work with numbers. Put those numbers to work. Statistical analysis allows you to find patterns, trends and probabilities within your data. In this MS Excel tutorial from everyone's favorite Excel guru, YouTube's ExcelsFun, the 32nd installment in his "Excel Statistics" series of free video lessons, you'll learn how to group when the quantitative data are whole numbers, integers or discrete data and how to group when the quantitative ...

New to Microsoft Excel? Looking for a tip? How about a tip so mind-blowingly useful as to qualify as a magic trick? You're in luck. In this MS Excel tutorial from ExcelIsFun, the 255th installment in their series of digital spreadsheet magic tricks, you'll learn how to create a two-variable data table in Excel for what-if analysis. See the PMT function and learn about the formula equivalent to a data table.
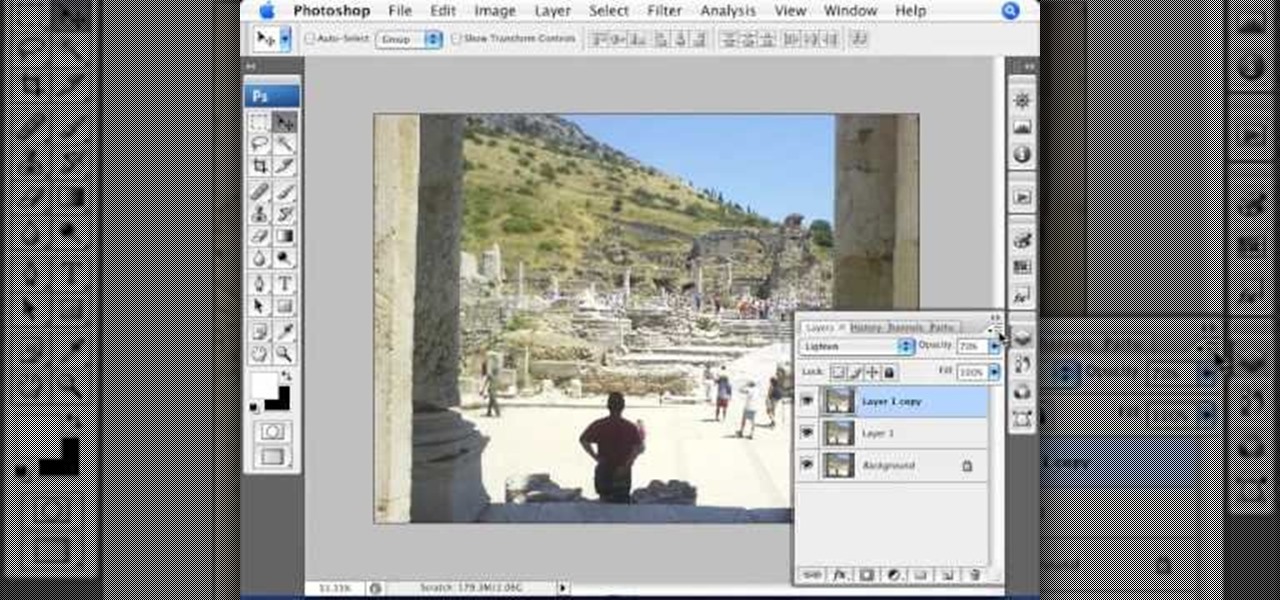
Photoshopuniverse teaches you how to enhance the colors of photos using Adobe Photoshop. You get a photo and duplicate that layer. Set the blending mode to Soft Light. You repeat that step, only the blend mode should be Lighten. The shadows are now darker. You can change the blend mode opacities to 60%-70%, but both layers should have about the same opacity. Also make sure that the white values are not to white and that details, like faces, are still OK to see.
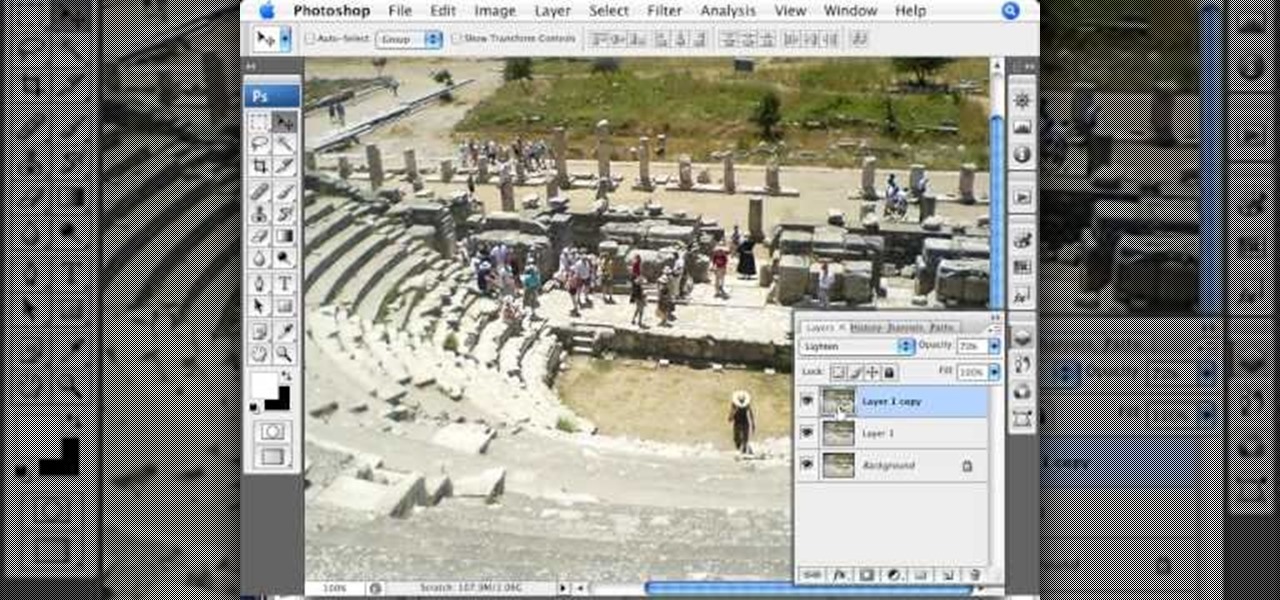
A lot of photos look fantastic when you first take them, but you start to notice some issues with the image when you get a good look at them on your monitor. The color will be nice, but there is noticeable room for improvement in the raw image. You can enhance the color in your image by using automation in Photoshop. This video will take you through the necessary steps to make your final image livelier and more vibrant in Photoshop.
This how-to video produced by Photoshop Universe gives step-by-step instructions on how to batch automate a process in Adobe Photoshop. With this tutorial you'll be able to learn to correct white balance, enhance colors, resize, and save for the web whole folders' worth of images in one go. The first step to doing this is to open up one of the images in your folder and correct the white balance, enhance the colors, resize the photo and save. The next thing you want to do is to record all of t...
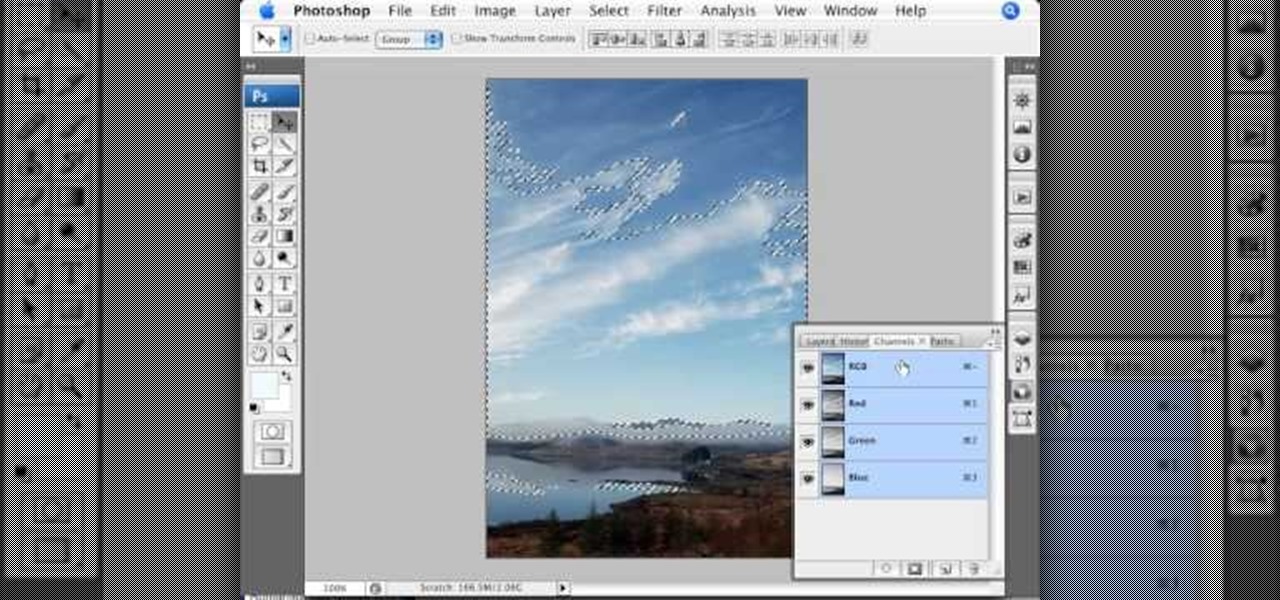
This video is about using a luminosity mask in Photoshop. The luminosity mask is used to enhance the color and contrast in photos that lack each of these. The color is enhanced or punched up. Choose the manipulation tool: channel and RGB. To choose RGB, touch control and then select RGB. Select the 100 % white or light parts of the photo, it will not select the darker or black images. Copy the light parts of the image by using control J. Choose to copy the lightest parts by selecting overlay ...

The Google Assistant is an incredibly useful tool that's now available for both Android and iOS. You can use plain English to send voice commands that range from turning off your smart lights to answering almost any question — but many of these features won't work properly if you have certain Google activity controls disabled.

Excel is great, and if you're a Mac user, Excel 2008 for Mac has a lot of new and useful great features you can use to maximize efficiency in your spreadsheets. Excel doesn't have to be the boss anymore, you can! The Microsoft Office for Mac team shows you all the great features in this how-to video.

Data can be troubling, especially if there's a ton of it plaguing your Excel worksheet. But Excel 2008 for Mac makes life a little easier and less confusing thanks to a few worksheet tips and features you can utilize to work with your data in worksheet cells. The Microsoft Office for Mac team shows you just how to work with worksheets in this how-to video.

Not every client or coworker likes to mine through a spreadsheet to find all the important data. So, with Excel 2008 for Mac, you can easily share that data without sending the entire Excel spreadsheet. To do this, all you need to do is to use the "copy as picture" option. The Microsoft Office for Mac team shows you just how to insert a spreadsheet snippet in this how-to video.
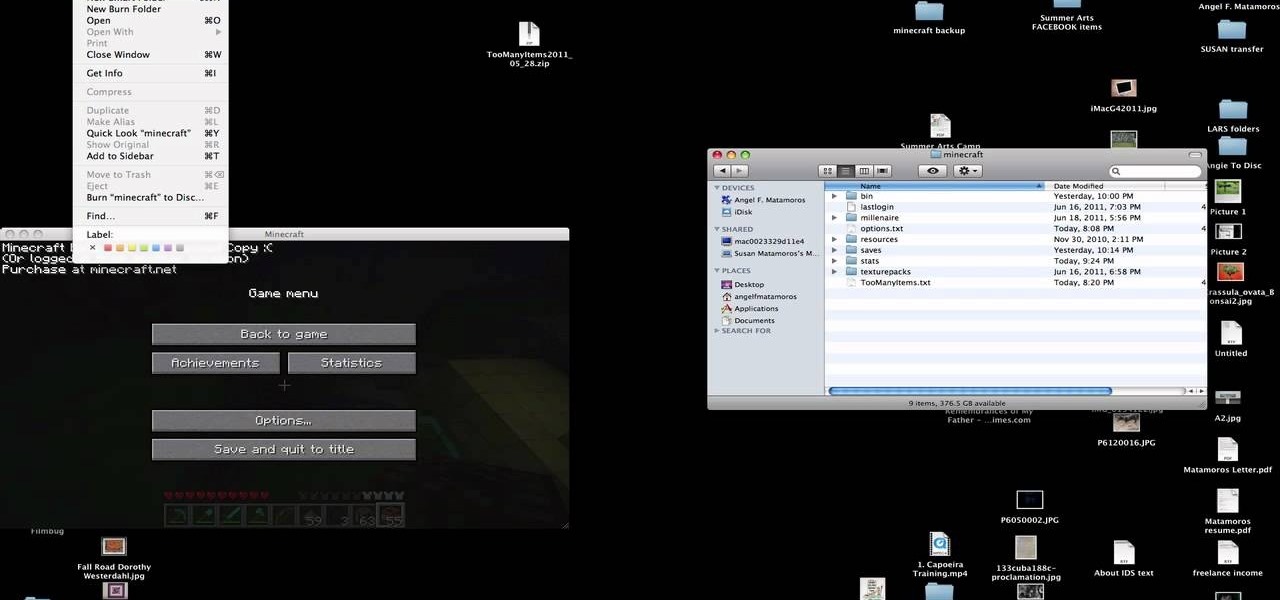
You have worked long and hard creating an entire world of Minecraft data. Make sure you have all of that saved data backed up. Watch this video to learn how to backup your Minecraft data. You will be glad that you did.

Thirty dollars a month may be a little steep for an unlimited data plan for iPad users. To cut down on your data usage, you can download the Offline Pages app to browse articles or blogs offline. InstaPaper is another account you can use as well, and both will cut down on your data usage per month.

A histogram is a summary graph showing a count of data points that fall in various ranges. Histograms are used in statistics and other forms of mathematics. In this video, learn how to create your own histogram using data analysis on the computer. This tutorial will show you how to create a frequency distribution, a cumulative frequency distribution, a histogram chart and an ogive chart with the data analysis add-in.

See how simple it is to create data-driven web sites using ASP.NET 2.0, Visual Web Developer 2005 Express Edition, and SQL Server 2005 Express Edition. Watch this video tutorial to learn how to create a database, add its data, and display that data on a web page.
In this video, we learn how to enhance the audio in your Camtasia Studio 5 videos. First, set your video to 640x480 and then choose the option to zoom yourself. Now, click the zoom in button to zoom in on the time line with your audio. Then, right click the audio and go to "audio enhancement". Once here, click the first option under background noise removal, then click the remove background noise button. Now, when you play back your audio, you will hear a huge difference in what you just play...

There are three people in this world who don't need contouring: Marion Cotillard, Halle Berry, and Gisele. That's it. Unless your cheekbones are so sharp they could grate cheese, you could probably benefit from a little highlighting here and a little bronzing there.

We're all for natural beauty, and we think you look great with or without makeup, but there's one thing we are a stickler about: eyebrows. There's no girl out there with the perfect set: they're either perfectly shaped but too sparse, thick enough but evocative of Groucho Marx, or too light for anyone to see.
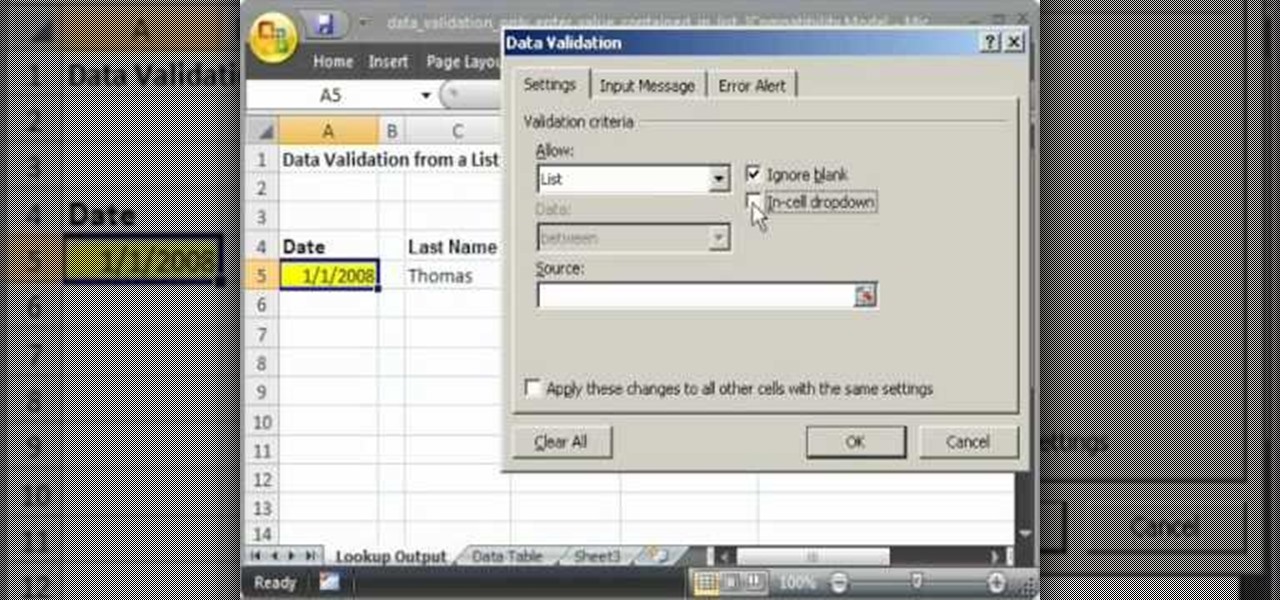
This video shows you how to idiot-proof a data set in Excel pretty much. It demonstrates how to enable data validation in a cell, so that when you type something in it must be in a predetermined list or will not work. Start by typing in your data table in a second tab. His example is a date, then information about certain employees based on that day. To enter the data validation menu, click the cell you want to use and then hit ALT+D+L to bring it up. Go to settings, then under the Allow menu...

Looking to find the standard deviation of your set of values? Standard deviation quantifies how diverse the values of your data set are, and is useful in determining how different your numbers are from each other.

If you enjoy arts and crafts, pop-up, scrapbooking and origami, you will enjoy these craft projects too. Like origami, kirigami is the craft of paper, with the added technique of paper cutting. Kirigami will enhance any origami, pop-up and scrapbook projects and scrapbook and origami techniques will enhance kirigami. Kirigami pop-up blossoms, butterflies and puppets make unique gifts or cards for any occasion and the recipient will enjoy seeing their gift, card or pop-up take form before thei...

In Halo: Reach for the Xbox 360, there is so much to do! The campaign, the multiplayer, the achievements! But One tough one to get is all 19 hidden data pads. Luckily for you, the first nine can be acquired on any difficulty, and in this video you will learn the locations of all nine of the initial data pads on levels such as Winter Contingency and Pillar of Autumn!

We all have our reasons for erasing personal data from a phone. Whether you just ended a bad relationship whose face you never want to see again (lots of text messages) or just want to restore your privacy on the cell phone, erasing may be your only option.

If you use Microsoft Excel on a regular basis, odds are you work with numbers. Put those numbers to work. Statistical analysis allows you to find patterns, trends and probabilities within your data. In this MS Excel tutorial from everyone's favorite Excel guru, YouTube's ExcelsFun, the 27th installment in his "Excel Statistics" series of free video lessons, you'll learn how to create a quantitative data dot plot chart using the REPT and COUNTIF functions.

If you use Microsoft Excel on a regular basis, odds are you work with numbers. Put those numbers to work. Statistical analysis allows you to find patterns, trends and probabilities within your data. In this MS Excel tutorial from everyone's favorite Excel guru, YouTube's ExcelsFun, the 16th installment in his "Excel Statistics" series of free video lessons, you'll learn how to cross tabulate & do percentage cross tabulation for categorical data using a pivot table (PivotTable).

If you use Microsoft Excel on a regular basis, odds are you work with numbers. Put those numbers to work. Statistical analysis allows you to find patterns, trends and probabilities within your data. In this MS Excel tutorial from everyone's favorite Excel guru, YouTube's ExcelsFun, the 17th installment in his "Excel Statistics" series of free video lessons, you'll learn how to cross tabulate & do percentage cross tabulation for categorical data using formulas rather than pivot tables.

If you use Microsoft Excel on a regular basis, odds are you work with numbers. Put those numbers to work. Statistical analysis allows you to find patterns, trends and probabilities within your data. In this MS Excel tutorial from everyone's favorite Excel guru, YouTube's ExcelsFun, the 10th installment in his "Excel Statistics" series of free video lessons, you'll learn how about data sets and the nominal, ordinal, interval and ration scales/levels of measurement and see two Pivot Tables that...

There is so much information in the world that trying to make sense of it all can be daunting. That's where data analytics comes in. By learning how to inspect and model data, you can take large data sets and transform them into highly valuable information that can take any business further.
Data is king. Nearly every carrier and MVNO offers unlimited talk and text with their cellular plans. Where they differ is the amount of data available, so that's the part that can save or cost you the most money.