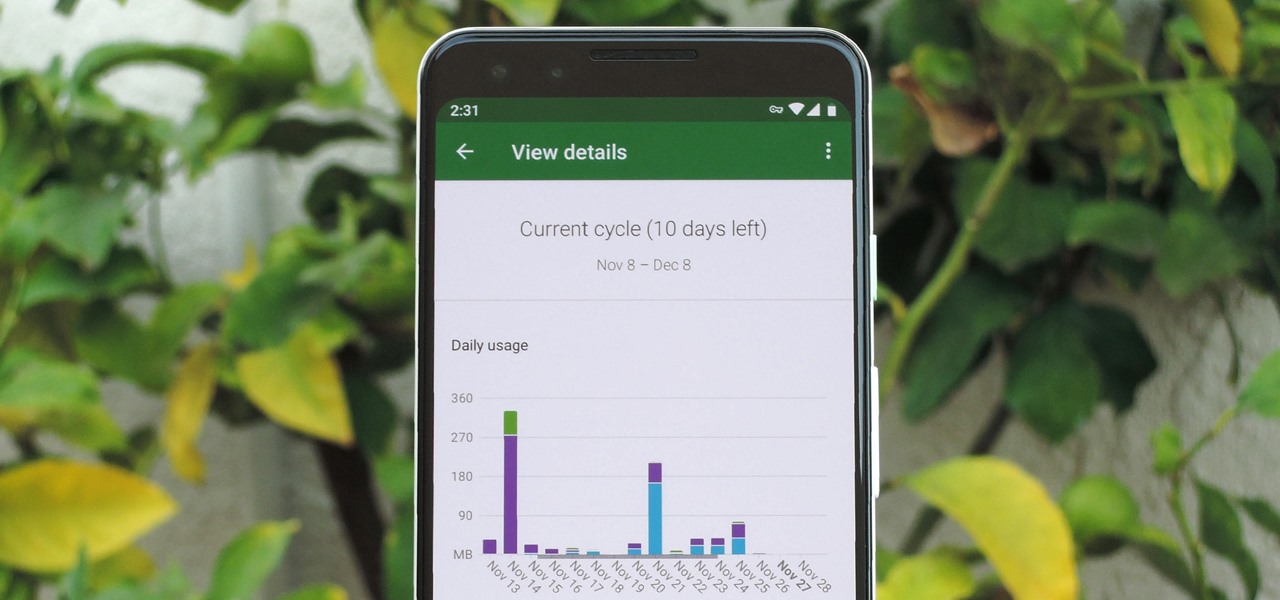
We're all aware that Google collects a notable portion of our data. Thanks to the increasing awareness, Google has added a number of privacy controls to limit data collection. But Google doesn't just collect personal data for no reason — many of your favorite apps will use this info to improve their services and add new features.
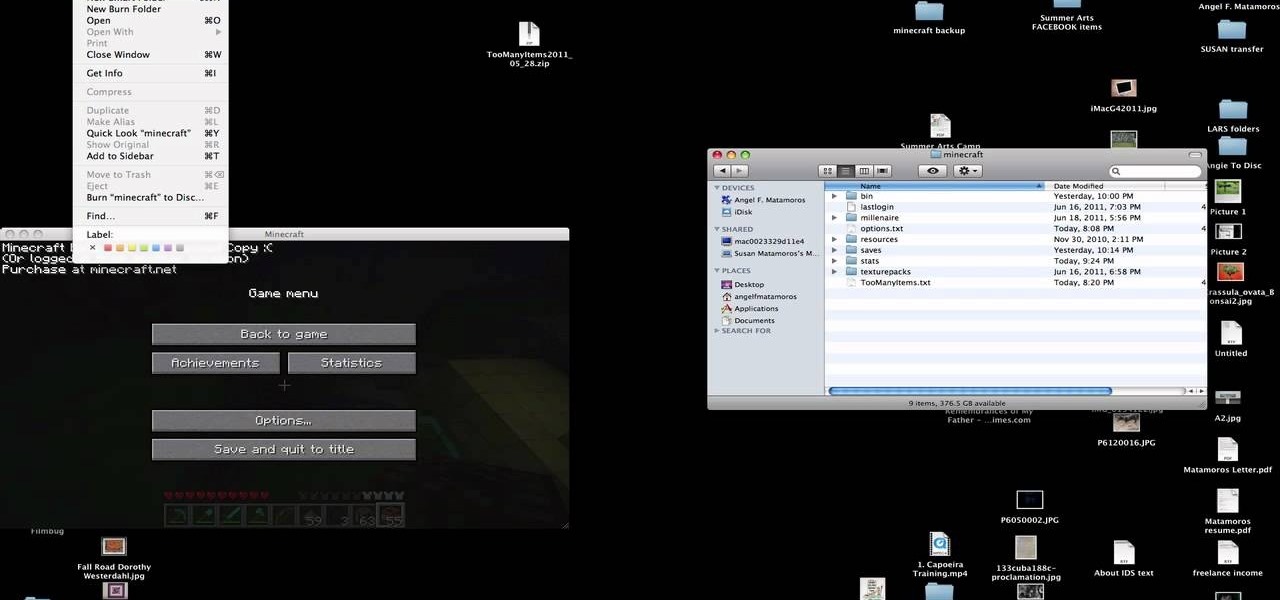
You have worked long and hard creating an entire world of Minecraft data. Make sure you have all of that saved data backed up. Watch this video to learn how to backup your Minecraft data. You will be glad that you did.

Thirty dollars a month may be a little steep for an unlimited data plan for iPad users. To cut down on your data usage, you can download the Offline Pages app to browse articles or blogs offline. InstaPaper is another account you can use as well, and both will cut down on your data usage per month.
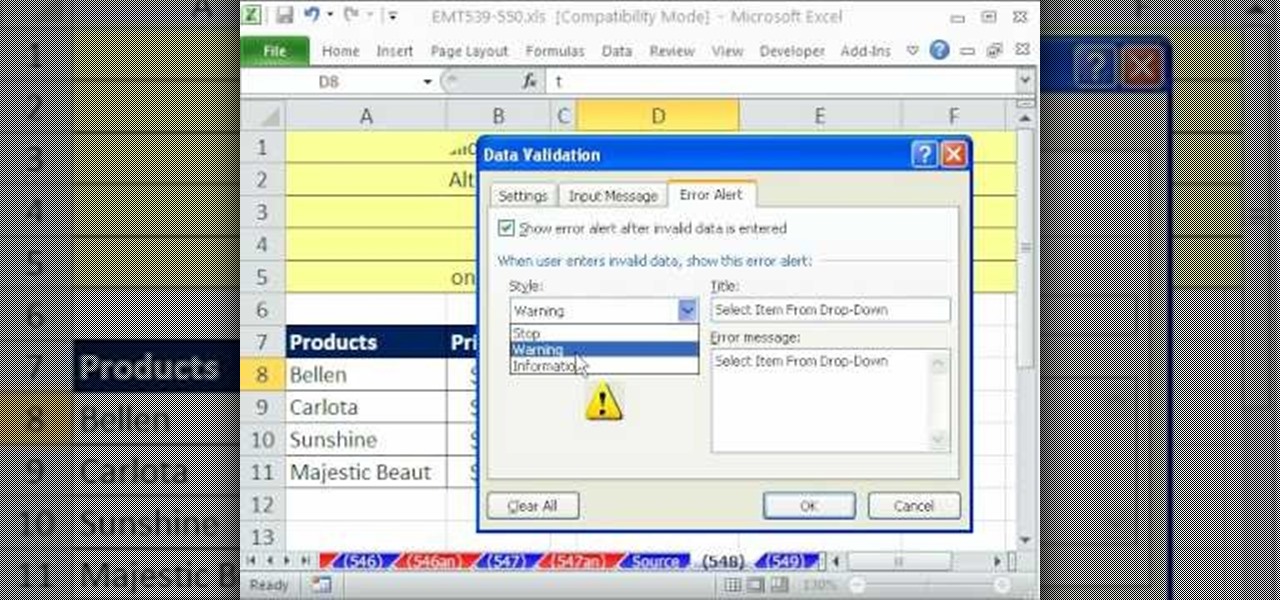
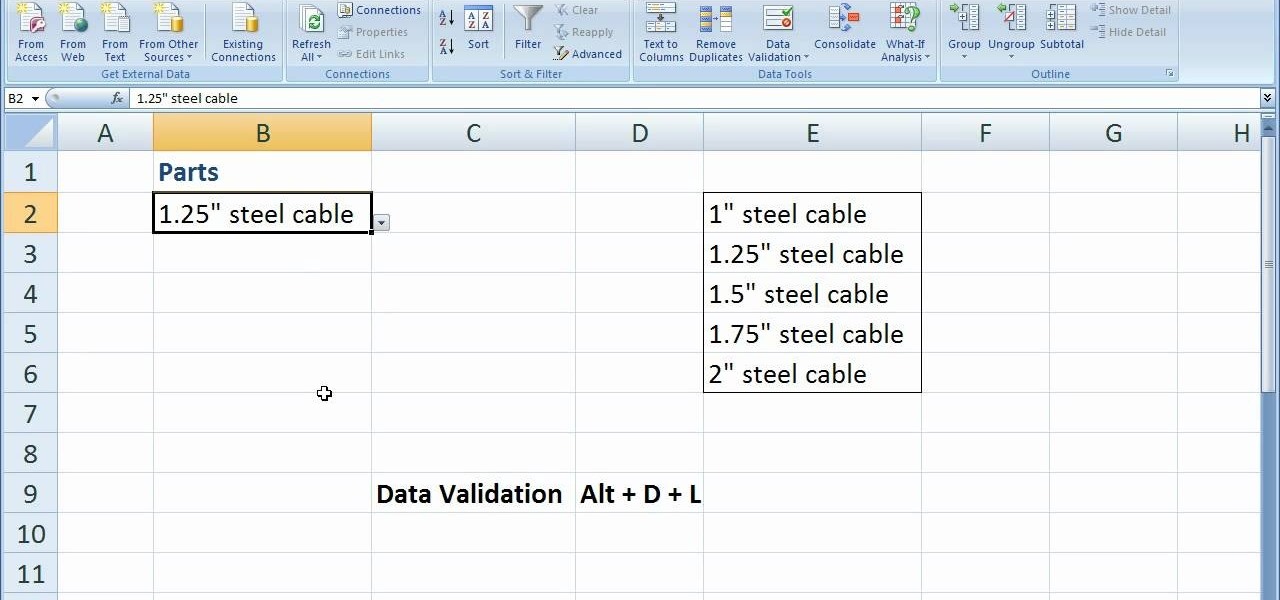
If you want to manage what sort of data is entered into your Excel spreadsheet, data validation will help you to accomplish just that. In this Excel tutorial from ExcelIsFun, the 549th installment in their series of Excel magic tricks, you'll learn how to use data validation to full effect in your Microsoft Office projects.
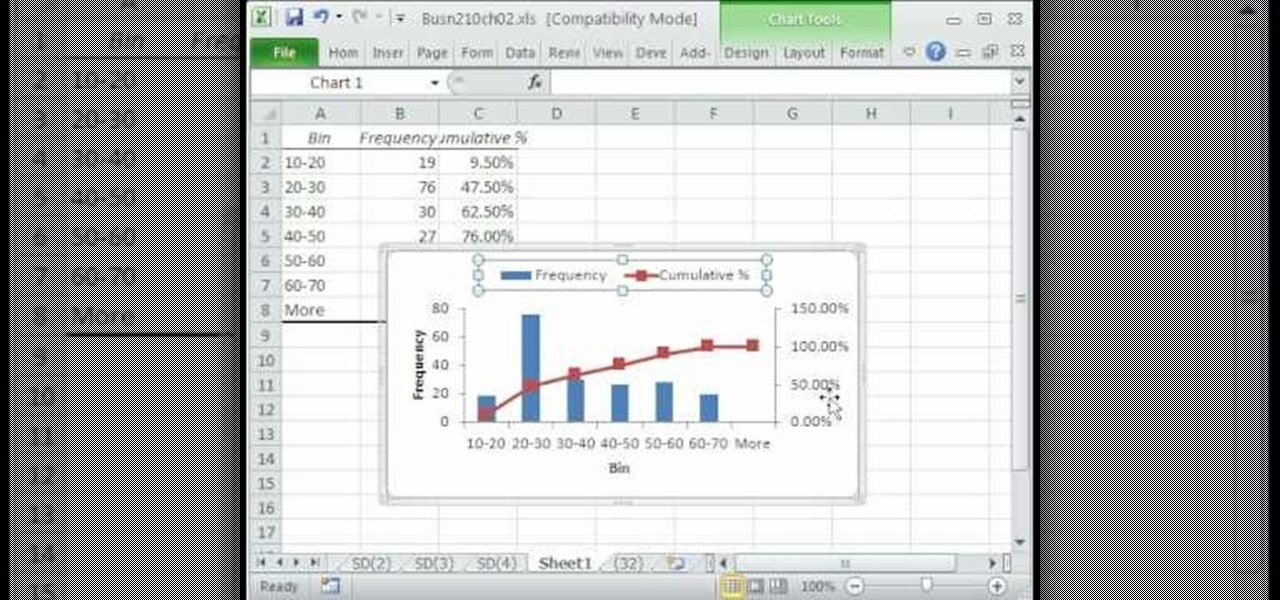
A histogram is a summary graph showing a count of data points that fall in various ranges. Histograms are used in statistics and other forms of mathematics. In this video, learn how to create your own histogram using data analysis on the computer. This tutorial will show you how to create a frequency distribution, a cumulative frequency distribution, a histogram chart and an ogive chart with the data analysis add-in.

Looking to find the standard deviation of your set of values? Standard deviation quantifies how diverse the values of your data set are, and is useful in determining how different your numbers are from each other.

Learn how to stretch your paper and prepare it for painting in the watercolor style from this how-to video series. Pick up some techniques for watercolor, like wet on wet paint, using salt for texture, creating shadows, detailing, color choice, and finishing. Watch these video painting tutorials and learn how to watercolor a pre-drawn painting.

See how simple it is to create data-driven web sites using ASP.NET 2.0, Visual Web Developer 2005 Express Edition, and SQL Server 2005 Express Edition. Watch this video tutorial to learn how to create a database, add its data, and display that data on a web page.

In Halo: Reach for the Xbox 360, there is so much to do! The campaign, the multiplayer, the achievements! But One tough one to get is all 19 hidden data pads. Luckily for you, the first nine can be acquired on any difficulty, and in this video you will learn the locations of all nine of the initial data pads on levels such as Winter Contingency and Pillar of Autumn!

We all have our reasons for erasing personal data from a phone. Whether you just ended a bad relationship whose face you never want to see again (lots of text messages) or just want to restore your privacy on the cell phone, erasing may be your only option.

If you use Microsoft Excel on a regular basis, odds are you work with numbers. Put those numbers to work. Statistical analysis allows you to find patterns, trends and probabilities within your data. In this MS Excel tutorial from everyone's favorite Excel guru, YouTube's ExcelsFun, the 27th installment in his "Excel Statistics" series of free video lessons, you'll learn how to create a quantitative data dot plot chart using the REPT and COUNTIF functions.

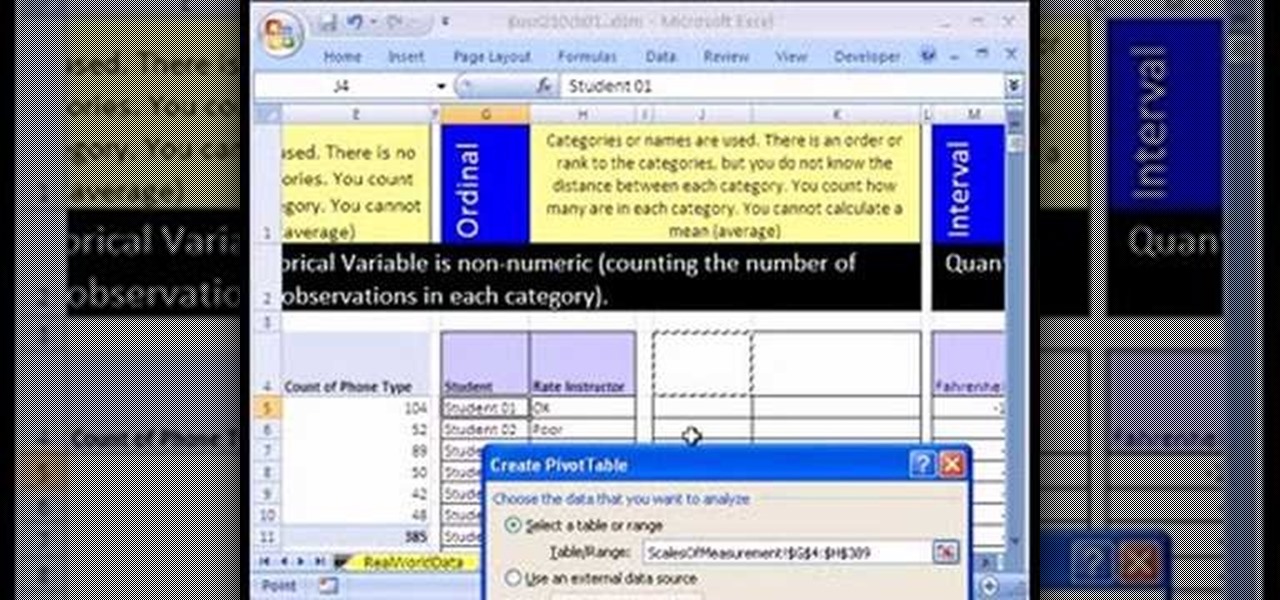
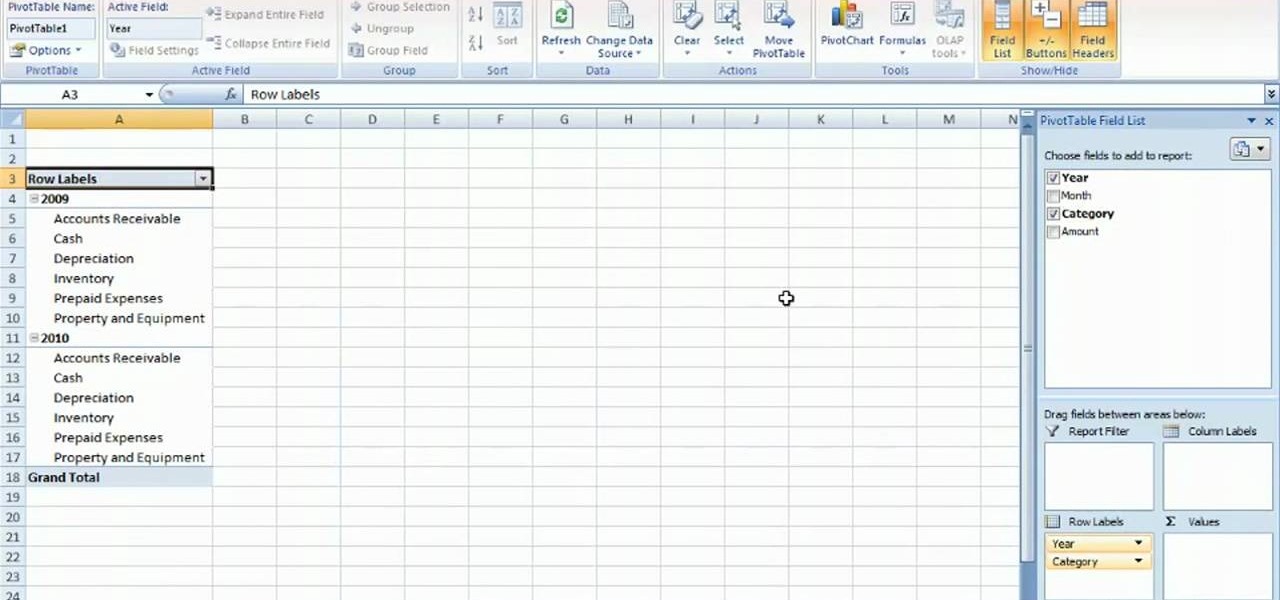
If you use Microsoft Excel on a regular basis, odds are you work with numbers. Put those numbers to work. Statistical analysis allows you to find patterns, trends and probabilities within your data. In this MS Excel tutorial from everyone's favorite Excel guru, YouTube's ExcelsFun, the 16th installment in his "Excel Statistics" series of free video lessons, you'll learn how to cross tabulate & do percentage cross tabulation for categorical data using a pivot table (PivotTable).

If you use Microsoft Excel on a regular basis, odds are you work with numbers. Put those numbers to work. Statistical analysis allows you to find patterns, trends and probabilities within your data. In this MS Excel tutorial from everyone's favorite Excel guru, YouTube's ExcelsFun, the 17th installment in his "Excel Statistics" series of free video lessons, you'll learn how to cross tabulate & do percentage cross tabulation for categorical data using formulas rather than pivot tables.

If you use Microsoft Excel on a regular basis, odds are you work with numbers. Put those numbers to work. Statistical analysis allows you to find patterns, trends and probabilities within your data. In this MS Excel tutorial from everyone's favorite Excel guru, YouTube's ExcelsFun, the 10th installment in his "Excel Statistics" series of free video lessons, you'll learn how about data sets and the nominal, ordinal, interval and ration scales/levels of measurement and see two Pivot Tables that...

There is so much information in the world that trying to make sense of it all can be daunting. That's where data analytics comes in. By learning how to inspect and model data, you can take large data sets and transform them into highly valuable information that can take any business further.

Data is king. Nearly every carrier and MVNO offers unlimited talk and text with their cellular plans. Where they differ is the amount of data available, so that's the part that can save or cost you the most money.

Excel is great, and if you're a Mac user, Excel 2008 for Mac has a lot of new and useful great features you can use to maximize efficiency in your spreadsheets. Excel doesn't have to be the boss anymore, you can! The Microsoft Office for Mac team shows you all the great features in this how-to video.

Smartphones are becoming pocket computers, jammed full of data essential to our personal and professional lives. With AT&T's 360 Backup app you can protect your important information with the push of a few buttons.

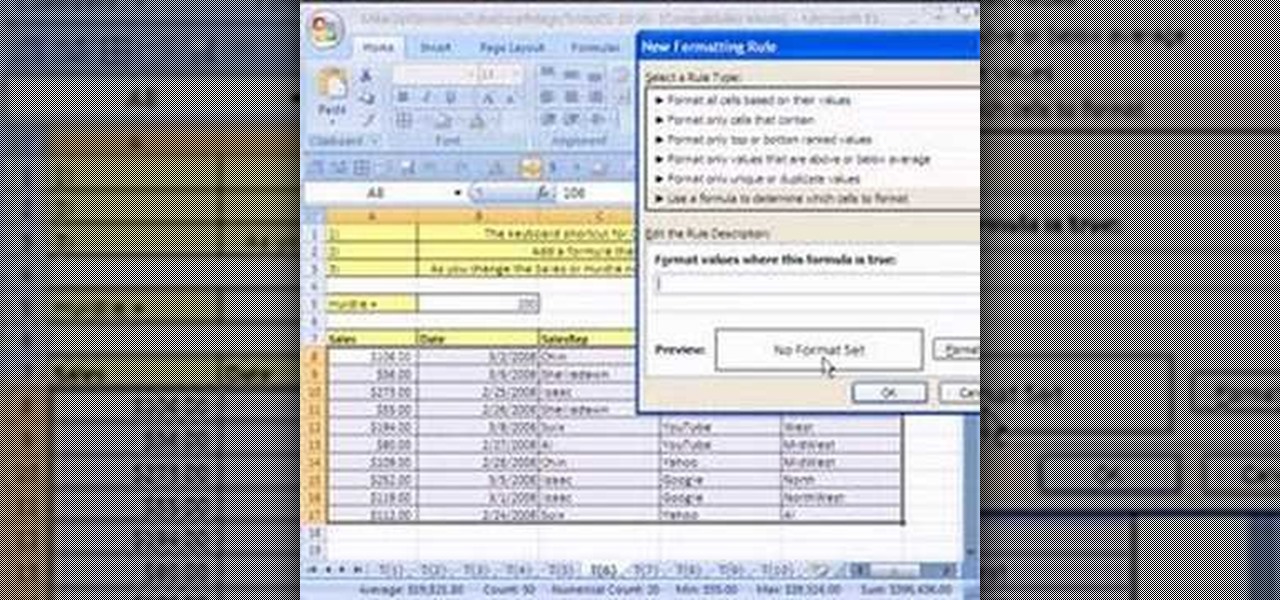
New to Microsoft Excel? Looking for a tip? How about a tip so mind-blowingly useful as to qualify as a magic trick? You're in luck. In this MS Excel tutorial from ExcelIsFun, the 6th installment in their series of digital spreadsheet magic tricks, you'll learn how to add conditional formatting to a whole row of data in an Excel sheet.

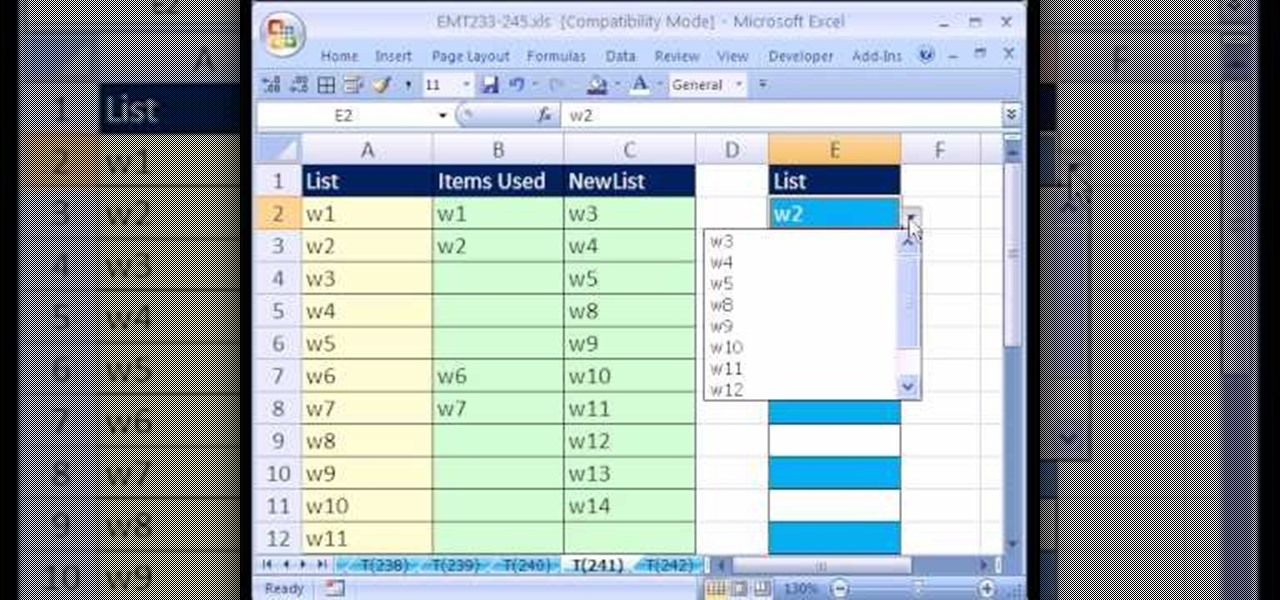
New to Microsoft Excel? Looking for a tip? How about a tip so mind-blowingly useful as to qualify as a magic trick? You're in luck. In this MS Excel tutorial from ExcelIsFun, the 241st installment in their series of digital spreadsheet magic tricks, you'll learn how to create a data validation drop-down cell list where the list shrinks as you select values.

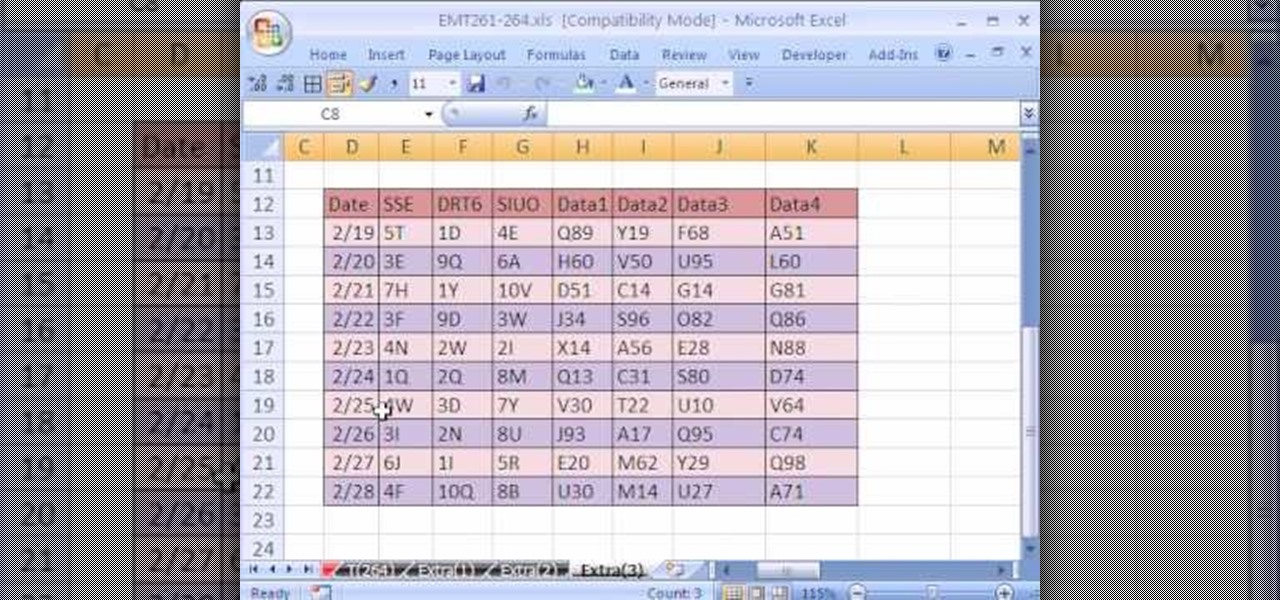
New to Excel? Looking for a tip? How about a tip so mind-blowingly useful as to qualify as a magic trick? You're in luck. In this Excel tutorial from ExcelIsFun, the 264th installment in their series of digital spreadsheet magic tricks, you'll learn how to use a recorded macro to take a data set and add a new column, concatenate data from 3 columns, and delete unwanted columns.

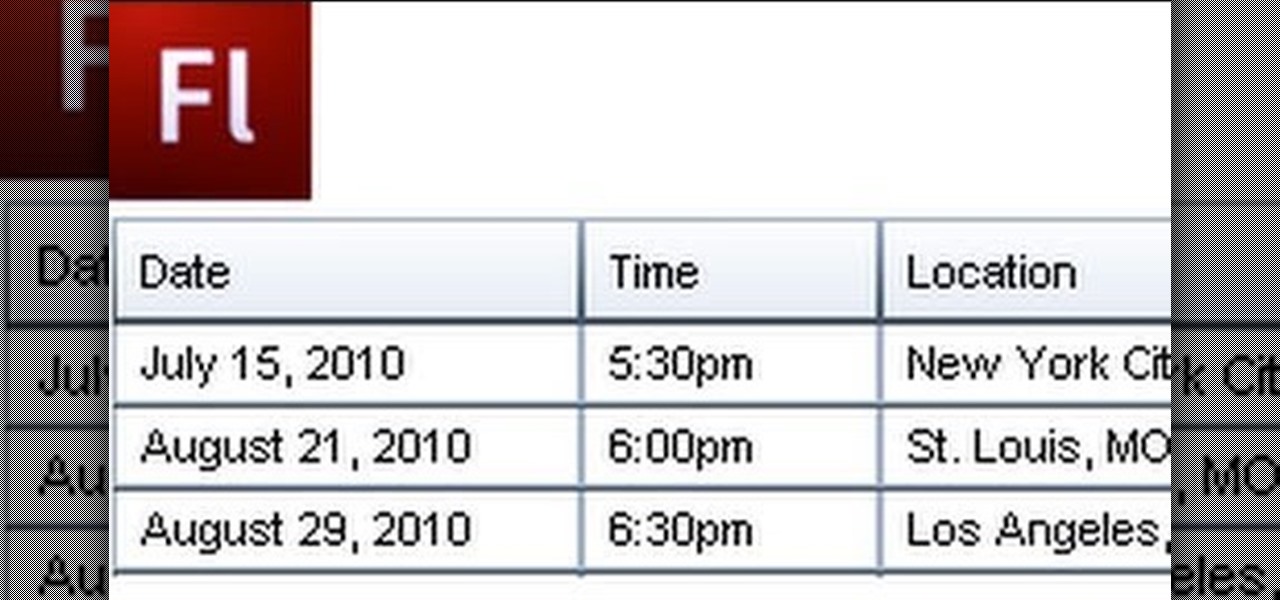
A Data Grid lets you organize information on your website or other Flash project. Create lists or schedules, like concert dates, by using the Data Grid component included in Adobe Flash CS4, and then modify it using Action Script 3.

In this software video tutorial you will learn how to create drop down menus in Excel using Data Validation. This example will show you how to display a list of parts in a drop down menu. Create the list of parts somewhere in your worksheet. Then in the cell underneath the one where you want to display the parts, go to the data validation window and enter the data. For this select the cell and then press 'Alt + D + L' to bring up the data validation box. Here you click on 'settings' and selec...

Learn how to create a summary of your budget data. Whether you're new to Microsoft's popular digital spreadsheet application or a seasoned business professional just looking to better acquaint yourself with the Excel 2010 workflow, you're sure to be well served by this video tutorial. For more information, and to get started summarizing your own budget data, watch this free video guide.

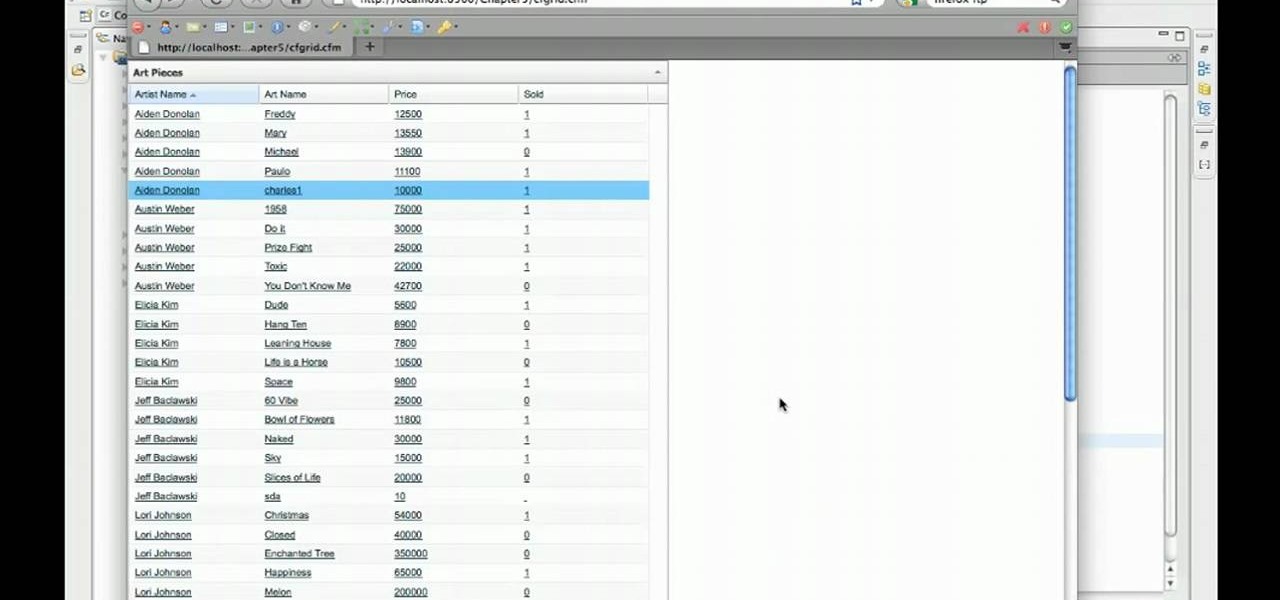
Quickly and intelligently organize your information through use of ColdFusion 9's ever-useful data grid feature. Whether you're new to Adobe's popular rapid Internet application development platform or simply wish to become better acquainted with the program, you're sure to find benefit in this free video software tutorial. For more information, including specific, step-by-step instructions, take a look.

Want to know how to back up your data to an external hard drive? Protect yourself against data loss and heartbreak with this free home computing how-to from the folks at CNET TV, which offers complete instructions on how to back up your important files either manually or automatically. For specifics, and to get started backing up your own stuff, watch this handy how-to.

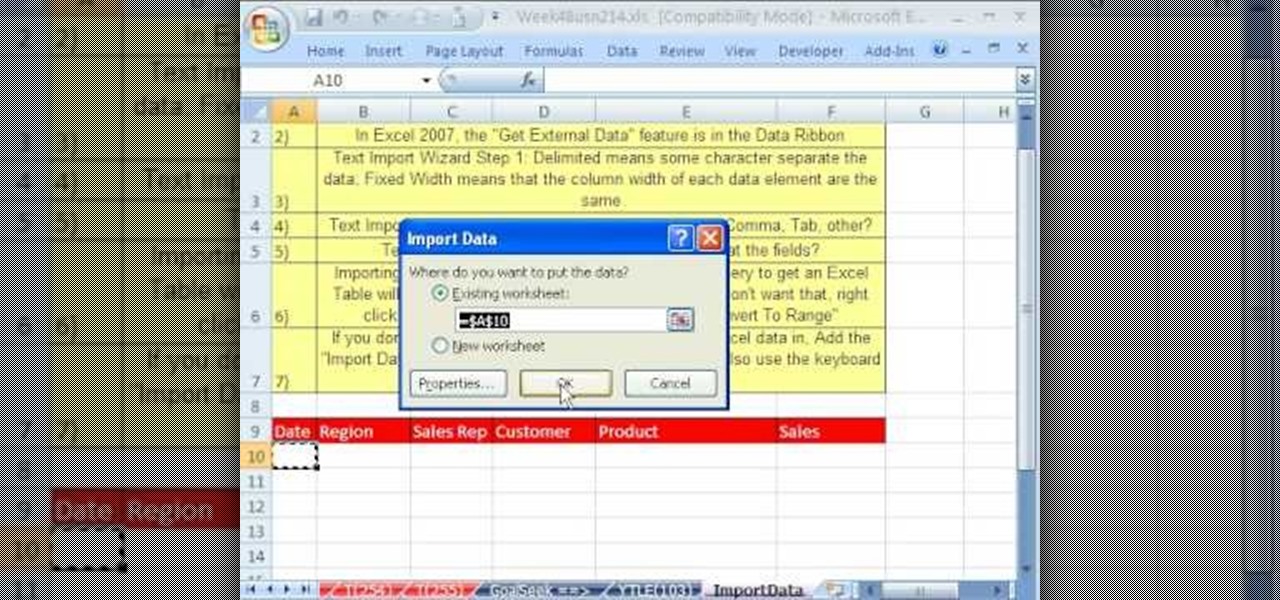
Whether you're interested in learning Microsoft Excel from the bottom up or just looking to pick up a few tips and tricks, you're in the right place. In this tutorial from everyone's favorite digital spreadsheet guru, ExcelIsFun, the 23rd installment in his "Highline Excel Class" series of free video Excel lessons, you'll learn how to import data into Excel from text files, web sites, Excel files and Microsoft Office Access files. Also see how to import currency rates and major indicies from ...

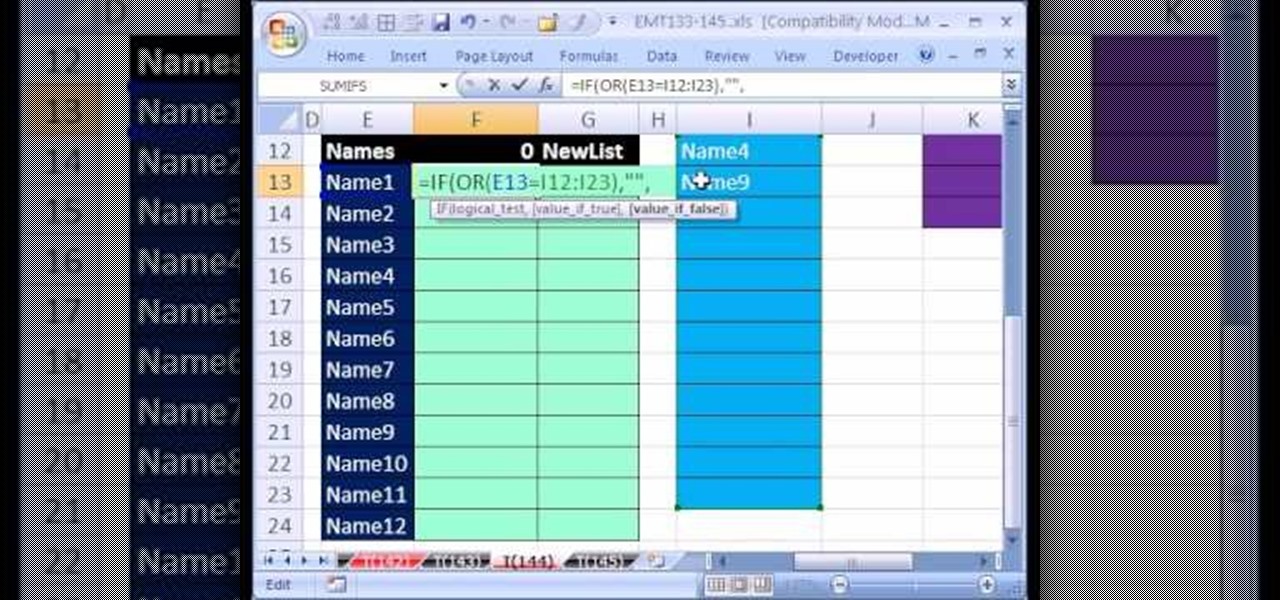
Love Microsoft Excel? This clip contains a tip that just might induce you to. With this free video tutorial from ExcelIsFun, the 144th installment of his "YouTubers Love Excel" or YTLE series of free video MS Excel lessons, you'll learn how to work around data validation's one-rule limit by creating a second shrinking list that looses values as they are used in the data validation area.

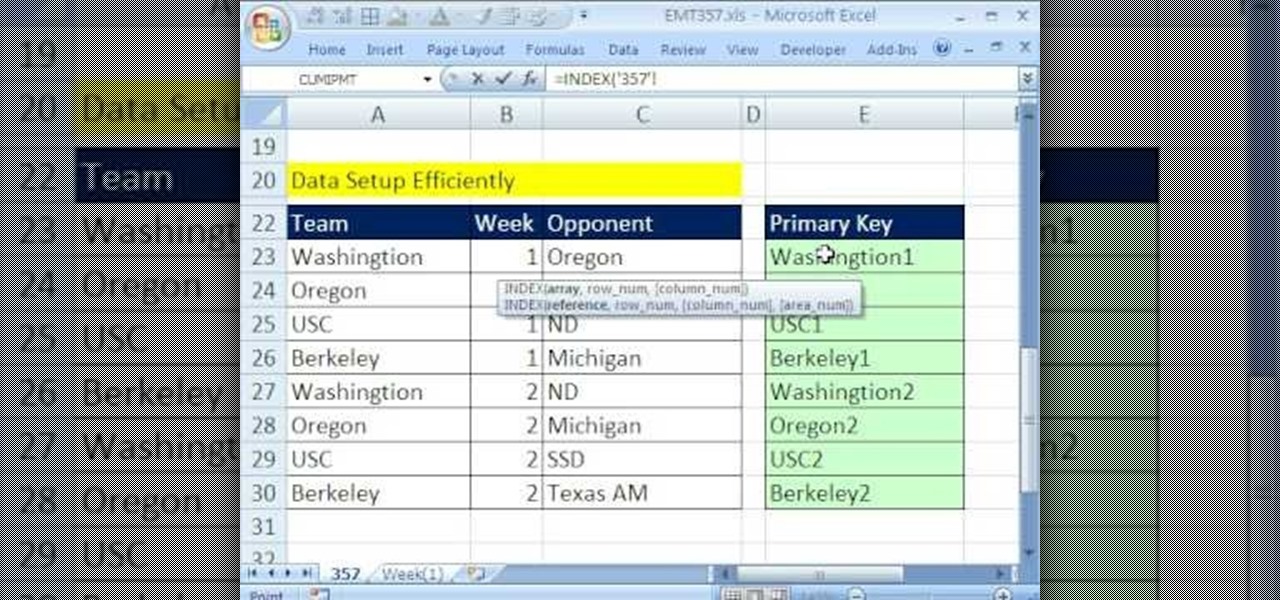
New to Microsoft Excel? Looking for a tip? How about a tip so mind-blowingly useful as to qualify as a magic trick? You're in luck. In this MS Excel tutorial from ExcelIsFun, the 357th installment in their series of digital spreadsheet magic tricks, you'll learn how to pull data from individual sheets to a single master sheet given improper data setup.

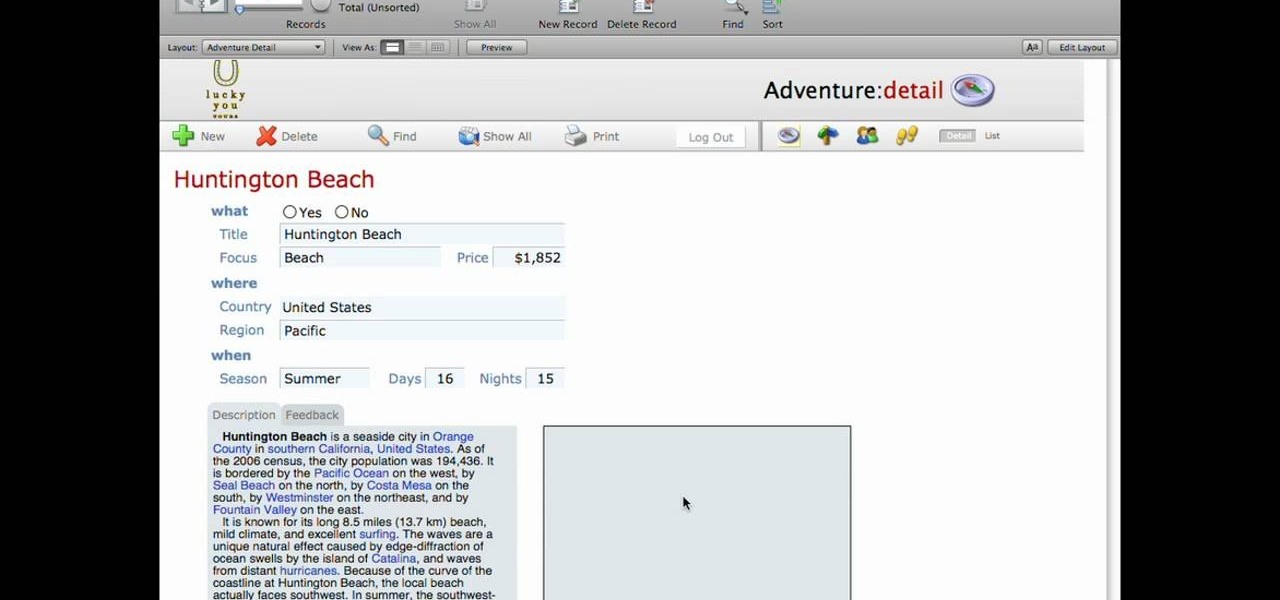
This lynda.com video tutorial shows how to use container fields with FileMaker Pro 10. When you want to create fields in FileMaker database you have the choice on what kind of fields you want to make. Many general fields are self explanatory like text, date etc., but there is a special kind of field called the container field. FileMaker Pro container field is a versatile data type in that it can store any kind of binary data. Container fields can be used to hold binary data in four broad clas...

This tutorial on the companion Tech Ease for Mac site shows you how to use Inspiredata to collect, organize, and visualize data using several types of diagrams supported by the program. The movies were recorded on a Mac, but Inspiredata is a cross-platform program so the steps shown should work on the Windows version of the program as well. Inspiredata works like a database system that allows you to add notes and more.

Your data is your most important asset on your computer. Learn how to keep your data safe using Carbonite.com

This new episode of Full Disclosure shows you how to use a SSH Tunnel to secure your data when you are on an untrusted LAN (ex. Coffee Shop, School's network, or Defcon). Furthermore, you can use the SSH Tunnel to bypass the LAN's internet filters. The SSH tunnel protocol works by encapsulates your data into an encrypted payload and transmitting it to the SSH Server which is setup on a trusted LAN.

QR codes allow you to quickly and easily store and retrieve data within a single image. Much like barcodes at grocery stores, QR codes are images that can be scanned to discover data, such as an online website URL. Additionally, they can also be created by inputting text data into a QR code generator. Try scanning some of the QR codes in this video with an app on your phone or tablet to see how they work!

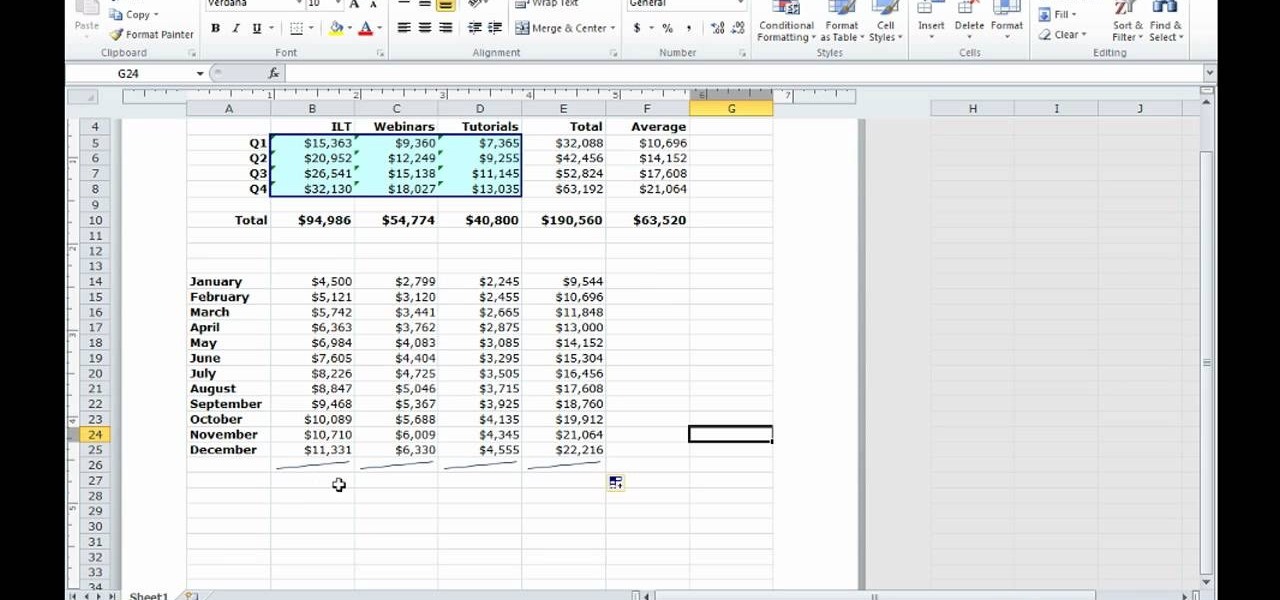
There is a new function in MS Excel 2010 called ‘Sparkline’ which helps you quickly find trends associated with a set of data. To create Sparkline, you can go to ‘Insert’ tab and then select ‘Sparkline’ section and then select the graph type. After you enter the data range and location range, the Sparkline will show up indicating the trend based on the data range you identified earlier. You can change the types and styles of your Sparkline easily. As the video demonstrates, whenever you use E...

Before the internet, acquiring enough data to analyze was challenging. Now we have the opposite problem: a deluge of data makes trying to sort through it nearly impossible. That's where data science comes in.

Few things are more important than being well-versed in data analytics and interpretation when it comes to succeeding in today's increasingly data-driven world. As a data scientist, these skills are the key to a high-paying career. For hackers, there's no better way to defeat the enemy than to become the enemy.

In case you hadn't heard, Google is now a legit cell service provider. Google Fi has its pluses and minuses, but the biggest upside is in the pricing. Depending on how much data you typically use, there's a good chance you could save a lot of money without sacrificing coverage by switching to Fi.

So much information exists online that it's easy to get lost in data while researching. Understanding the bigger picture can take a lot of time and energy, but narrowing the question to one that's easy to answer is the first step of any investigation. That's why analysts use open-source intelligence (OSINT) tools like Maltego — to help refine raw data into a complete understanding of a situation.

Mobile data is expensive. The internet connection that comes with your cell phone plan is generally limited to a certain amount of gigabytes that can be downloaded before your monthly cap kicks in, at which point you run the risk of incurring costly overage fees.


