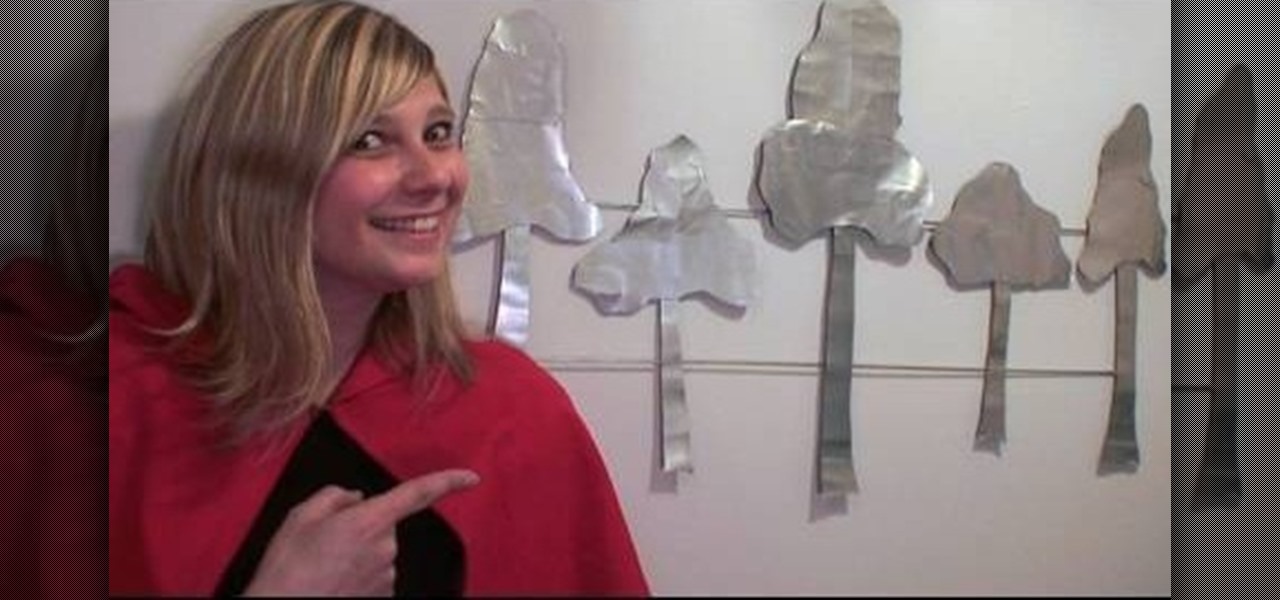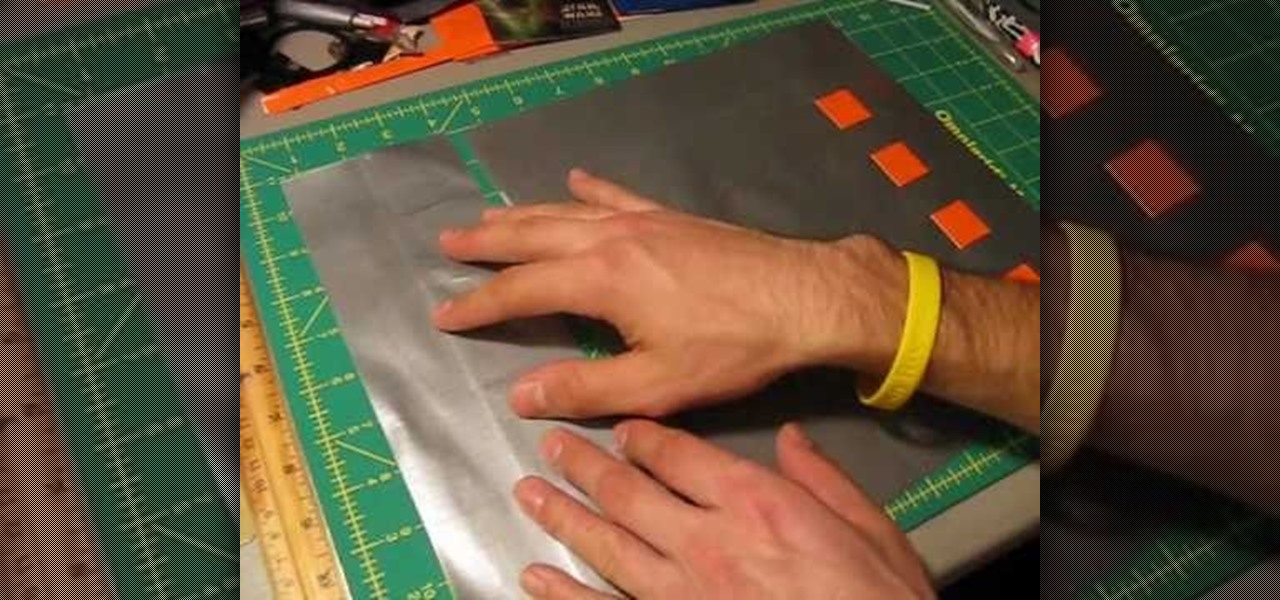
More duct tape fashion accessories! This tutorial shows you how to make a tote bag or a beach bag out of silver duct tape. You don't need a pattern or base, just grab a roll of duct tape and follow along!
See how to make your very own nautical-themed bikini bathing suit with this fashion designer's guide. Though you might find the process daunting if you've never made a bathing suit before, it's easier than you'd think. So easy, in fact, that this video tutorial can present a complete overview of the process in just over five minutes' time. For detailed instructions, and to get started making your own sailor girl bikini, take a look.
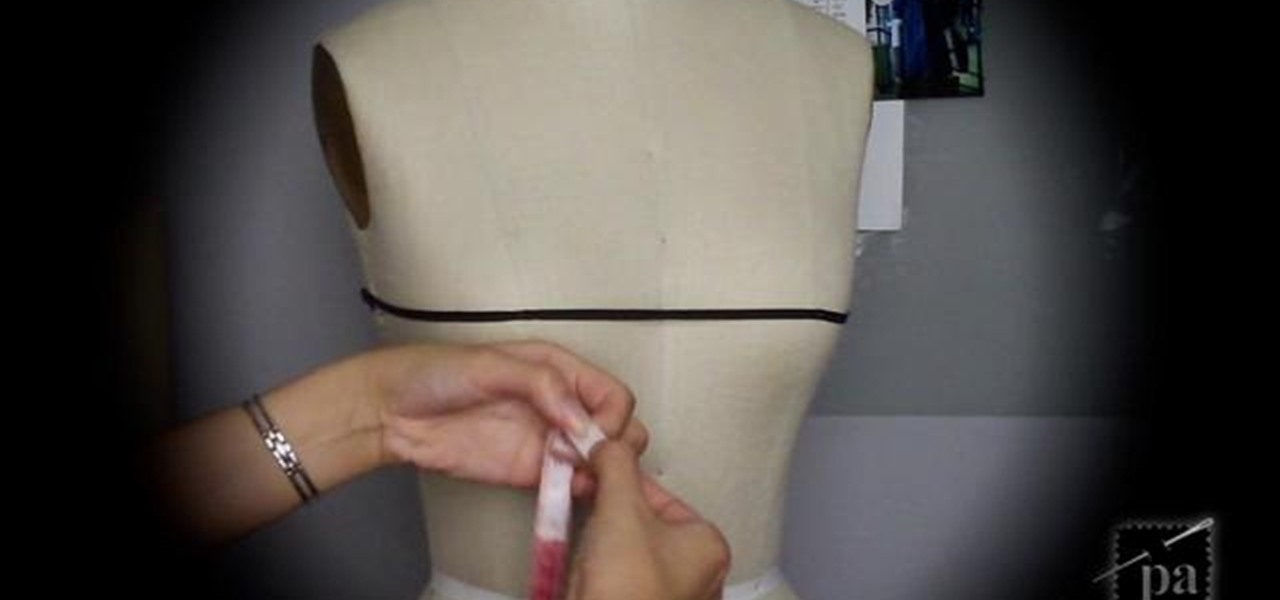
In this clip, learn how to drape the front and back bodice on a dress form for fashion design. In order to sew your designs properly, you will need to be versed in draping. This video will explain to you exactly how to do this relatively simple process and you will be on your way to becoming the next Tom Ford or Vera Wang.

In this video, Elizabeth shows you how to take left over fabric from a previous project and fashion it into a cute, up to date, high waisted skirt. This process is pretty easy and completely free! You can save money and fabric and get a great new look at the same time! So fun!

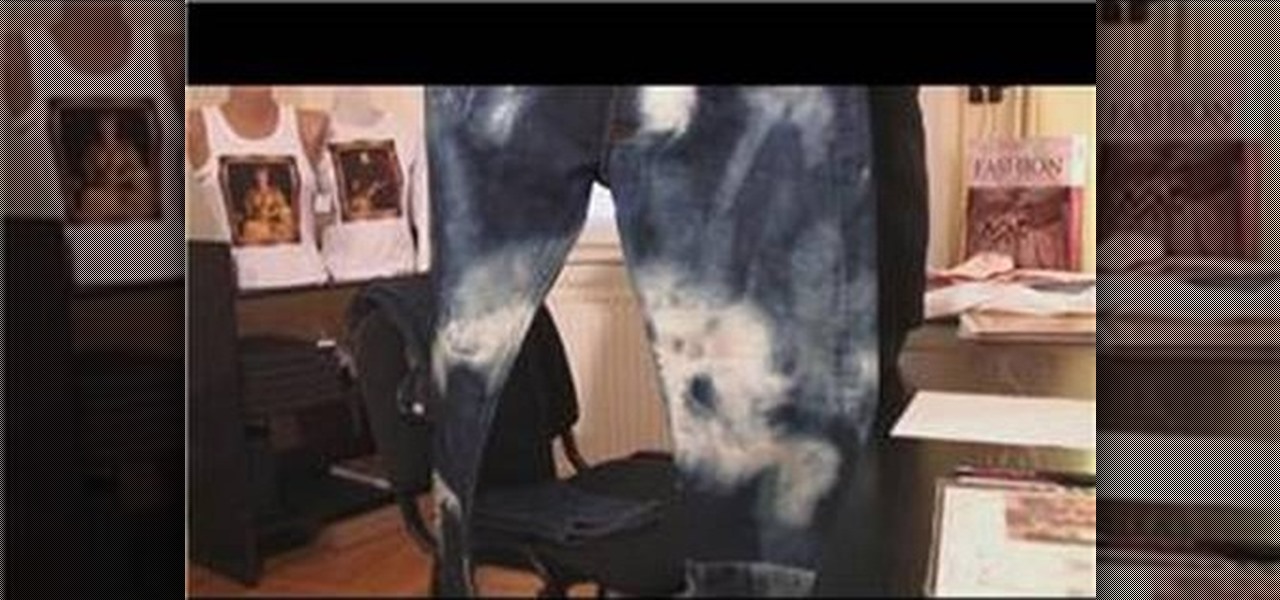
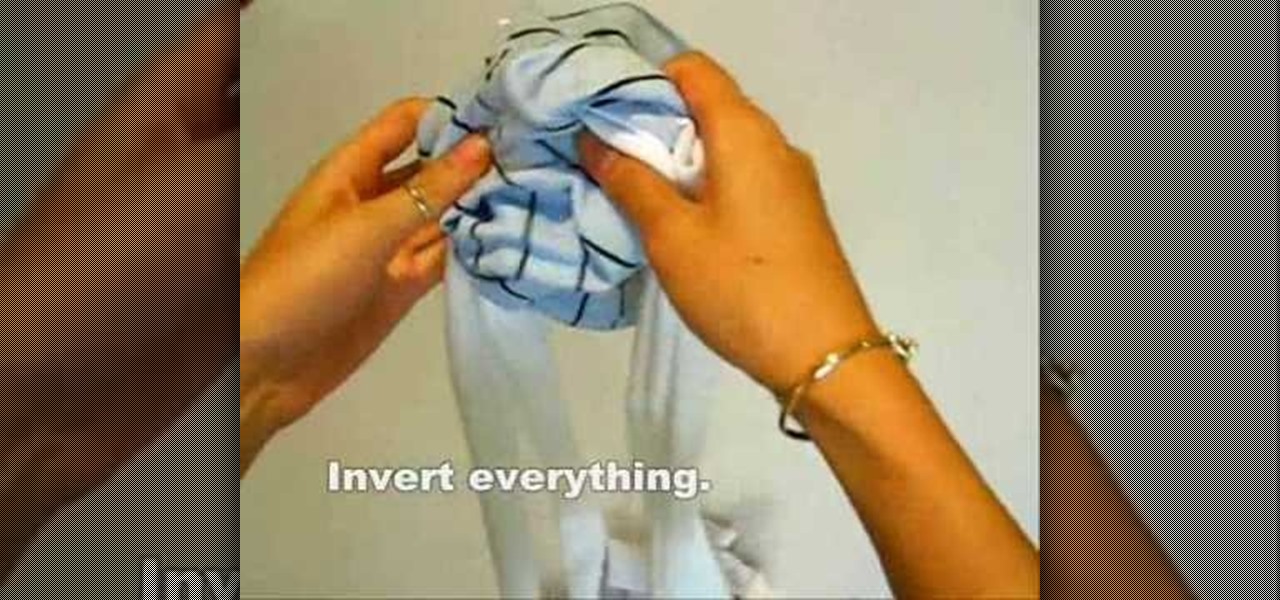
Watch this fashion design tutorial video to learn how to tie dye your clothes. This how-to video features very detailed instructions that make tie dyeing easy for even first timers. The tips in this how-to video will help you tie dye ilike a pro in no time. All you need is dye, soda ash, a bucket of water, a fork, rubber bands, gloves, saran wrap, and paper towels.

Step aside, vodka—whiskey will soon be the best-selling hard liquor in the United States. The whiskey renaissance has been largely attributed to the current trend for locally- and artisan-produced goods. Local whiskey distilleries are rapidly increasing in number across the nation while bars in every state are including the old-fashioned cocktail on their menus in an attempt to capitalize on the trend (which we can probably thank Mad Men for).

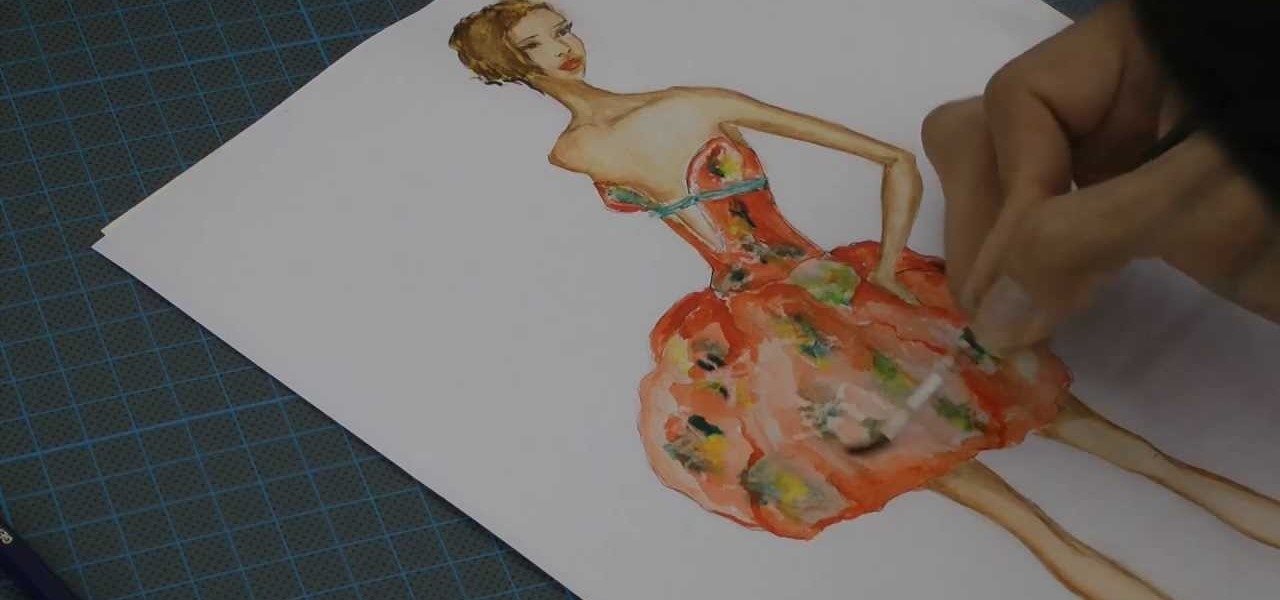
In this video im painting one of my fashion drawings

In this video i will show you how i paint one of my fashion sketches. More Fashion illustrations coming soon.

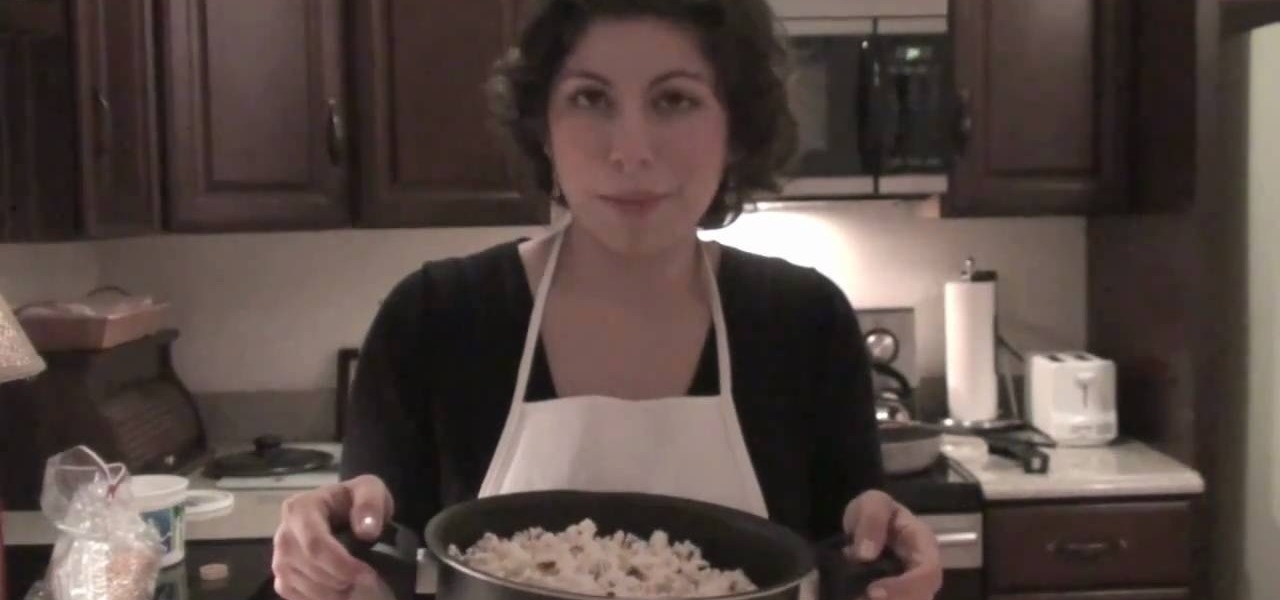
Make popcorn the way your grandparents made it! This is a healthier alternative to microwave popcorn, and also lets you decide what flavors you want to add. You can make a traditional popcorn the old fashioned way using your kitchen stove.

Sifting through your closet, you've found a bunch of clothes that are still wearable but hopelessly out of date. Instead of waiting for the fashions to cycle around again, here are a few tips on how you can update old clothes.

In this clip, you'll learn how to clean up the background of a fashion photograph when retouching it within Adobe Photoshop CS5. Whether you're new to Adobe's popular raster graphics editor or a seasoned designer looking to better acquaint yourself with the new features and functions of the latest iteration of the application, you're sure to benefit from this free software tutorial. For more information, watch this video guide.

ThreadBanger's Decor It Yourself shows how to made mid-century mod inspired wall art out of your leftover aluminum cans. Talk about a great way to recycle! Be good to the environment, while creating a three-dimensional metal sculpture to decorate your wall with a little soldering, cutting, and gluing. In the second half of this tutorial, learn how to make a mid-century geometric wall installation to dress up an empty wall.

Who doesn't want to look like a Victoria's Secret model? Inspired by the Victoria's Secret fashion show that's a holiday staple, MakeupGeek shows us how to create a look that's sexy and sultry. It's a fabulous makeup look that's easy to pull off and appropriate for any holiday party or event.

Die hard cyclist, or jewelry maker looking to experiment with materials? This how-to jewelry crafting video demonstrates a quick and quirky project. Our good friends at Littles Creatures are showing us how to make a Bike Chain Bracelet. Show Tuck and Snippit some love and tell us what you think!

In this home decorating video, Threadbanger shows us how to spice up the interior style of your bedroom. Meg shows us how-to make our bedrooms feel more romantic with a DIY bed canopy. Still looking for the perfect Valentine to send to someone special? Look no further! Meg shares some of her favorites. XOXO

This instructional video takes you step by step in making an old fashioned--a classic cocktail still enjoyed today. Steps:

In a recent episode of Gok Wan's Fashion Fix series, he used some beads to trim up the fringe on a sandal which gave us a great idea for a new take on fashion fringing: for a necklace! To make this project you will need cord and round glass beads. Simple! Learn how to craft this necklace by watching this video jewelry-making tutorial.

How to use two strobe lights for a simple fashion set.

This is the first step in tanning hides and making leather the old fashioned way. Sometimes called braintan, smoke tan, Indian tan or home tan. Watch this demonstrator scrap the hair and grain from the hide.

Kate Middleton may have to wait to get married before she's called "Princess" but she has already been named a fashion icon. You can follow in her fashionable footsteps- watch this video to learn how to get Kate's elegant look.

Inspired by French sex siren Brigitte Bardot, Jennifer Aniston plays up the sex bombshell angle in the new February issue of "Allure." Wearing little more than a PJ set completely unbuttoned up front, she exudes an effortless glamour.

Leopard print is one of the newest trends, and you can easily create your own leopard print style garment at home. All you need is a basic white T-shirt (or whatever you want to dye), the dye itself and a few other accessories.

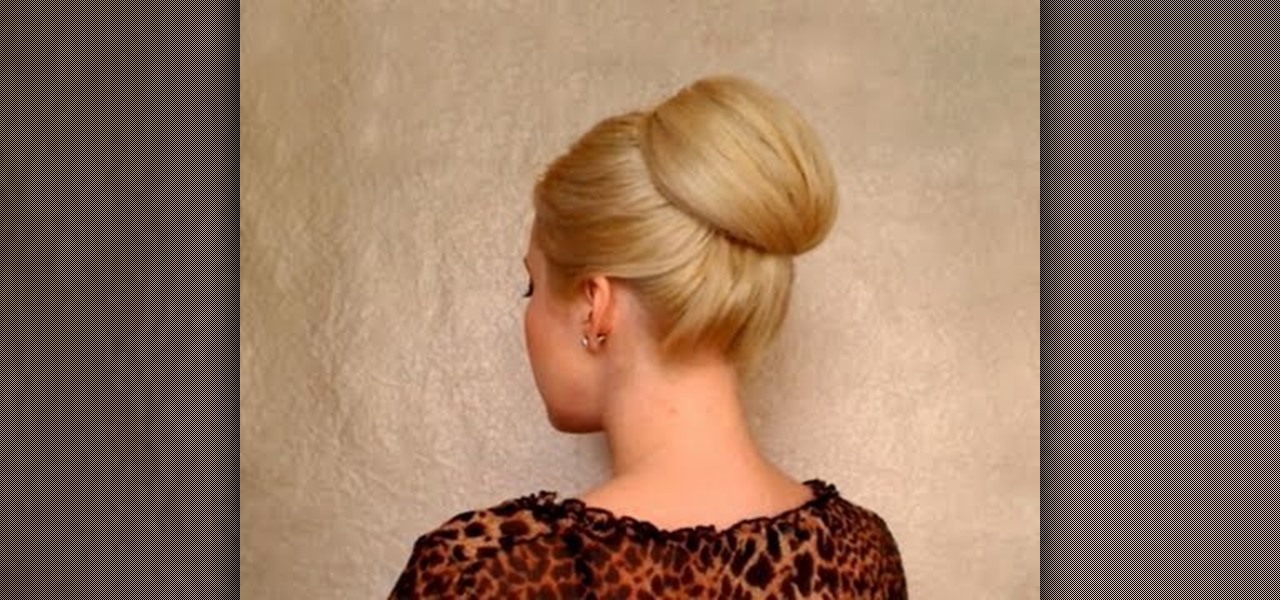
This hairstyle is taken directly from the current trends for runway models. Backcomb your hair first to give it a little body, then follow the steps to clamp your hair and hold it in place to achieve the disheveled ballerina look.

Back in the '40s through the '60s, it took very little effort for gorgeous starlet Audrey Hepburn to start new trends. Whether she was sporting a short pixie cute (as in "Roman Holiday") or wearing buggy sunglasses (vide "Breakfast at Tiffany's"), Hepburn was always on the cutting edge.

Fringes are definitely trendy this season, and you can jump on the trend bus without breaking the bank! You can turn an old T-shirt into a fashionable fringed scarf just by making a few cuts. Pick a shirt as colorful as you want!

Lace tights are all the rage right now... Why not get some lessons on how to rock these tights down the street or to your next party with help from this Fashion Elites tutorial. Drop those boring black tights and try something different for a change with lace printed tights!

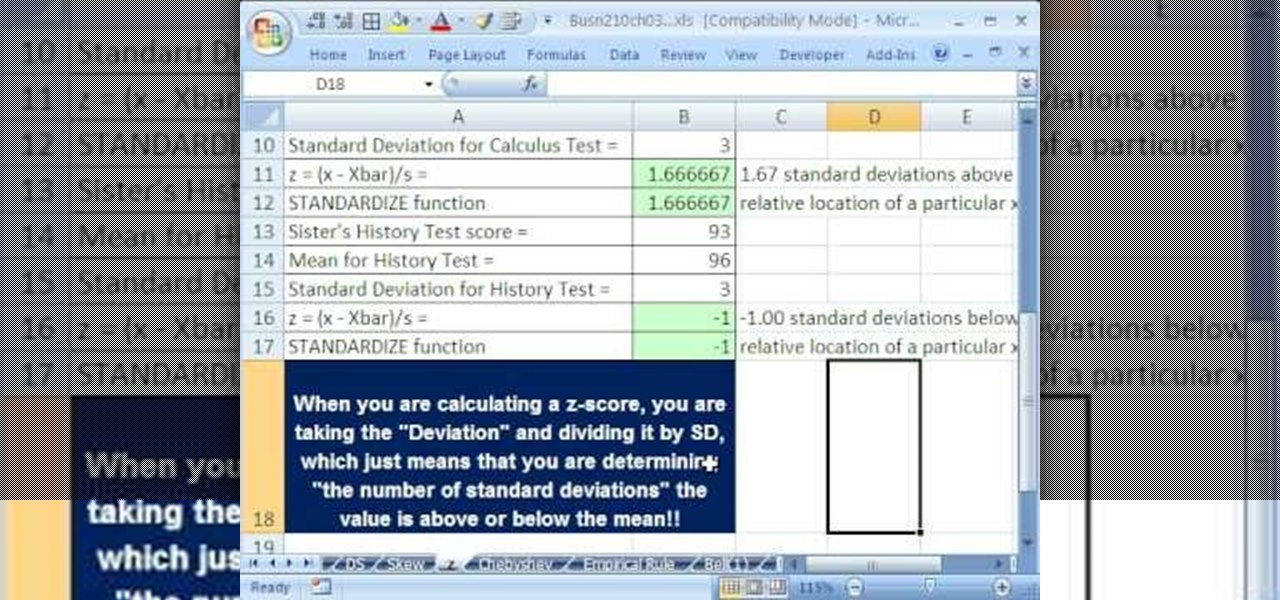
If you use Microsoft Excel on a regular basis, odds are you work with numbers. Put those numbers to work. Statistical analysis allows you to find patterns, trends and probabilities within your data. In this MS Excel tutorial from everyone's favorite Excel guru, YouTube's ExcelsFun, the 45th installment in his "Excel Statistics" series of free video lessons, you'll learn how to see how to calculate a z-score.

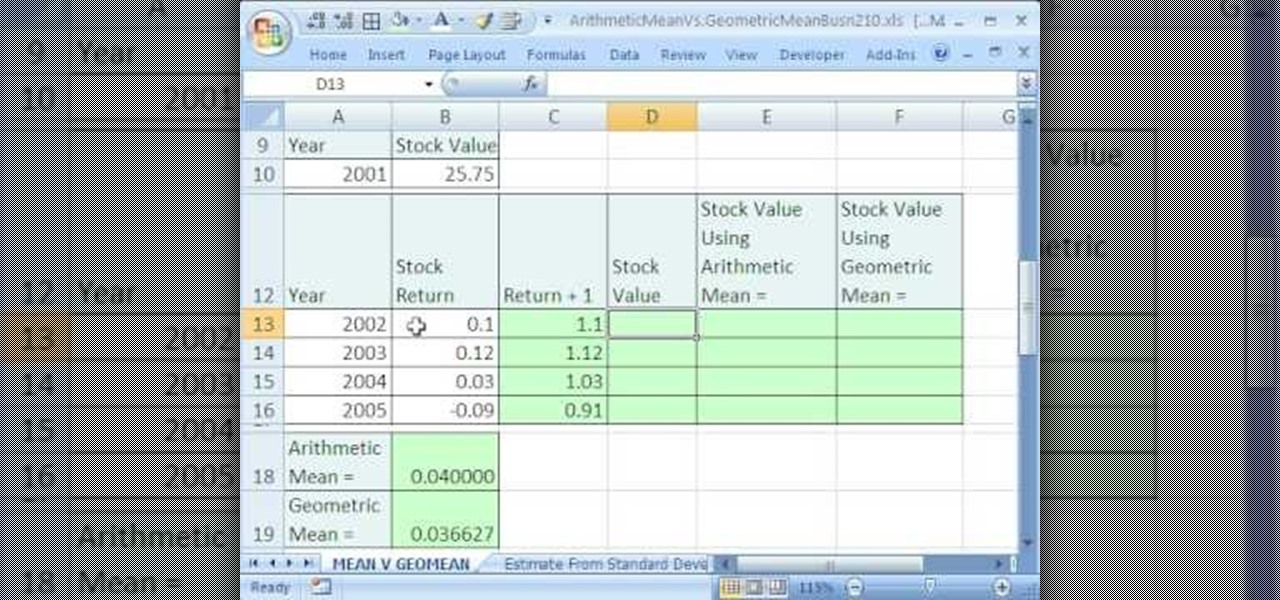
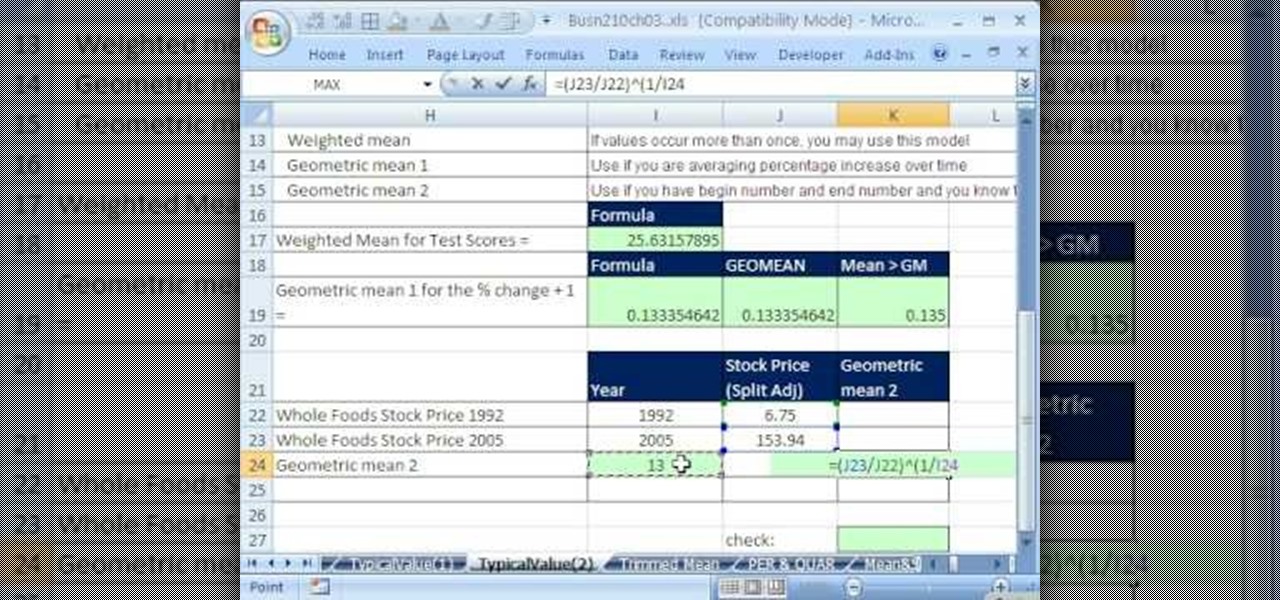
If you use Microsoft Excel on a regular basis, odds are you work with numbers. Put those numbers to work. Statistical analysis allows you to find patterns, trends and probabilities within your data. In this MS Excel tutorial from everyone's favorite Excel guru, YouTube's ExcelsFun, the 35.2nd installment in his "Excel Statistics" series of free video lessons, you'll learn how to use Excel's GEOMEAN function to find geometric mean.

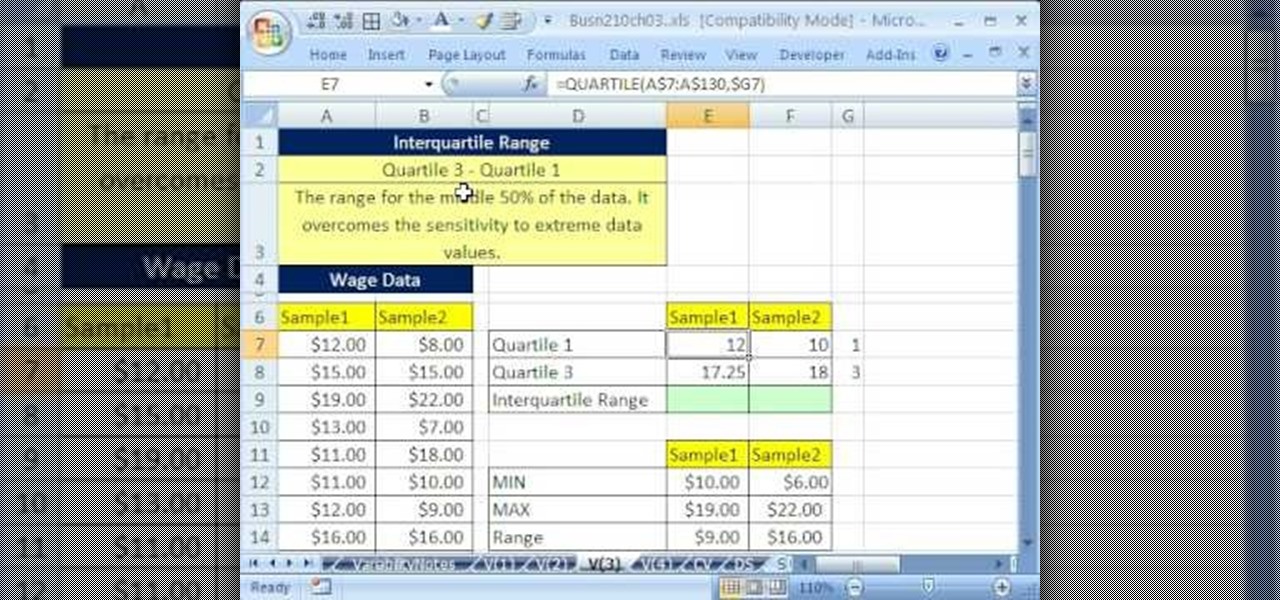
If you use Microsoft Excel on a regular basis, odds are you work with numbers. Put those numbers to work. Statistical analysis allows you to find patterns, trends and probabilities within your data. In this MS Excel tutorial from everyone's favorite Excel guru, YouTube's ExcelsFun, the 40th installment in his "Excel Statistics" series of free video lessons, you'll learn how to calculate range & interquartile range for variability using the MAX, MIN, QUARTILE functions.

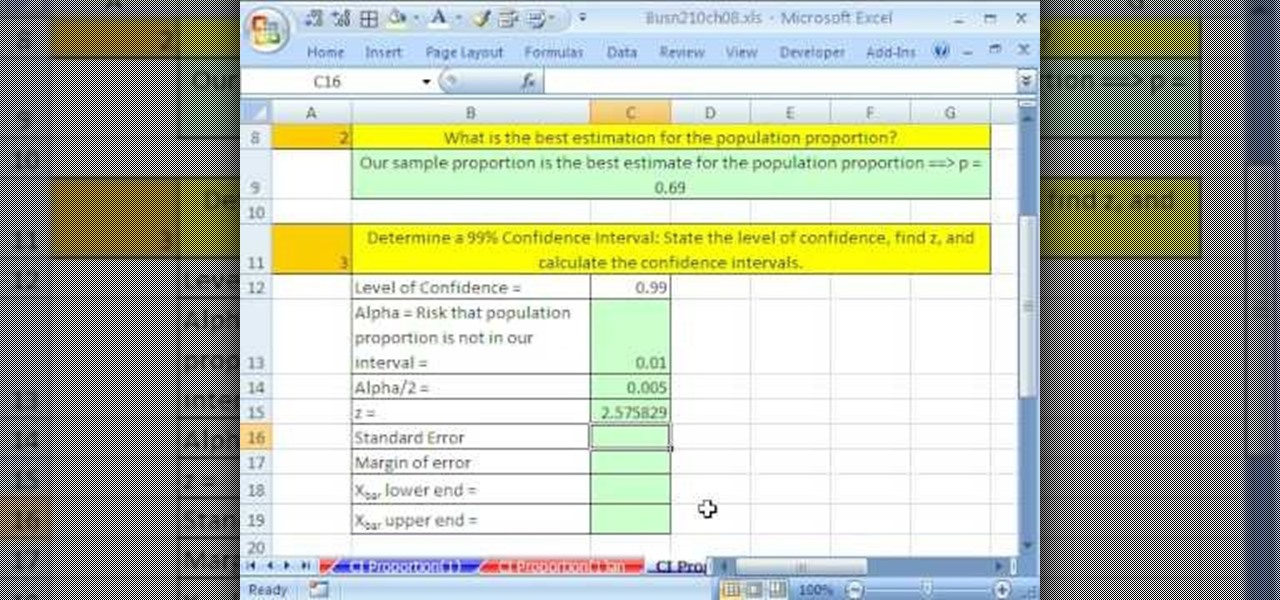
If you use Microsoft Excel on a regular basis, odds are you work with numbers. Put those numbers to work. Statistical analysis allows you to find patterns, trends and probabilities within your data. In this MS Excel tutorial from everyone's favorite Excel guru, YouTube's ExcelsFun, the 86th installment in his "Excel Statistics" series of free video lessons, you'll learn how to construct confidence intervals for proportions using NORMSINV function and other formulas.

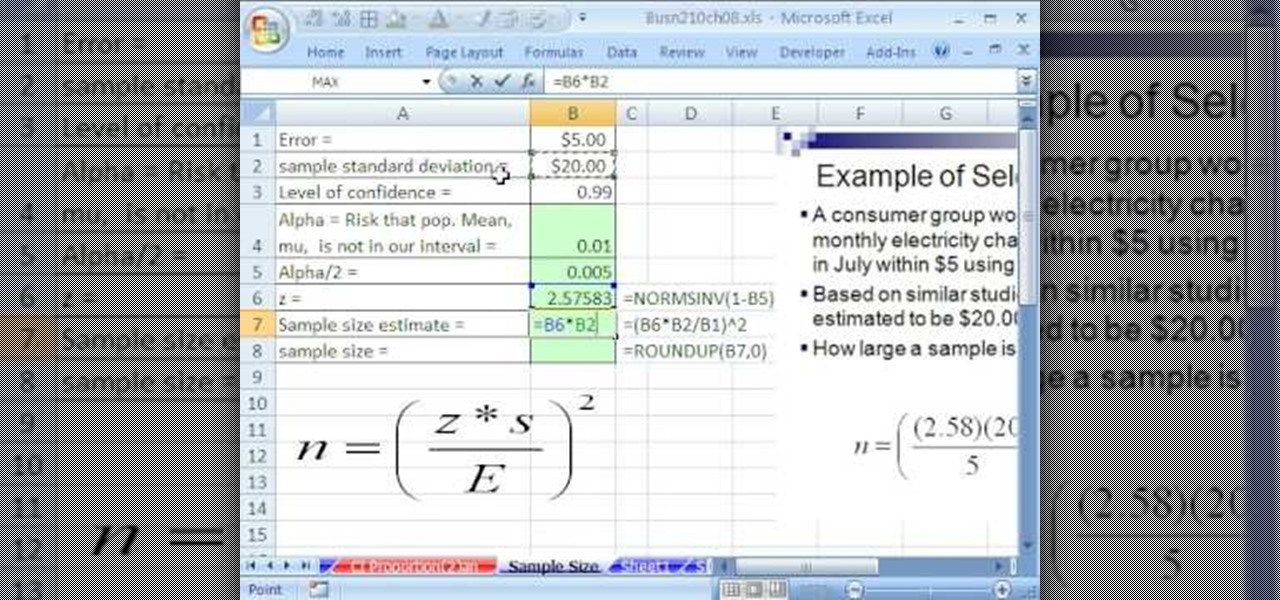
If you use Microsoft Excel on a regular basis, odds are you work with numbers. Put those numbers to work. Statistical analysis allows you to find patterns, trends and probabilities within your data. In this MS Excel tutorial from everyone's favorite Excel guru, YouTube's ExcelsFun, the 87th installment in his "Excel Statistics" series of free video lessons, you'll learn how to calculate sample size (n) for confidence intervals.

If you use Microsoft Excel on a regular basis, odds are you work with numbers. Put those numbers to work. Statistical analysis allows you to find patterns, trends and probabilities within your data. In this MS Excel tutorial from everyone's favorite Excel guru, YouTube's ExcelsFun, the 27th installment in his "Excel Statistics" series of free video lessons, you'll learn how to create a quantitative data dot plot chart using the REPT and COUNTIF functions.

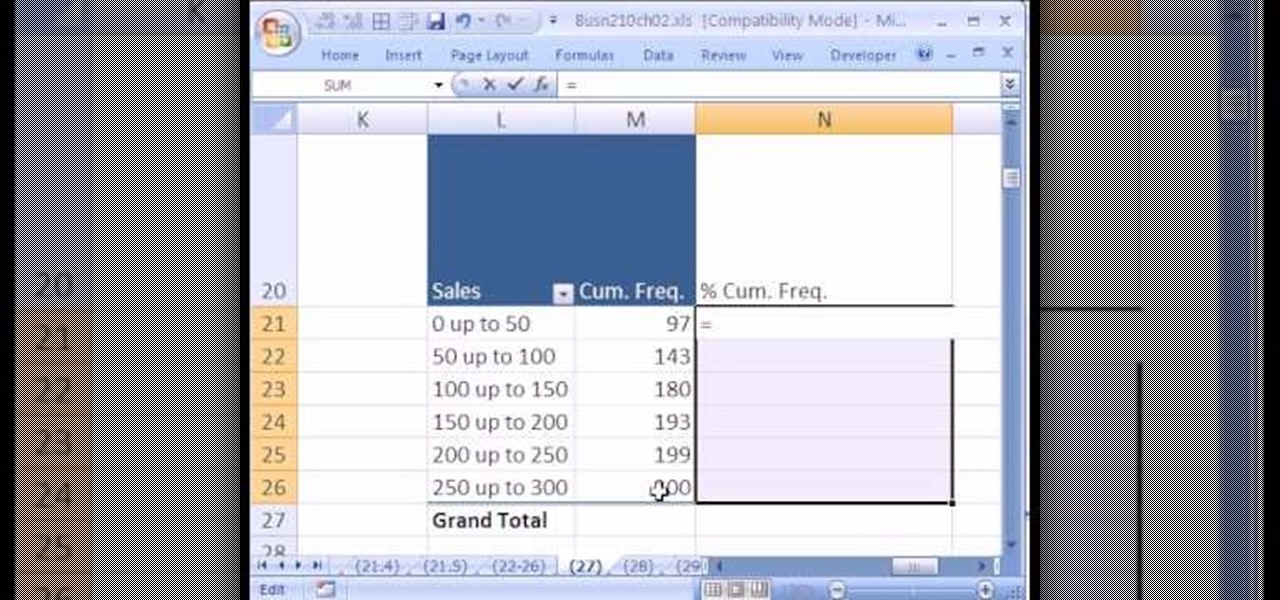
If you use Microsoft Excel on a regular basis, odds are you work with numbers. Put those numbers to work. Statistical analysis allows you to find patterns, trends and probabilities within your data. In this MS Excel tutorial from everyone's favorite Excel guru, YouTube's ExcelsFun, the 26th installment in his "Excel Statistics" series of free video lessons, you'll learn how to create quantitative data cumulative frequency distributions with pivot tables.

If you use Microsoft Excel on a regular basis, odds are you work with numbers. Put those numbers to work. Statistical analysis allows you to find patterns, trends and probabilities within your data. In this MS Excel tutorial from everyone's favorite Excel guru, YouTube's ExcelsFun, the 16th installment in his "Excel Statistics" series of free video lessons, you'll learn how to cross tabulate & do percentage cross tabulation for categorical data using a pivot table (PivotTable).

If you use Microsoft Excel on a regular basis, odds are you work with numbers. Put those numbers to work. Statistical analysis allows you to find patterns, trends and probabilities within your data. In this MS Excel tutorial from everyone's favorite Excel guru, YouTube's ExcelsFun, the 19th installment in his "Excel Statistics" series of free video lessons, you'll learn how to group categories in a frequency distribution with a formula (2 COUNTIF) and the pivot table (PivotTable) grouping fea...

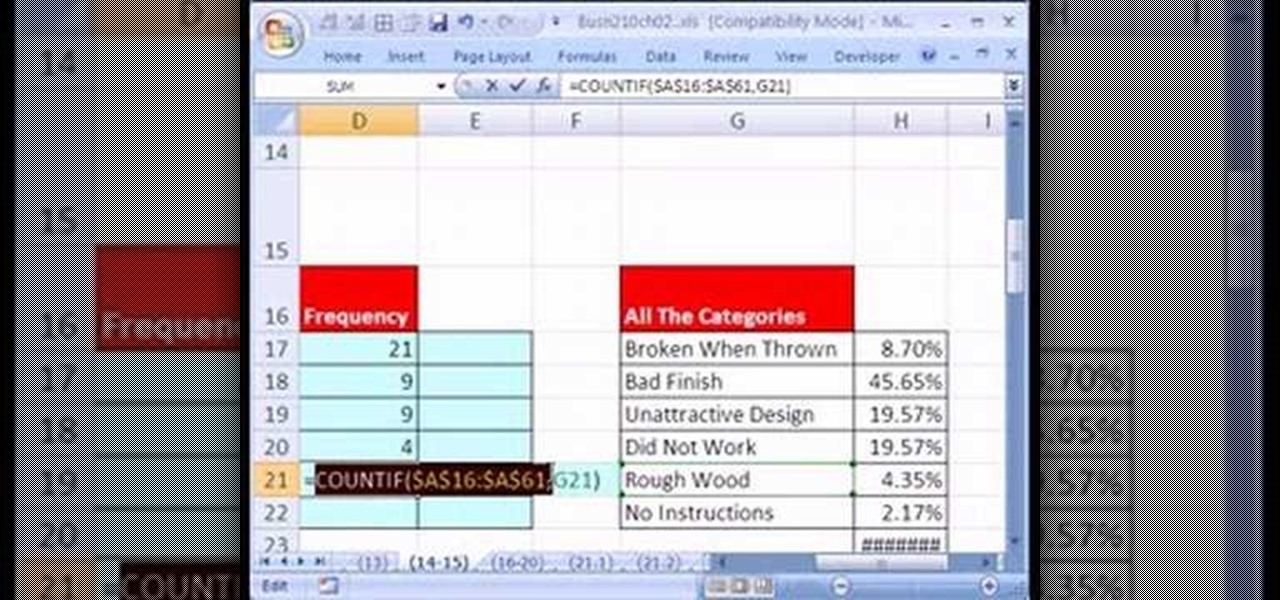
If you use Microsoft Excel on a regular basis, odds are you work with numbers. Put those numbers to work. Statistical analysis allows you to find patterns, trends and probabilities within your data. In this MS Excel tutorial from everyone's favorite Excel guru, YouTube's ExcelsFun, the 17th installment in his "Excel Statistics" series of free video lessons, you'll learn how to cross tabulate & do percentage cross tabulation for categorical data using formulas rather than pivot tables.

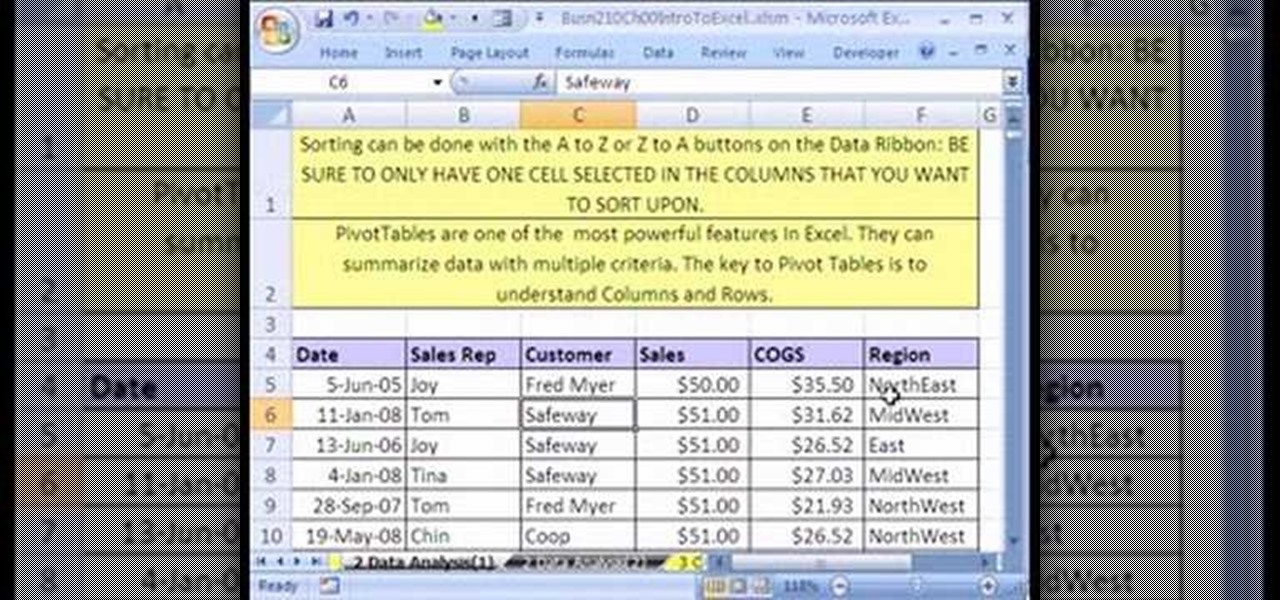
If you use Microsoft Excel on a regular basis, odds are you work with numbers. Put those numbers to work. Statistical analysis allows you to find patterns, trends and probabilities within your data. In this MS Excel tutorial from everyone's favorite Excel guru, YouTube's ExcelsFun, the 3rd installment in his "Excel Statistics" series of free video lessons, you'll learn how to use Excel's sorting and pivot tables (PivotTables) data analysis tools.

If you use Microsoft Excel on a regular basis, odds are you work with numbers. Put those numbers to work. Statistical analysis allows you to find patterns, trends and probabilities within your data. In this MS Excel tutorial from everyone's favorite Excel guru, YouTube's ExcelsFun, the 35th installment in his "Excel Statistics" series of free video lessons, you'll learn how to calculate weighted and geometric means and see how to use the GEOMEAN function.

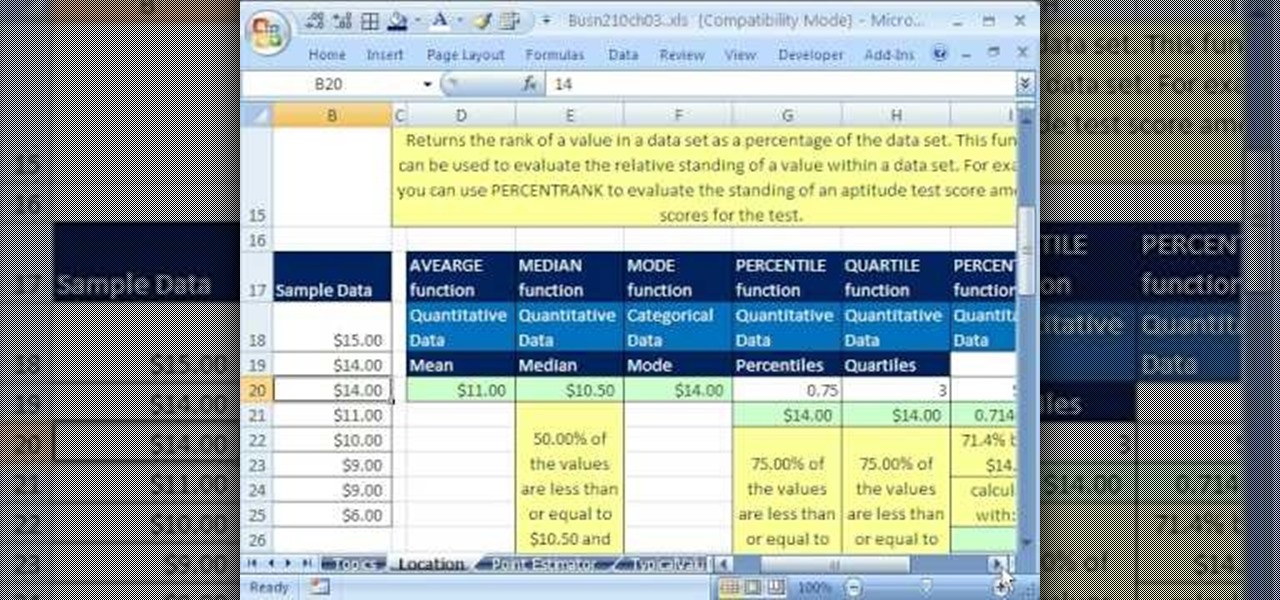
If you use Microsoft Excel on a regular basis, odds are you work with numbers. Put those numbers to work. Statistical analysis allows you to find patterns, trends and probabilities within your data. In this MS Excel tutorial from everyone's favorite Excel guru, YouTube's ExcelsFun, the 33rd installment in his "Excel Statistics" series of free video lessons, you'll learn how to use the AVEARGE, MEDIAN, MODE, PERCENTILE, QUARTILE and PERCENTILERANK functions to measure location.


