Ken shows viewers how to make popcorn the old fashioned way! First, you should put some oil in a pot on the stove on about high. Get a bag of popcorn kernels and pour them into the oil in the pan. Shake this mixture up together, making sure all off them mix well. Now, you should cover the pot with a cover and wait for the popcorn to begin to pop off the top of the pan. You will need to have a bowl handy to put the popcorn in. Ken wants to prove that you can wait just as long for good popcorn ...

Fashion in the 1970s was very eclectic but still influenced by the latter part of the 1960s. Learn about different 1970s retro fashion trends from a retro fashion specialist in this free fashion video series.

The 1960s were an important decade for men's and women's fashion. Learn about different 1960s retro fashion trends from a retro fashion specialist in this free fashion video series.
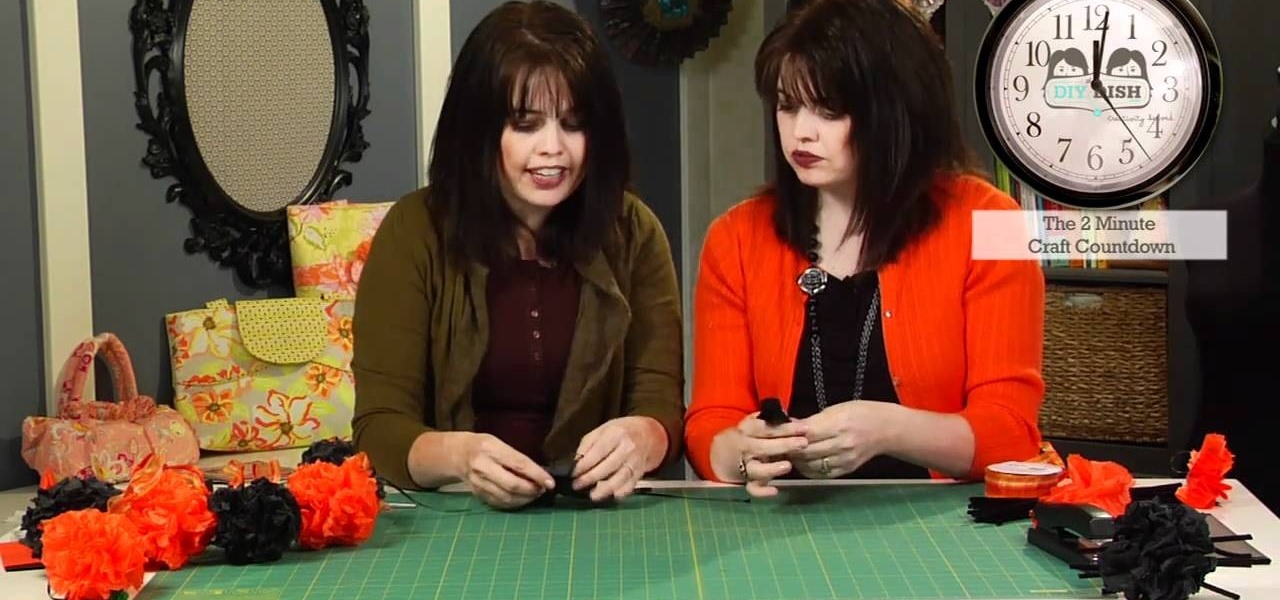
There's always a lot going on in the craft world, with ingenious new products being made every day. But there are also trends in decorating that rise up and end up on every crafter's blog. Right now, that ternd is garlands.
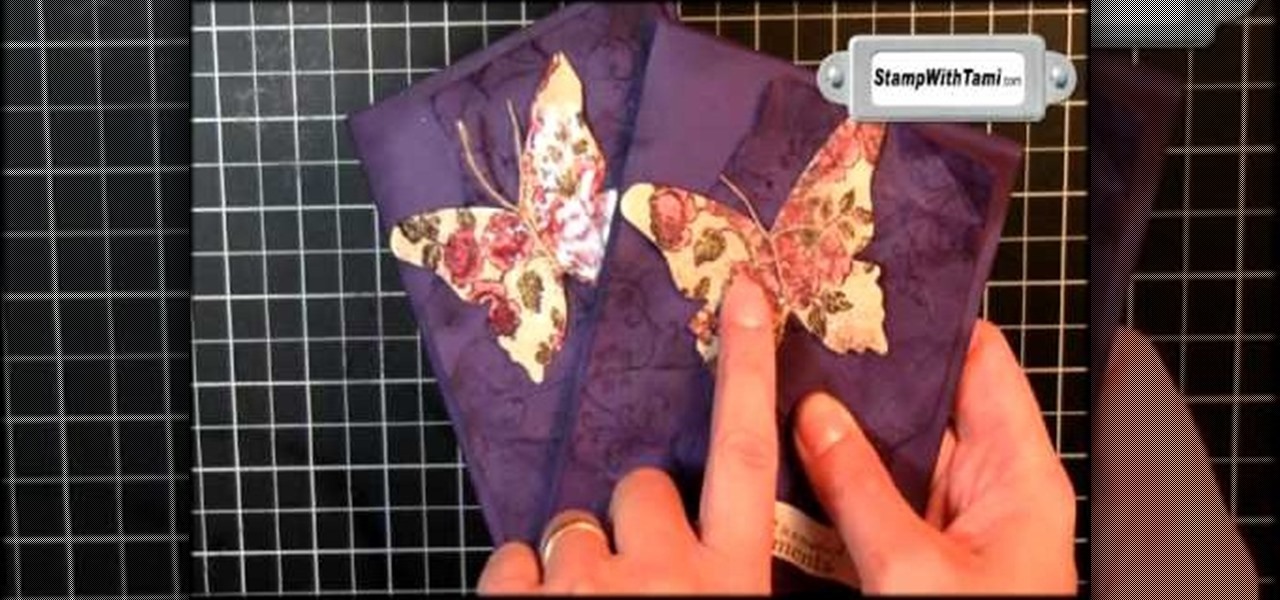
Crackled glass has made its appearance in lots of cultural avenues, including nail polish (remember the crackled nail polish trend popular a few years back?), glass designs, and now, cards.

In this clip, you'll learn how to incorporate hashtags or hash tags into your tweets on Twitter. What do President Obama, the Dalai Lama and Justin Bieber have in common? Why, they're all on Twitter, of course. Join the party. Whether you're new to Twitter's popular microblogging application or just missed a few of the essentials along the way, you're sure to benefit from this free video tutorial.

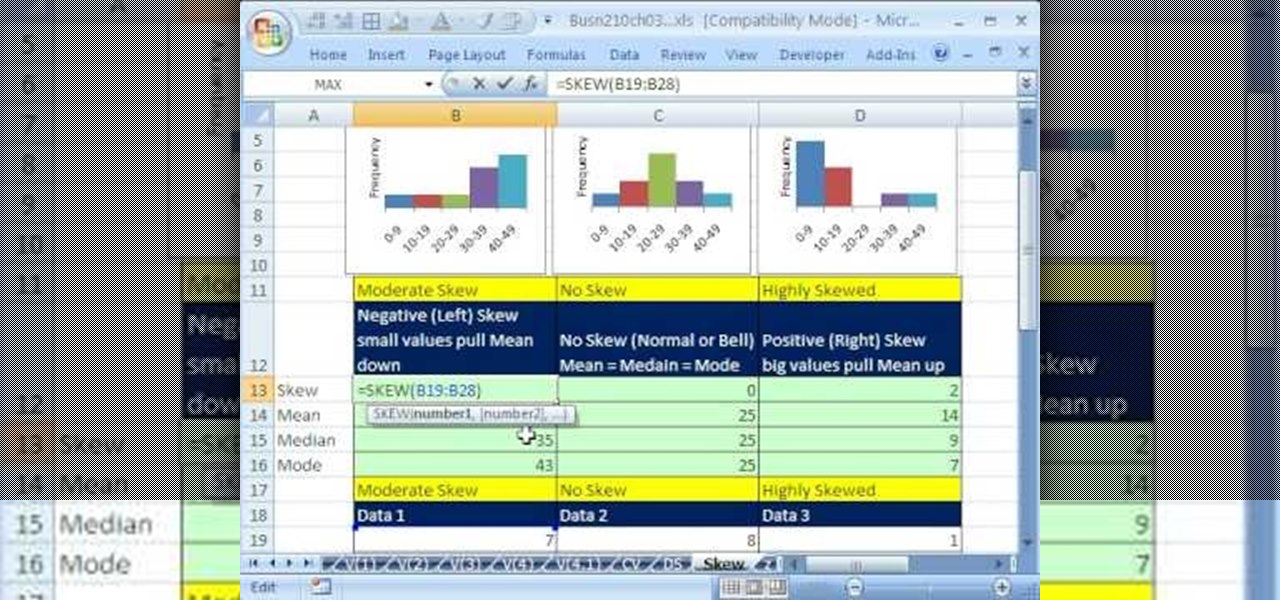
If you use Microsoft Excel on a regular basis, odds are you work with numbers. Put those numbers to work. Statistical analysis allows you to find patterns, trends and probabilities within your data. In this MS Excel tutorial from everyone's favorite Excel guru, YouTube's ExcelsFun, the 44th installment in his "Excel Statistics" series of free video lessons, you'll learn how to use the SKEW function to calculate the skew in a distribution of data.

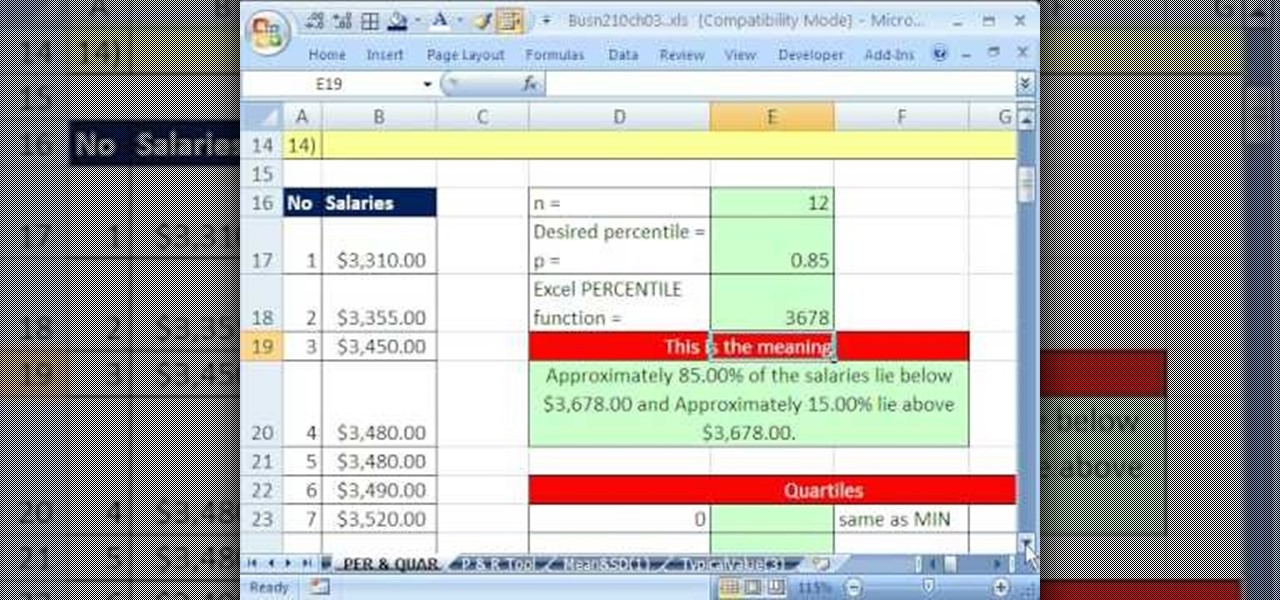
f you use Microsoft Excel on a regular basis, odds are you work with numbers. Put those numbers to work. Statistical analysis allows you to find patterns, trends and probabilities within your data. In this MS Excel tutorial from everyone's favorite Excel guru, YouTube's ExcelsFun, the 37th installment in his "Excel Statistics" series of free video lessons, you'll learn how to use the PERCENTILE and QUARTILE functions.

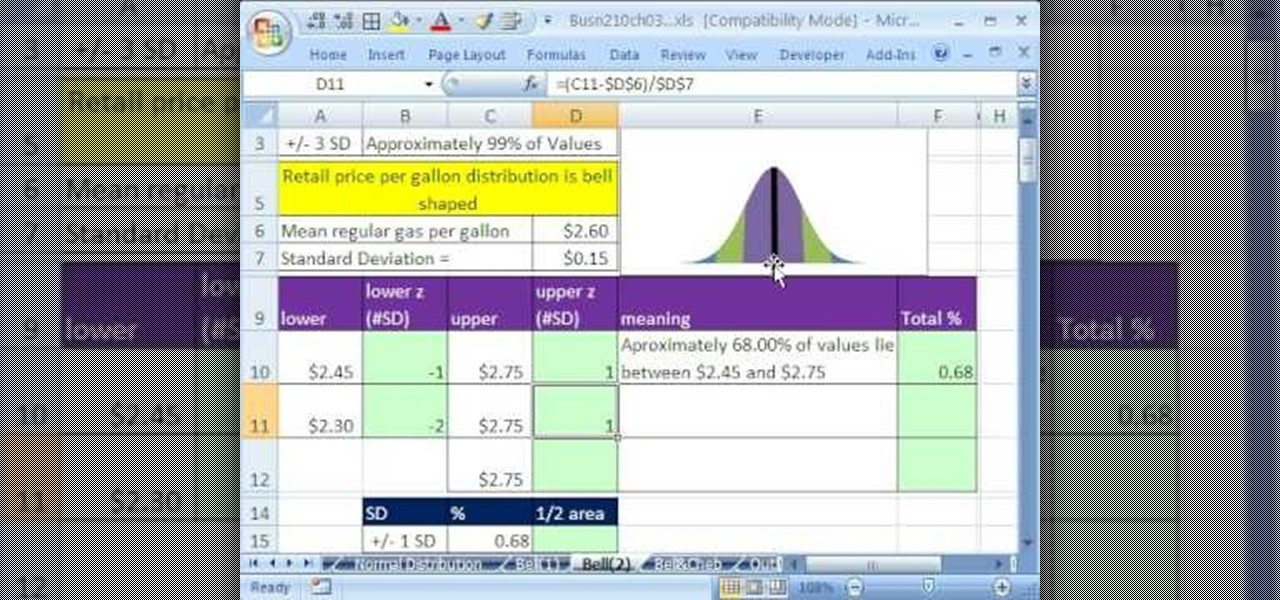
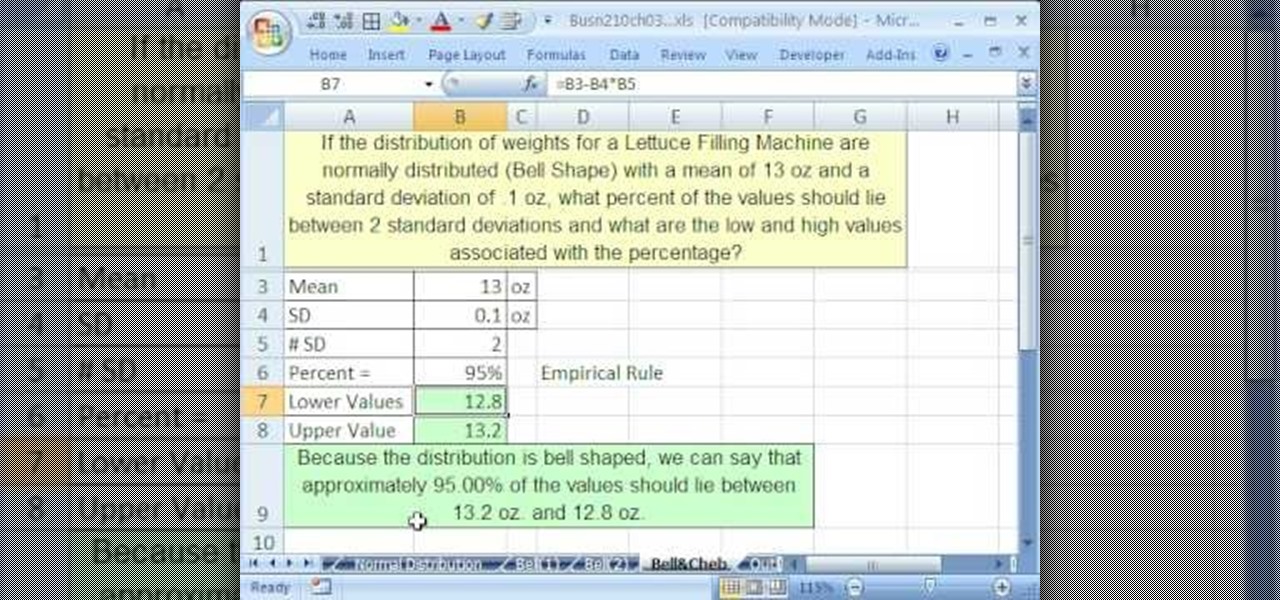
If you use Microsoft Excel on a regular basis, odds are you work with numbers. Put those numbers to work. Statistical analysis allows you to find patterns, trends and probabilities within your data. In this MS Excel tutorial from everyone's favorite Excel guru, YouTube's ExcelsFun, the 47th installment in his "Excel Statistics" series of free video lessons, you'll learn about the basics of the empirical rule (the bell curve) and how to apply it in various ways.

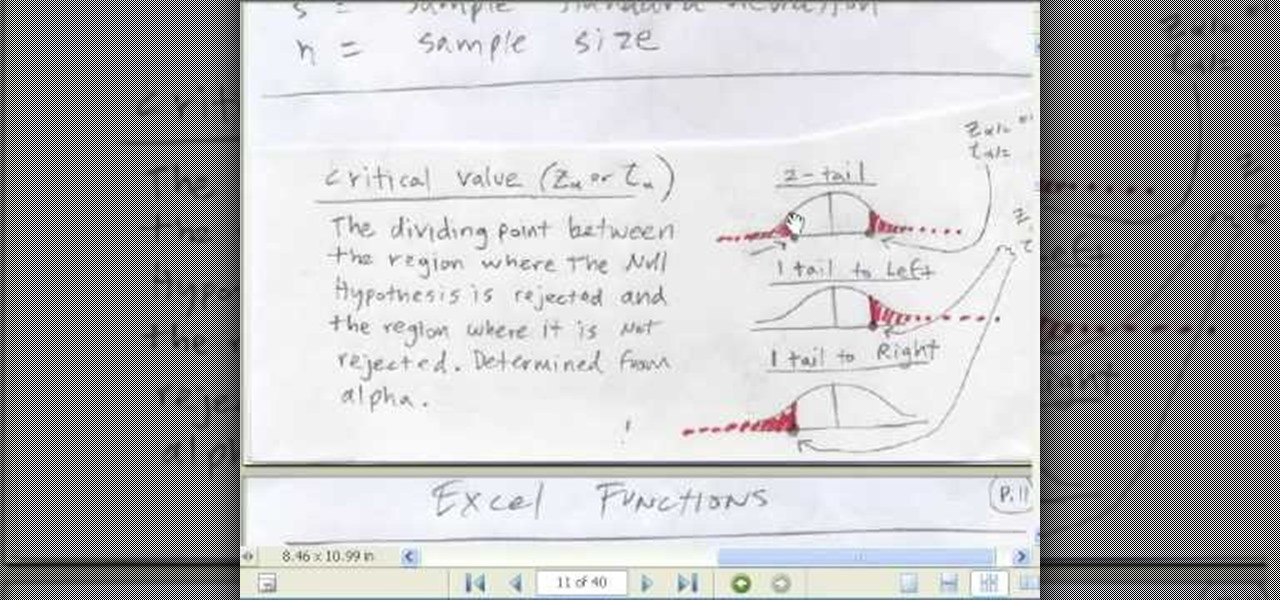
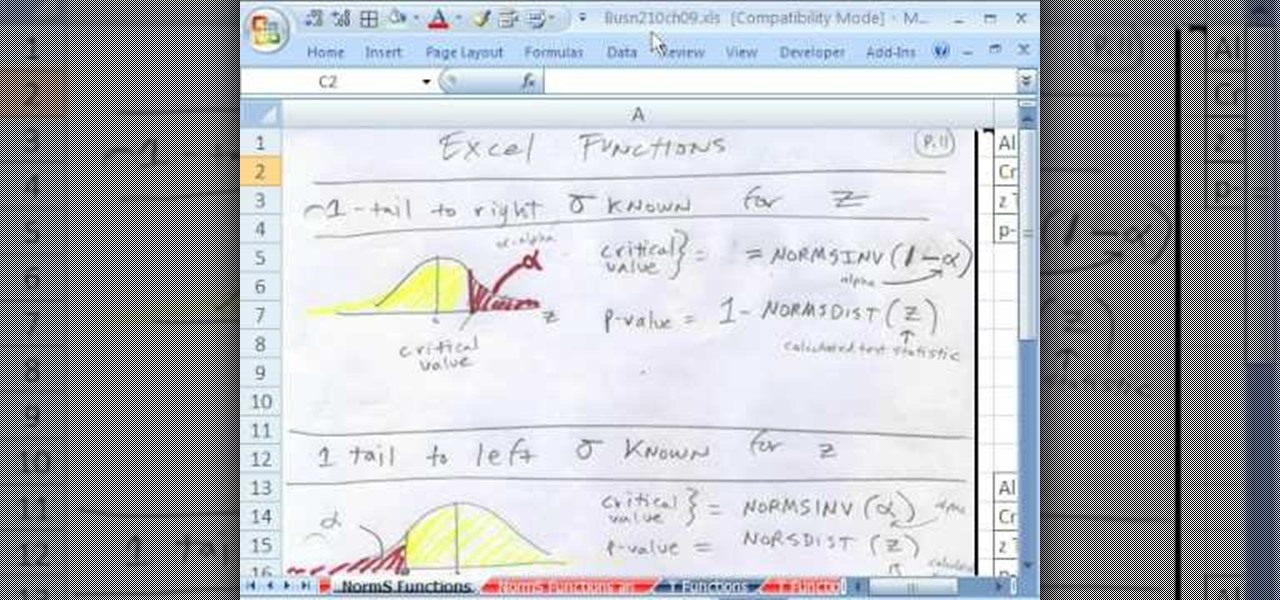
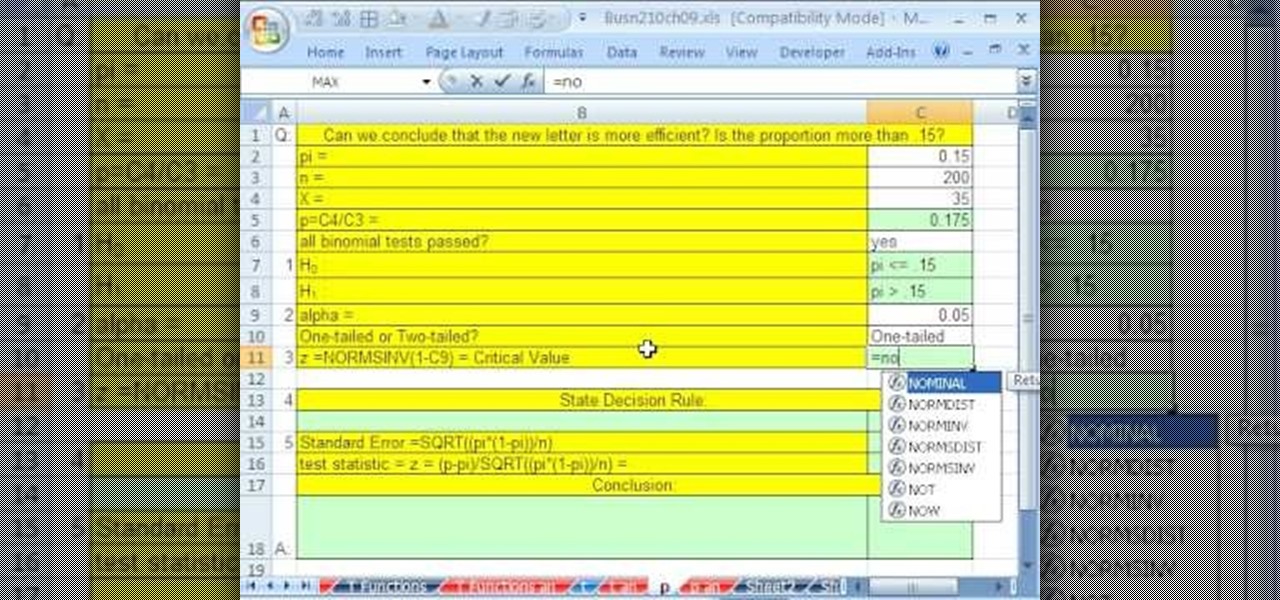
If you use Microsoft Excel on a regular basis, odds are you work with numbers. Put those numbers to work. Statistical analysis allows you to find patterns, trends and probabilities within your data. In this MS Excel tutorial from everyone's favorite Excel guru, YouTube's ExcelsFun, the 89th installment in his "Excel Statistics" series of free video lessons, you'll learn how to use the NORMSINV function for critical values and the NORSDIST function for p-values.

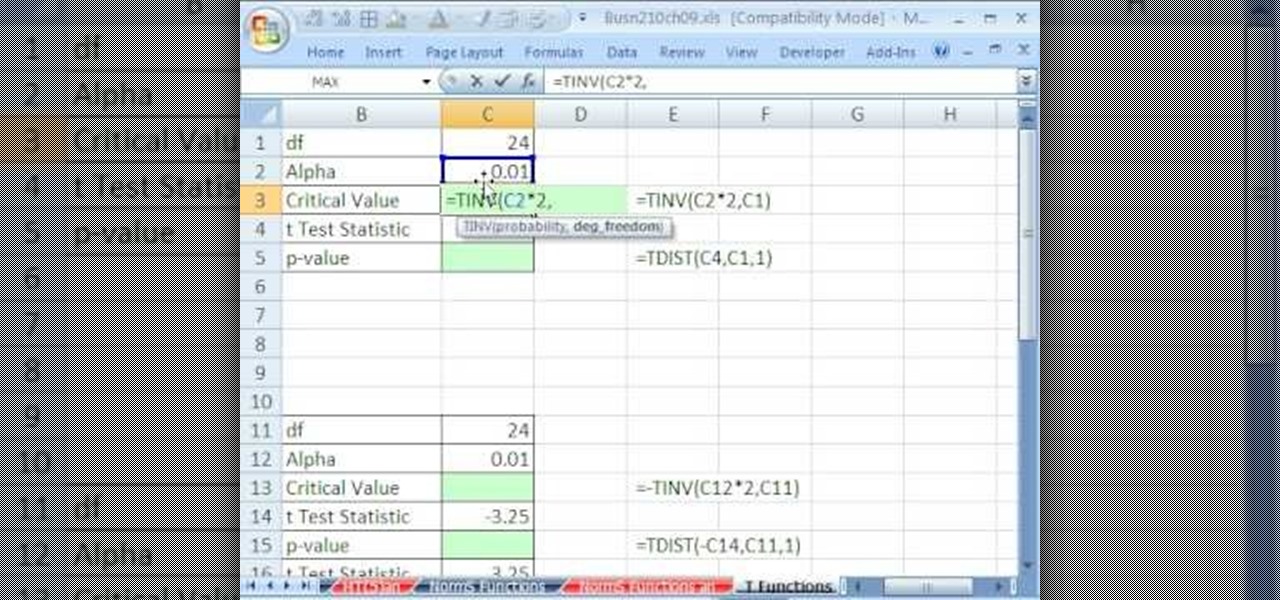
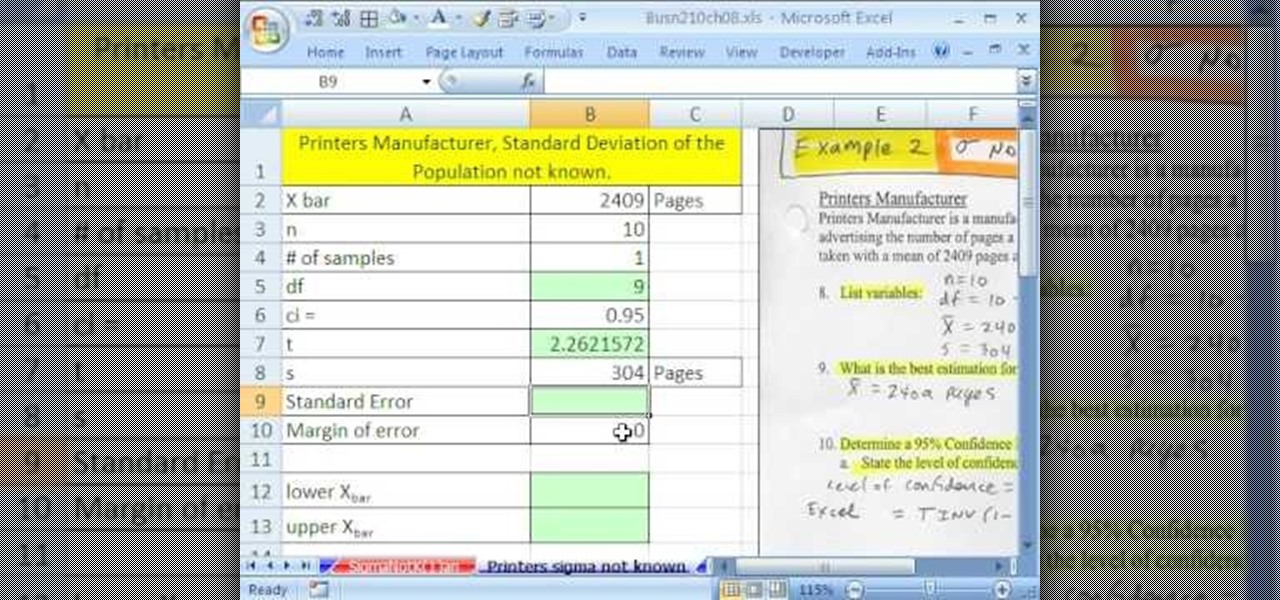
If you use Microsoft Excel on a regular basis, odds are you work with numbers. Put those numbers to work. Statistical analysis allows you to find patterns, trends and probabilities within your data. In this MS Excel tutorial from everyone's favorite Excel guru, YouTube's ExcelsFun, the 91st installment in his "Excel Statistics" series of free video lessons, you'll learn how to use TINV and TDIST functions to find critical values given an unknown sigma value.

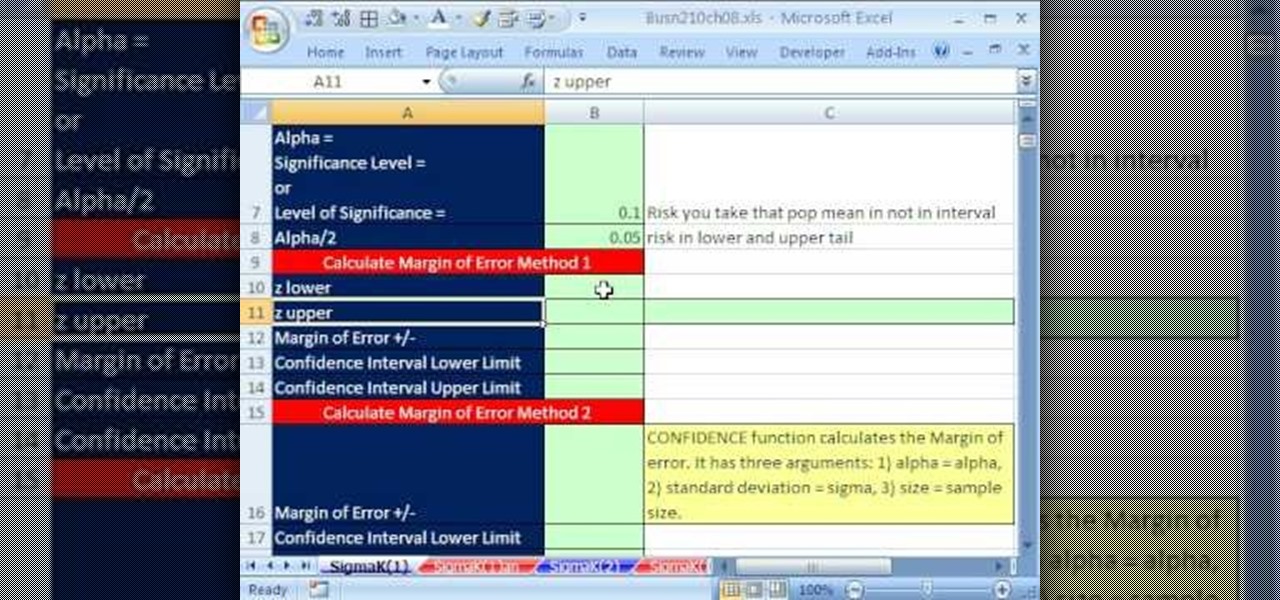
If you use Microsoft Excel on a regular basis, odds are you work with numbers. Put those numbers to work. Statistical analysis allows you to find patterns, trends and probabilities within your data. In this MS Excel tutorial from everyone's favorite Excel guru, YouTube's ExcelsFun, the 80th installment in his "Excel Statistics" series of free video lessons, you'll learn how to construct confidence intervals when the sigma is known known using the CONFIDENCE and NORMSINV functions.

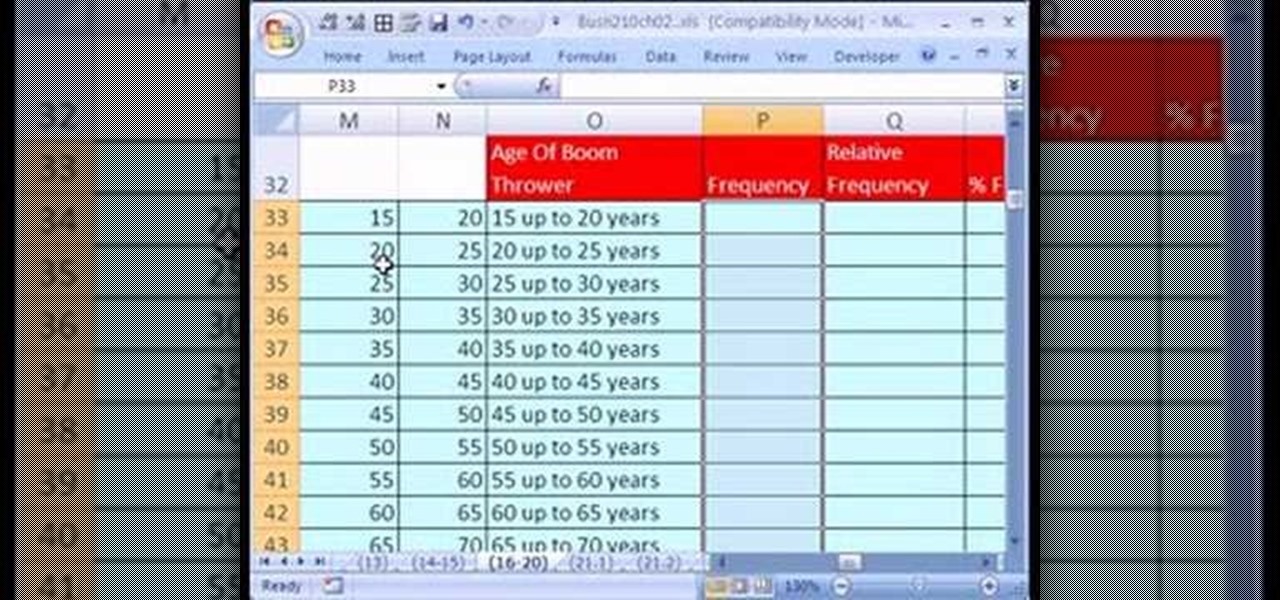
If you use Microsoft Excel on a regular basis, odds are you work with numbers. Put those numbers to work. Statistical analysis allows you to find patterns, trends and probabilities within your data. In this MS Excel tutorial from everyone's favorite Excel guru, YouTube's ExcelsFun, the 21st installment in his "Excel Statistics" series of free video lessons, you'll learn how to build labels and counting formulas for a frequency distribution.

If you use Microsoft Excel on a regular basis, odds are you work with numbers. Put those numbers to work. Statistical analysis allows you to find patterns, trends and probabilities within your data. In this MS Excel tutorial from everyone's favorite Excel guru, YouTube's ExcelsFun, the 87th installment in his "Excel Statistics" series of free video lessons, you'll learn how to use NORMSINV to test a hypothesis with population standard deviation (sigma) known and proportions.

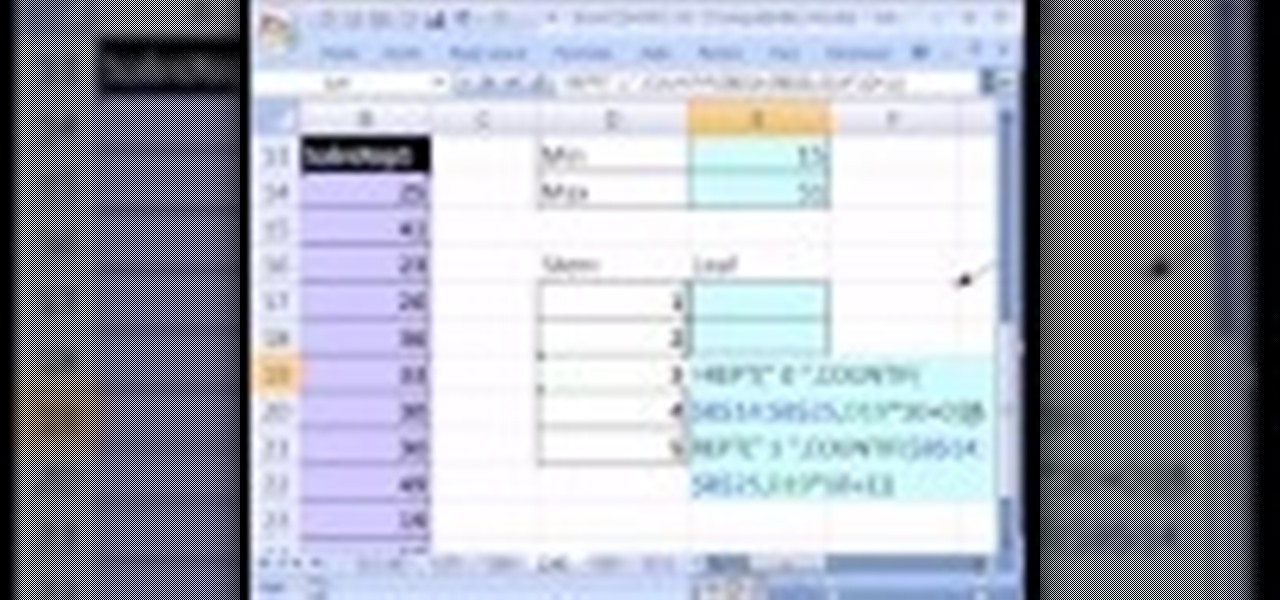
If you use Microsoft Excel on a regular basis, odds are you work with numbers. Put those numbers to work. Statistical analysis allows you to find patterns, trends and probabilities within your data. In this MS Excel tutorial from everyone's favorite Excel guru, YouTube's ExcelsFun, the 28th installment in his "Excel Statistics" series of free video lessons, you'll learn how to create quantitative data stem & leaf charts using the REPT and COUNTIF functions.

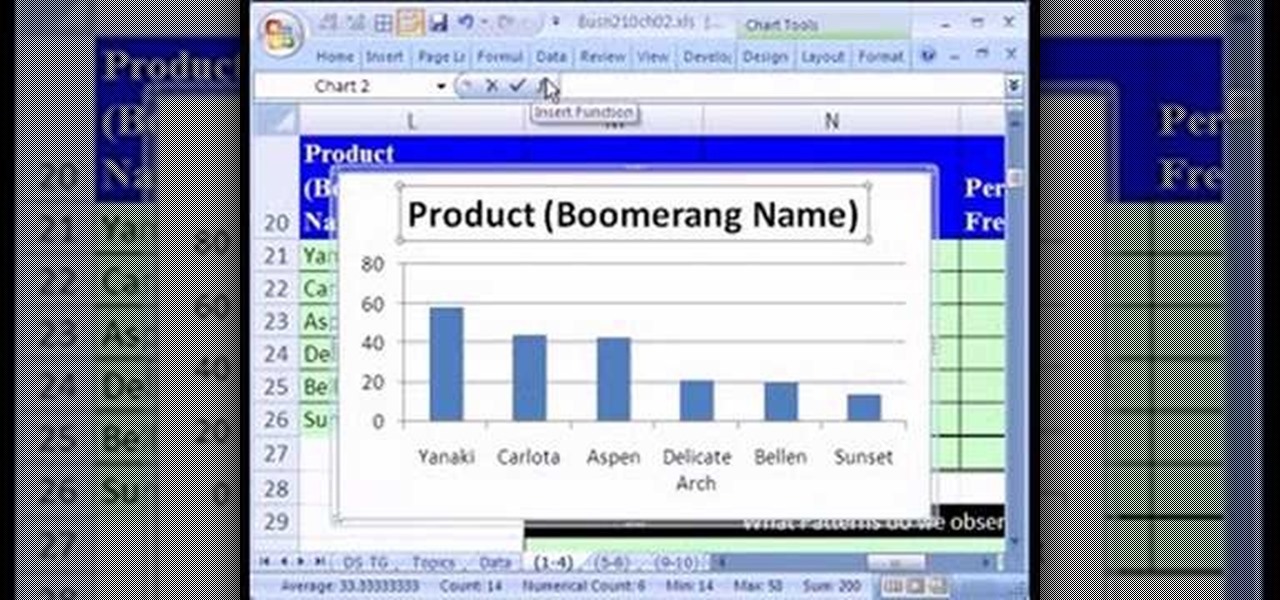
If you use Microsoft Excel on a regular basis, odds are you work with numbers. Put those numbers to work. Statistical analysis allows you to find patterns, trends and probabilities within your data. In this MS Excel tutorial from everyone's favorite Excel guru, YouTube's ExcelsFun, the 13th installment in his "Excel Statistics" series of free video lessons, you'll learn how to create a column chart from a frequency distribution for categorical data.

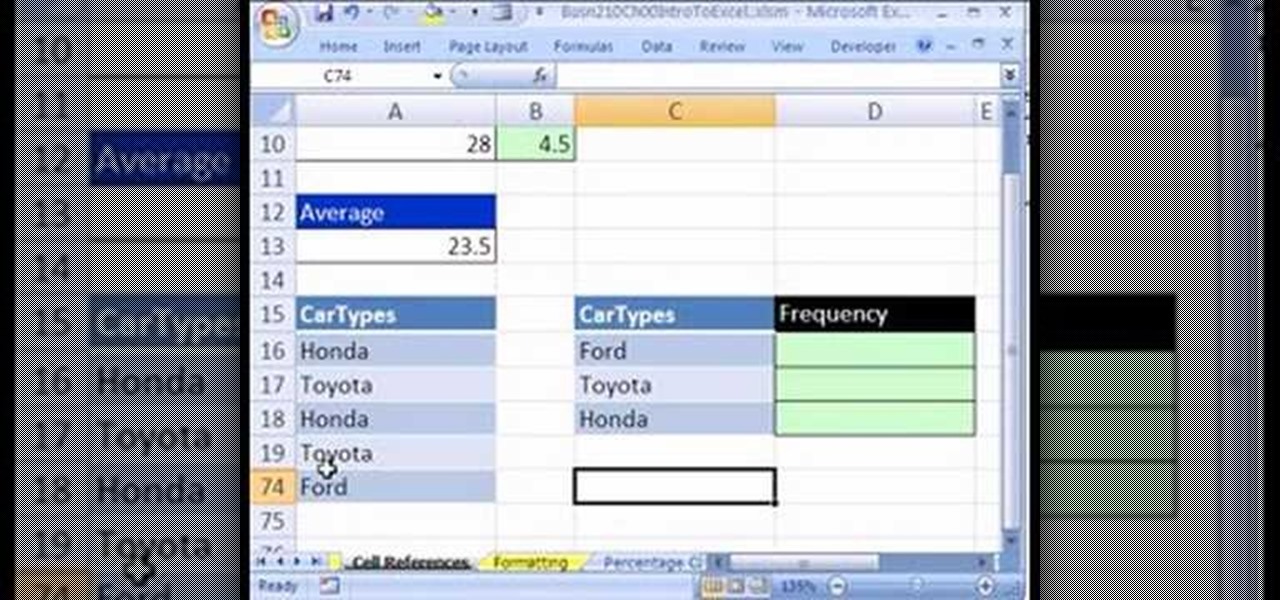
If you use Microsoft Excel on a regular basis, odds are you work with numbers. Put those numbers to work. Statistical analysis allows you to find patterns, trends and probabilities within your data. In this MS Excel tutorial from everyone's favorite Excel guru, YouTube's ExcelsFun, the 5th installment in his "Excel Statistics" series of free video lessons, you'll learn how to use relative and absolute cell references to save time when writing formulas.

Some trends come and go, but true style is timeless - just look at Coco Chanel, whose menswear two piece suits and quilted bags are just as beautiful today as when she wore them in the 1920's. And a tailored jacket is one piece that every woman should have - contoured, slimming, and sleek, it's as wearable to an office meeting as to lunch with the gals.

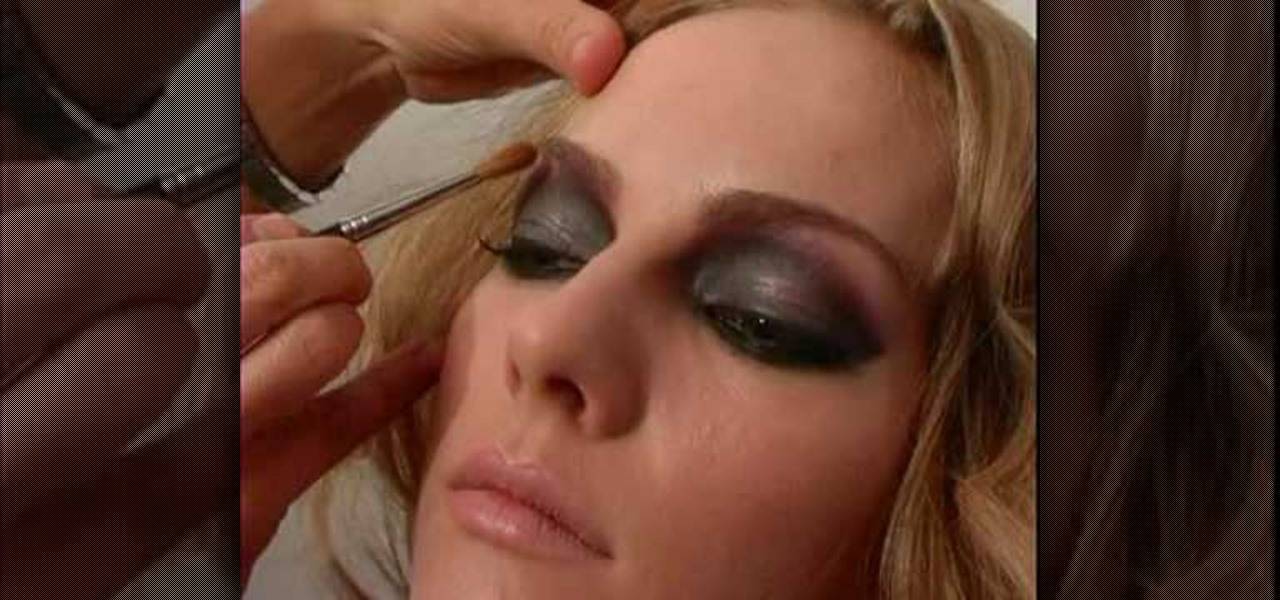
Here's a step-by-step on how to score three different versions of a gothic makeup trend.

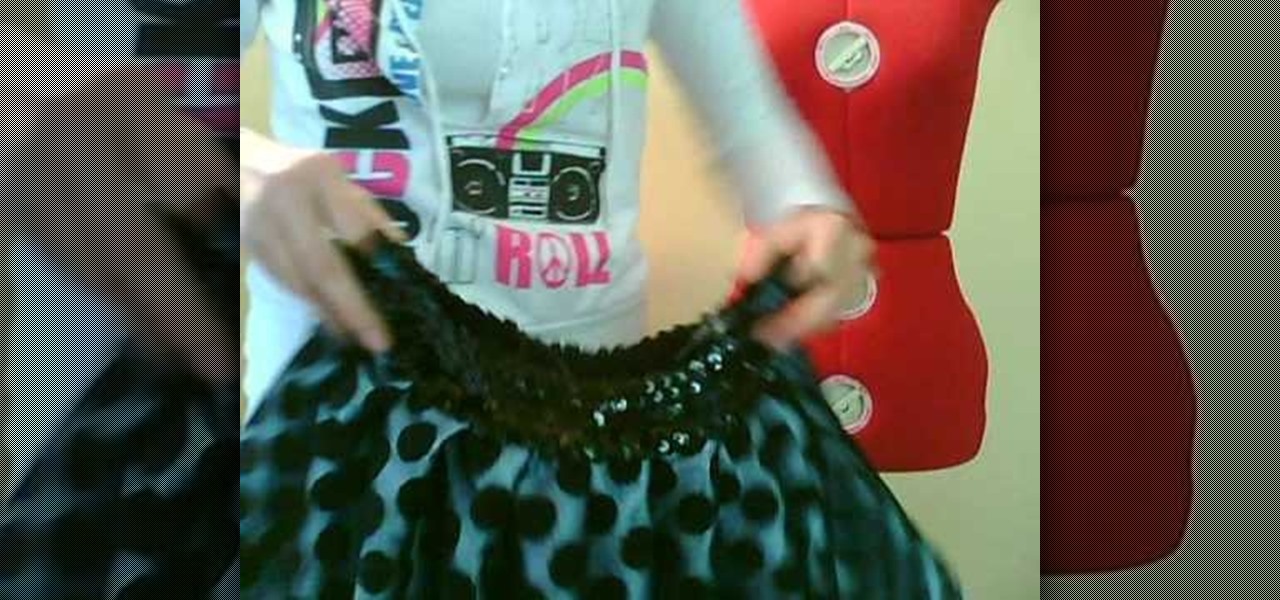
The bubble skirt is very 'in' right now, but who knows for how long it will last. Trends come and go, so why not make your own skirt instead of heading out to the mall?

The hippie bohemian trend is BACK!! This fun video is a step by step guide to dying your very own tie dye clothing just like they wore in the 70's! Not your style? You can tie dye your bed sheets for a groovy retro feel. Tie dye is very fun, colorful and cheery and perfect for kids to complete as a craft project! You can buy each child a white t-shirt and help them tie dye their shirts. Each one will have its own original design!

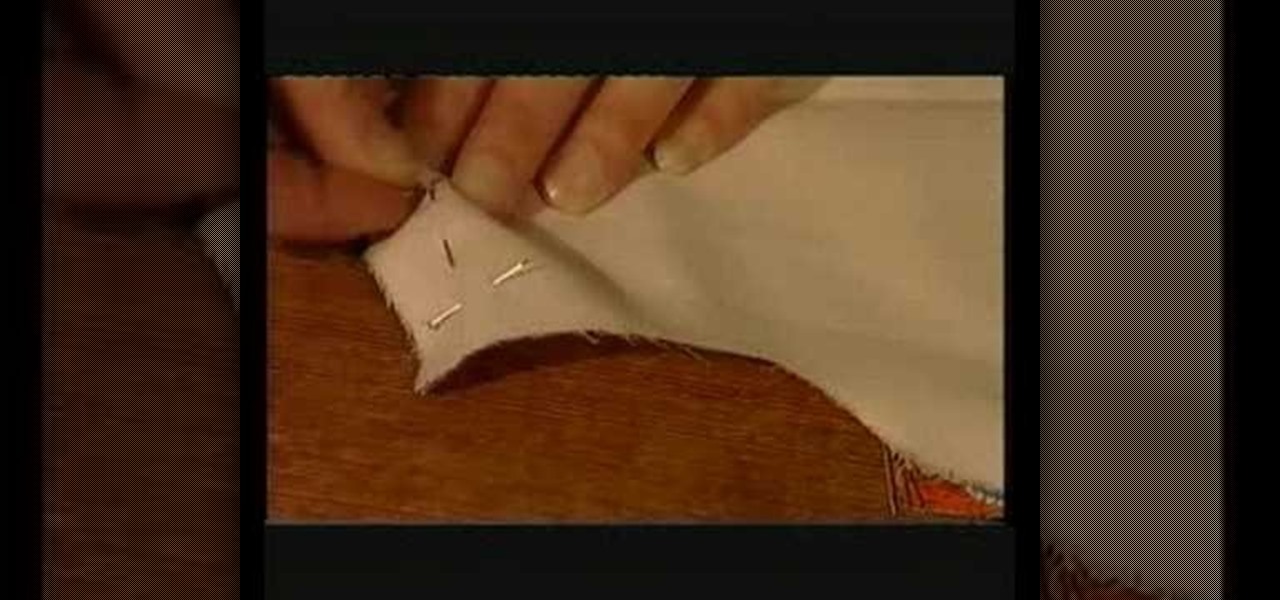
Making your child's clothing can be a great way to save money and stay up on the latest trends. This two part sewing tutorial gives you detailed instructions of how to begin construction of a versatile pinafore dress made in all manner of designs. This dress can be worn in all seasons, whether by itself in the summer or with a smart jacket or cardigan in the winter. Watch this how to video and you will be able to sew this pretty peekaboo dress for your little girl.

Magic Leap has already entered the realm of entertainment and enterprise, but on now it has blazed its way into a new augmented reality frontier: fashion.

Over the course of the past century or so, media consumption has gone from a few readers enjoying their local print publication to billions of users viewing countless hours of video across the globe each day. This was a gradual evolution at first, but recent advancements in mobile connectivity have sent us into a climb the likes of which we have never seen before.

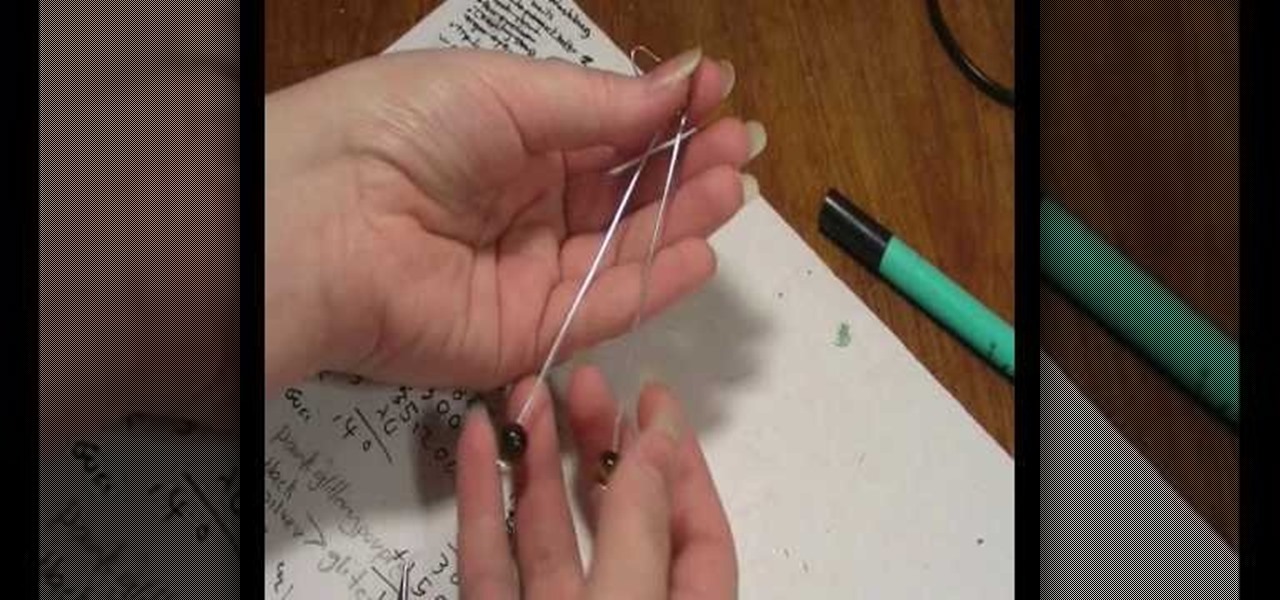
There's no need to shell out tons of money to wear the latest jewelry trend. Craft your own bohemian, indie-cool jewelry by checking out this DIY video.

Girl next door Jennifer Aniston is a master of sexy yet low maintenance hairstyles. She did famously start "The Rachel" haircut trend, which spread to salons all over America and remains a haircut staple today.

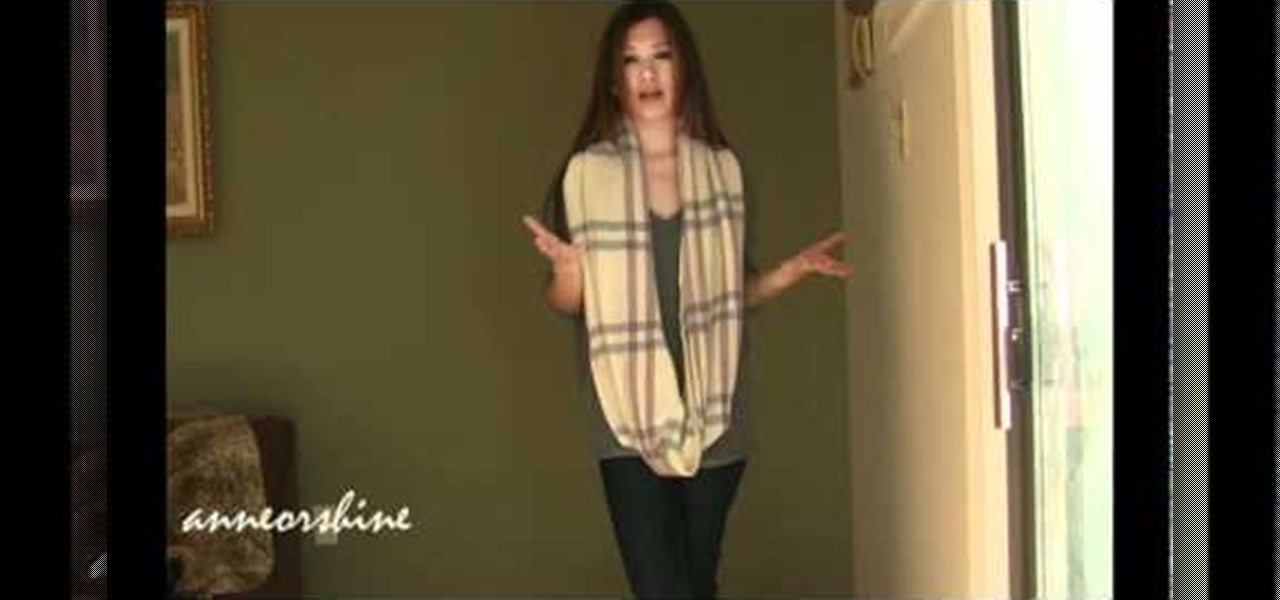
With winter in full swing, it's time to bring the scarves out of the closet. The trend this year is the tube scarf or infinity scarf, and here is how you can take a scarf you already have and update it to this style.

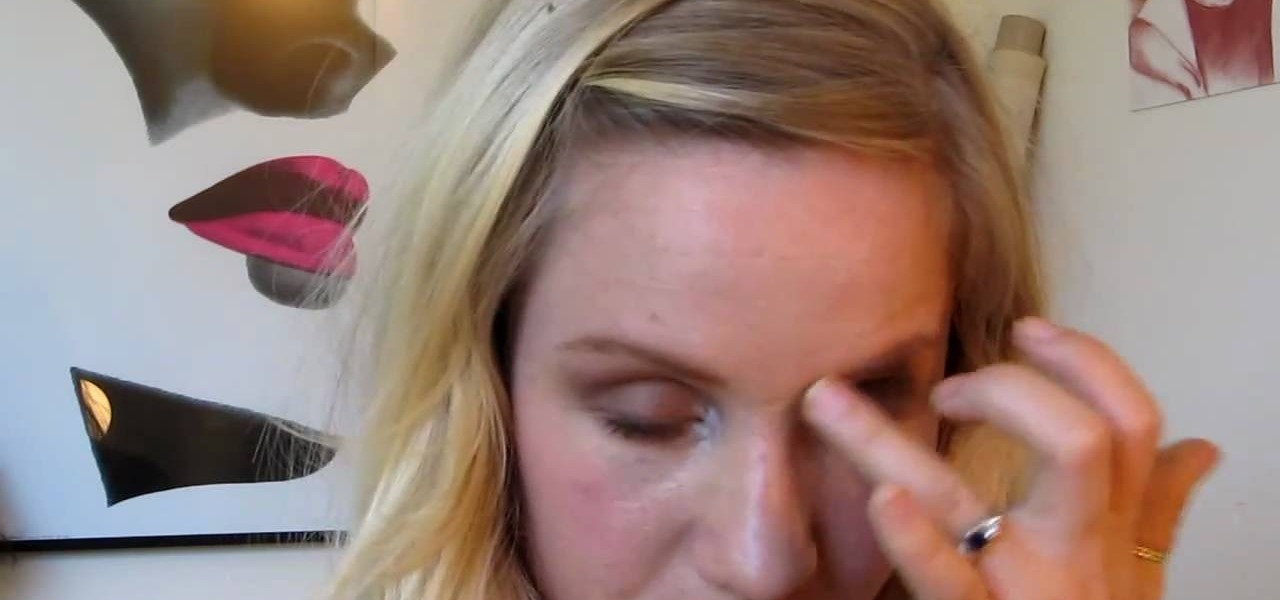
Anyone in the world of makeup knows who Pat McGrath is. The world renowned makeup artist recently did the makeup for a catwalk for designer Roberto Caballi, and instead of taking the usual black smokey eyes look, she went for a new trend this season— BROWN! In this tutorial, you'll learn how to create a bold and beautiful brown smokey eyes look, great for the autumn and winter months.

Dolls may freak the rest of us out, but for a lot of girls in Japan looking like a doll - scarily large, beady eyes, perfect ringlets, and porcelain skin - is its own beauty and style trend.

Braids seem to be the latest Hollywood trend. Very rarely do you see boho stars like Nicole Richie, Blake Lively, Mary-Kate Olsen or Mischa Barton without at least one twisted strand in their hair.

If you use Microsoft Excel on a regular basis, odds are you work with numbers. Put those numbers to work. Statistical analysis allows you to find patterns, trends and probabilities within your data. In this MS Excel tutorial from everyone's favorite Excel guru, YouTube's ExcelsFun, the 48th installment in his "Excel Statistics" series of free video lessons, you'll see comparison of Chebyshev's Theorem and the Empirical Rule (bell curve) and learn when to apply which.

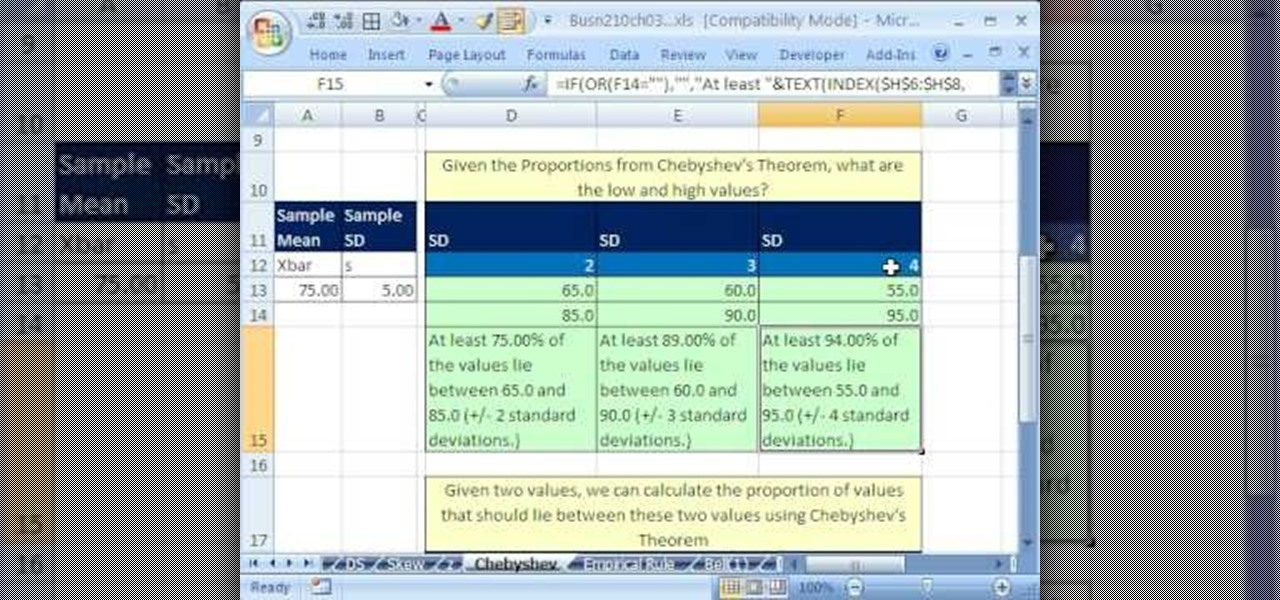
If you use Microsoft Excel on a regular basis, odds are you work with numbers. Put those numbers to work. Statistical analysis allows you to find patterns, trends and probabilities within your data. In this MS Excel tutorial from everyone's favorite Excel guru, YouTube's ExcelsFun, the 46th installment in his "Excel Statistics" series of free video lessons, you'll learn about Chebyshev's Theorem and how to apply it in three different ways.

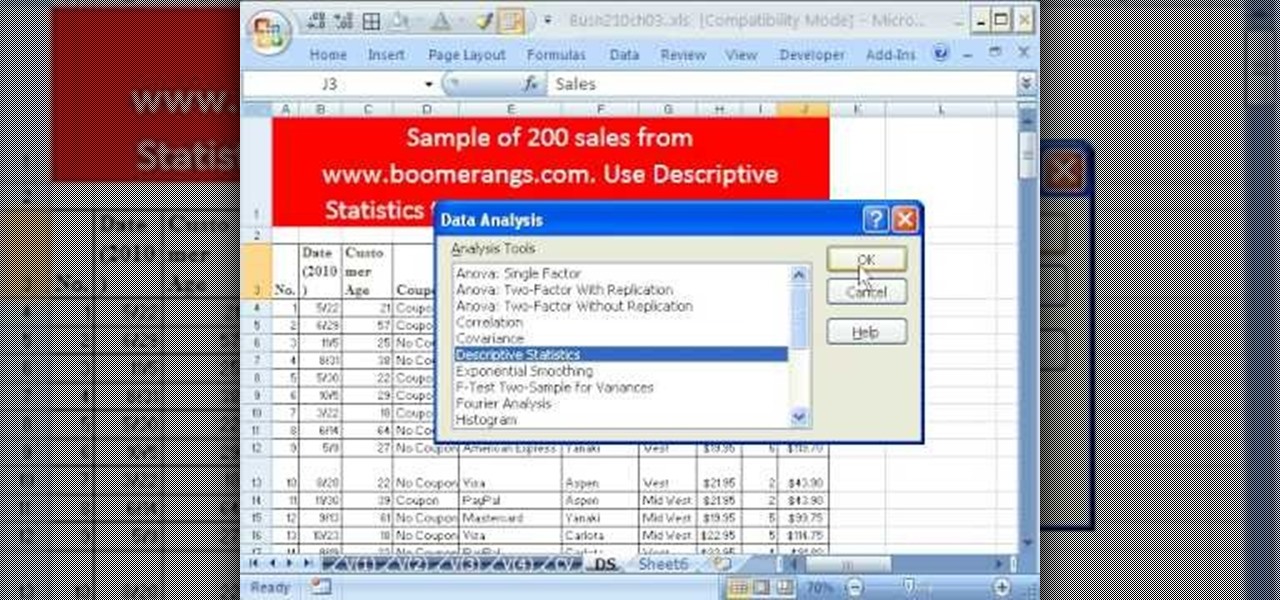
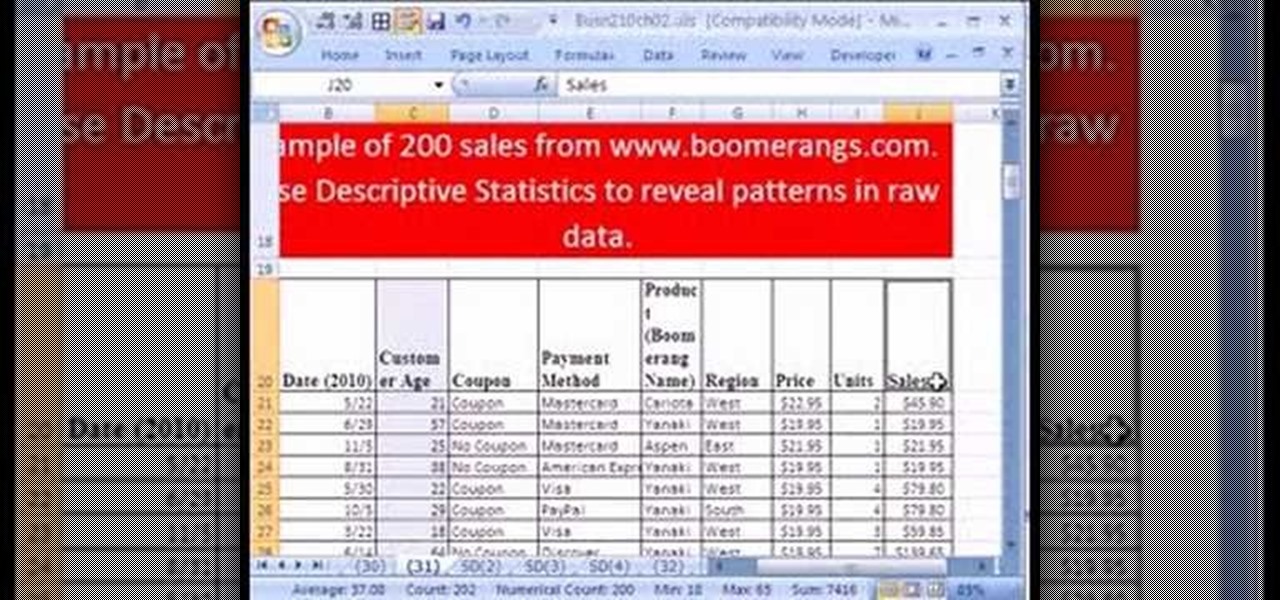
If you use Microsoft Excel on a regular basis, odds are you work with numbers. Put those numbers to work. Statistical analysis allows you to find patterns, trends and probabilities within your data. In this MS Excel tutorial from everyone's favorite Excel guru, YouTube's ExcelsFun, the 43rd installment in his "Excel Statistics" series of free video lessons, you'll learn how to use the Excel Data Analysis add-in descriptive statistics tool.

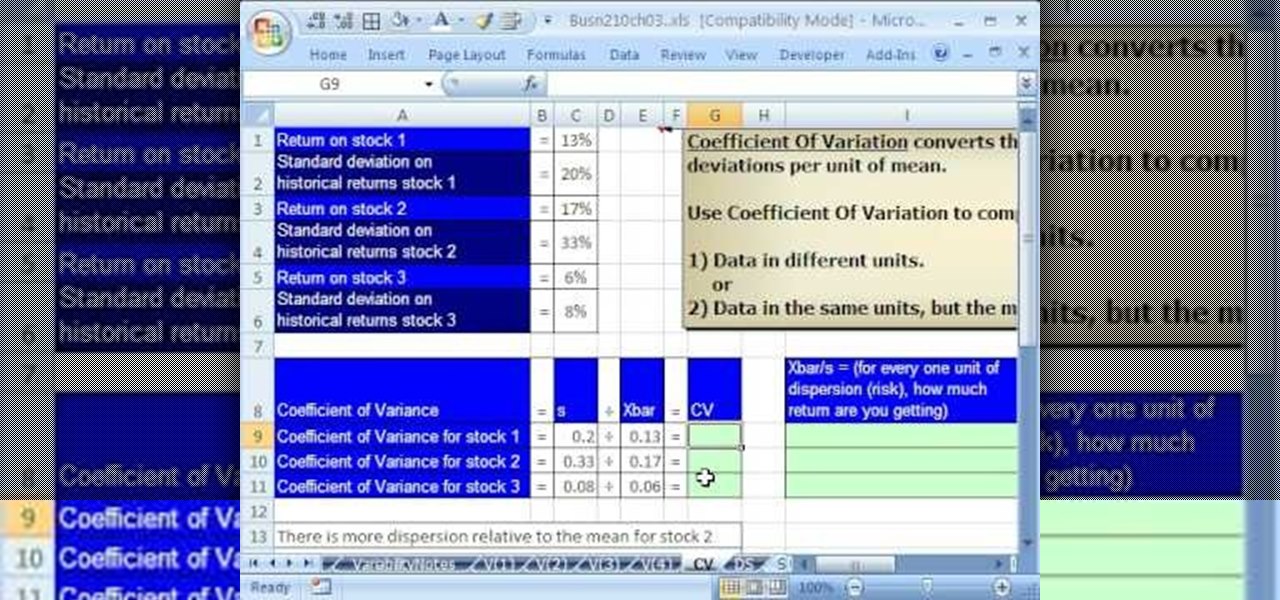
If you use Microsoft Excel on a regular basis, odds are you work with numbers. Put those numbers to work. Statistical analysis allows you to find patterns, trends and probabilities within your data. In this MS Excel tutorial from everyone's favorite Excel guru, YouTube's ExcelsFun, the 42nd installment in his "Excel Statistics" series of free video lessons, you'll learn how to calculate the coefficient of variation.

If you use Microsoft Excel on a regular basis, odds are you work with numbers. Put those numbers to work. Statistical analysis allows you to find patterns, trends and probabilities within your data. In this MS Excel tutorial from everyone's favorite Excel guru, YouTube's ExcelsFun, the 30th installment in his "Excel Statistics" series of free video lessons, you'll learn how to create a scatter diagram for 2 quantitative variables.

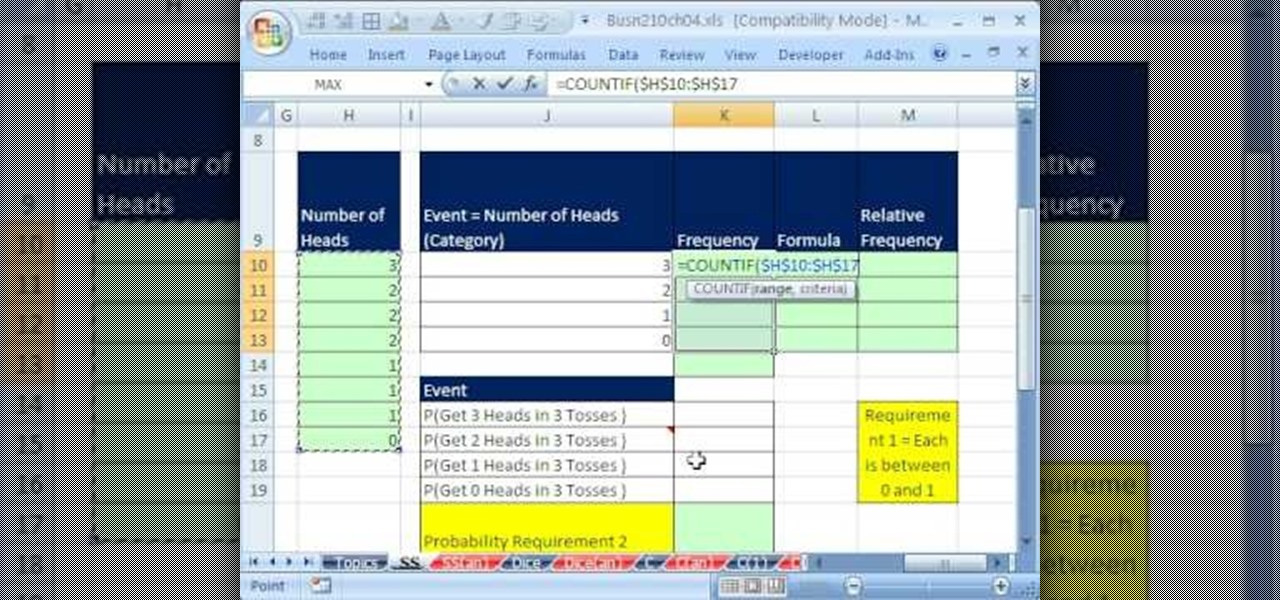
If you use Microsoft Excel on a regular basis, odds are you work with numbers. Put those numbers to work. Statistical analysis allows you to find patterns, trends and probabilities within your data. In this MS Excel tutorial from everyone's favorite Excel guru, YouTube's ExcelsFun, the 51st installment in his "Excel Statistics" series of free video lessons, you'll learn how to understand, work with and find simple probabilities in Microsoft Office Excel.

If you use Microsoft Excel on a regular basis, odds are you work with numbers. Put those numbers to work. Statistical analysis allows you to find patterns, trends and probabilities within your data. In this MS Excel tutorial from everyone's favorite Excel guru, YouTube's ExcelsFun, the 93rd installment in his "Excel Statistics" series of free video lessons, you'll learn how to use the NORMSINV and NORMSDIST functions to complete a hypothesis test about a population proportion.

If you use Microsoft Excel on a regular basis, odds are you work with numbers. Put those numbers to work. Statistical analysis allows you to find patterns, trends and probabilities within your data. In this MS Excel tutorial from everyone's favorite Excel guru, YouTube's ExcelsFun, the 83rd installment in his "Excel Statistics" series of free video lessons, you'll learn how to construct confidence intervals when the sigma (population standard deviation) in NOT known using the TINV function.

If you use Microsoft Excel on a regular basis, odds are you work with numbers. Put those numbers to work. Statistical analysis allows you to find patterns, trends and probabilities within your data. In this MS Excel tutorial from everyone's favorite Excel guru, YouTube's ExcelsFun, the 29th installment in his "Excel Statistics" series of free video lessons, you'll learn how to create quantitative data cross tabulation using a pivot table (PivotTable).

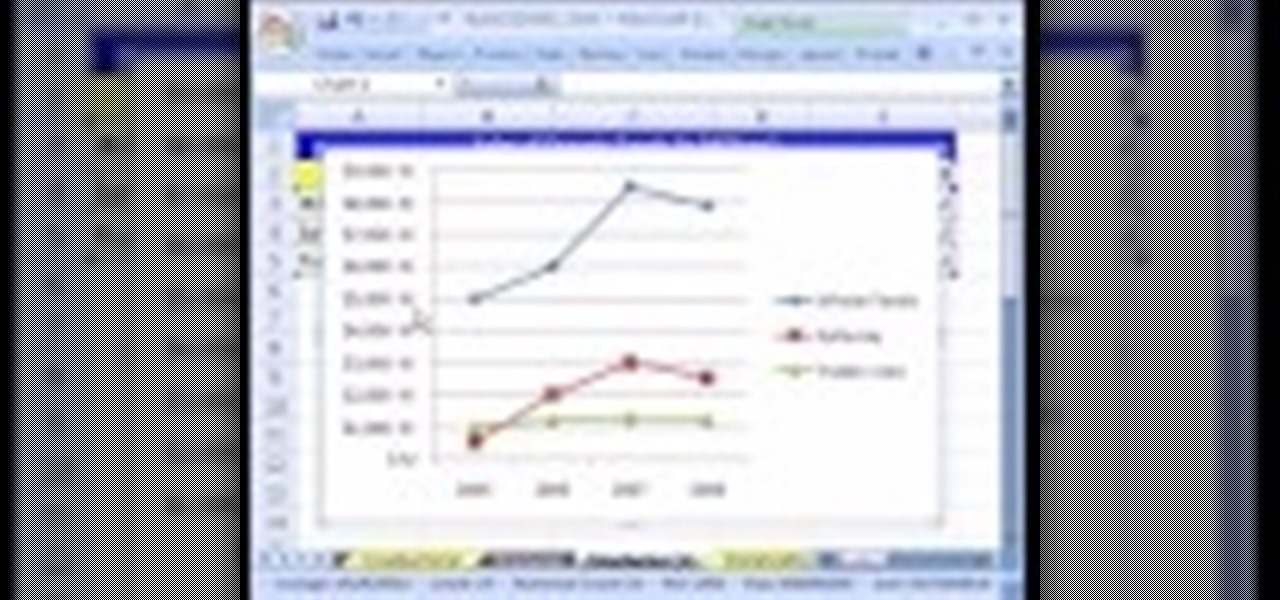
If you use Microsoft Excel on a regular basis, odds are you work with numbers. Put those numbers to work. Statistical analysis allows you to find patterns, trends and probabilities within your data. In this MS Excel tutorial from everyone's favorite Excel guru, YouTube's ExcelsFun, the 11th installment in his "Excel Statistics" series of free video lessons, you'll learn how to work with, and create charts for, cross-sectional and time-series data.


