If you use Microsoft Excel on a regular basis, odds are you work with numbers. Put those numbers to work. Statistical analysis allows you to find patterns, trends and probabilities within your data. In this MS Excel tutorial from everyone's favorite Excel guru, YouTube's ExcelsFun, the 27th installment in his "Excel Statistics" series of free video lessons, you'll learn how to create a quantitative data dot plot chart using the REPT and COUNTIF functions.

If you use Microsoft Excel on a regular basis, odds are you work with numbers. Put those numbers to work. Statistical analysis allows you to find patterns, trends and probabilities within your data. In this MS Excel tutorial from everyone's favorite Excel guru, YouTube's ExcelsFun, the 26th installment in his "Excel Statistics" series of free video lessons, you'll learn how to create quantitative data cumulative frequency distributions with pivot tables.

If you use Microsoft Excel on a regular basis, odds are you work with numbers. Put those numbers to work. Statistical analysis allows you to find patterns, trends and probabilities within your data. In this MS Excel tutorial from everyone's favorite Excel guru, YouTube's ExcelsFun, the 16th installment in his "Excel Statistics" series of free video lessons, you'll learn how to cross tabulate & do percentage cross tabulation for categorical data using a pivot table (PivotTable).

If you use Microsoft Excel on a regular basis, odds are you work with numbers. Put those numbers to work. Statistical analysis allows you to find patterns, trends and probabilities within your data. In this MS Excel tutorial from everyone's favorite Excel guru, YouTube's ExcelsFun, the 19th installment in his "Excel Statistics" series of free video lessons, you'll learn how to group categories in a frequency distribution with a formula (2 COUNTIF) and the pivot table (PivotTable) grouping fea...

If you use Microsoft Excel on a regular basis, odds are you work with numbers. Put those numbers to work. Statistical analysis allows you to find patterns, trends and probabilities within your data. In this MS Excel tutorial from everyone's favorite Excel guru, YouTube's ExcelsFun, the 17th installment in his "Excel Statistics" series of free video lessons, you'll learn how to cross tabulate & do percentage cross tabulation for categorical data using formulas rather than pivot tables.

If you use Microsoft Excel on a regular basis, odds are you work with numbers. Put those numbers to work. Statistical analysis allows you to find patterns, trends and probabilities within your data. In this MS Excel tutorial from everyone's favorite Excel guru, YouTube's ExcelsFun, the 3rd installment in his "Excel Statistics" series of free video lessons, you'll learn how to use Excel's sorting and pivot tables (PivotTables) data analysis tools.

If you use Microsoft Excel on a regular basis, odds are you work with numbers. Put those numbers to work. Statistical analysis allows you to find patterns, trends and probabilities within your data. In this MS Excel tutorial from everyone's favorite Excel guru, YouTube's ExcelsFun, the 35th installment in his "Excel Statistics" series of free video lessons, you'll learn how to calculate weighted and geometric means and see how to use the GEOMEAN function.
If you use Microsoft Excel on a regular basis, odds are you work with numbers. Put those numbers to work. Statistical analysis allows you to find patterns, trends and probabilities within your data. In this MS Excel tutorial from everyone's favorite Excel guru, YouTube's ExcelsFun, the 33rd installment in his "Excel Statistics" series of free video lessons, you'll learn how to use the AVEARGE, MEDIAN, MODE, PERCENTILE, QUARTILE and PERCENTILERANK functions to measure location.
If you use Microsoft Excel on a regular basis, odds are you work with numbers. Put those numbers to work. Statistical analysis allows you to find patterns, trends and probabilities within your data. In this MS Excel tutorial from everyone's favorite Excel guru, YouTube's ExcelsFun, the 4th installment in his "Excel Statistics" series of free video lessons, you'll learn how to create a frequency table and percentage frequency table using a Pivot Table (PivotTable).
Replay Music makes it possible to record audio from the web. No longer do you have to listen to streaming audio on the web and have to go back online to revisit your favorite moments. Replay Music enables you to download any audio streaming on the web straight to your computer so you can listen to it whenever you want.
Losing weight can be simple if you follow one rule: Cut calories! In this Ask Amy tutorial, your neighborhood nutritionist shows you how to cut back on the calories and lose the weight easily without feeling like you are sacrificing your favorites. Follow Amy's advice and you will be fitting into your jeans easier sooner than you think!
Whether you're new to Adobe's Creative Suite or a seasoned graphic design professional after a general overview of CS5's most vital new features, you're sure to be well served by this official video tutorial from the folks at Adobe TV. In it, Terry White discusses his five favorite features of the newest addition to Adobe's CS, Flash Catalyst, an application which allows you to create dynamic web pages without coding. Learn how to create dynamic scrolling content and functional Flash buttons ...
Whether you're new to Adobe Photoshop or a seasoned graphic arts professional after a general overview of CS5's most vital new features, you're sure to be well served by this official video tutorial from the folks at Adobe TV. In it, you'll join Terry White as he runs through his 5 favorite Photoshop CS5 features, including the new enhanced selection abilities and noise reduction tools.
Watch this science video tutorial from Nurd Rage on how to find chemicals for science experiments with Dr. Lithium.
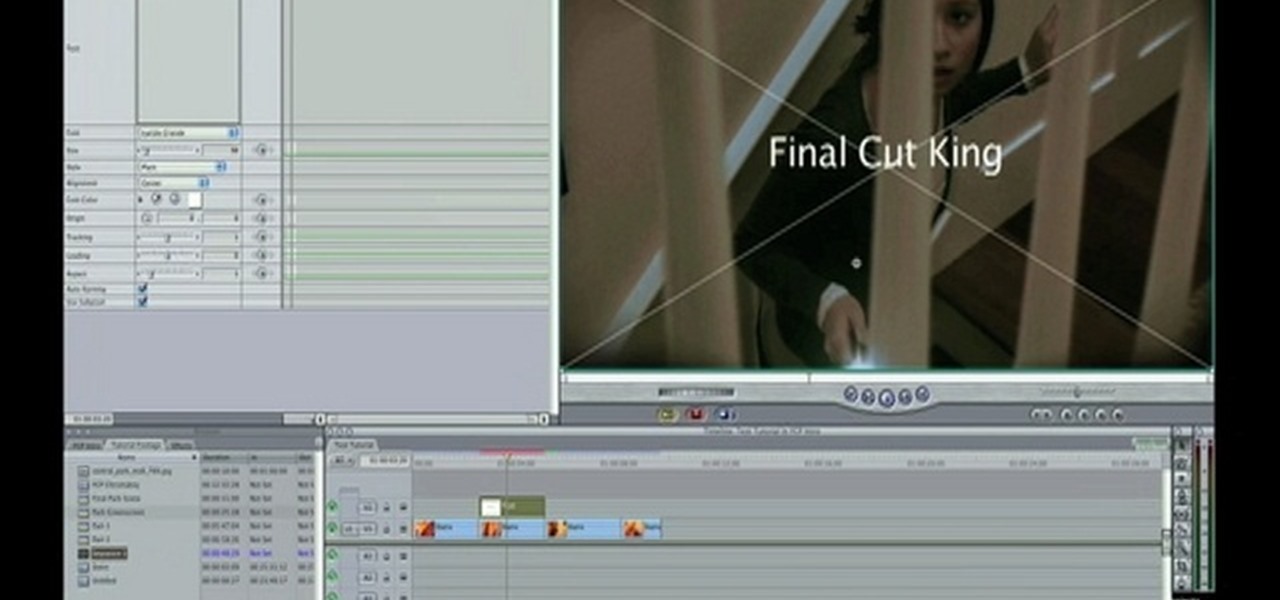
For this Final Cut Studio video tutorial, Zach King will teach you how to create and manage text in Final Cut Pro. To create and manage text, just go to the Video Generators Tab in the Viewer window, go to Text, and choose your favorite option, or just the plain old Text. Check out the rest of the process in Final Cut. Let the Final Cut King show you how!
Don’t pass up on this festive favorite because of the calories; just mix yourself a lighter version mojito.
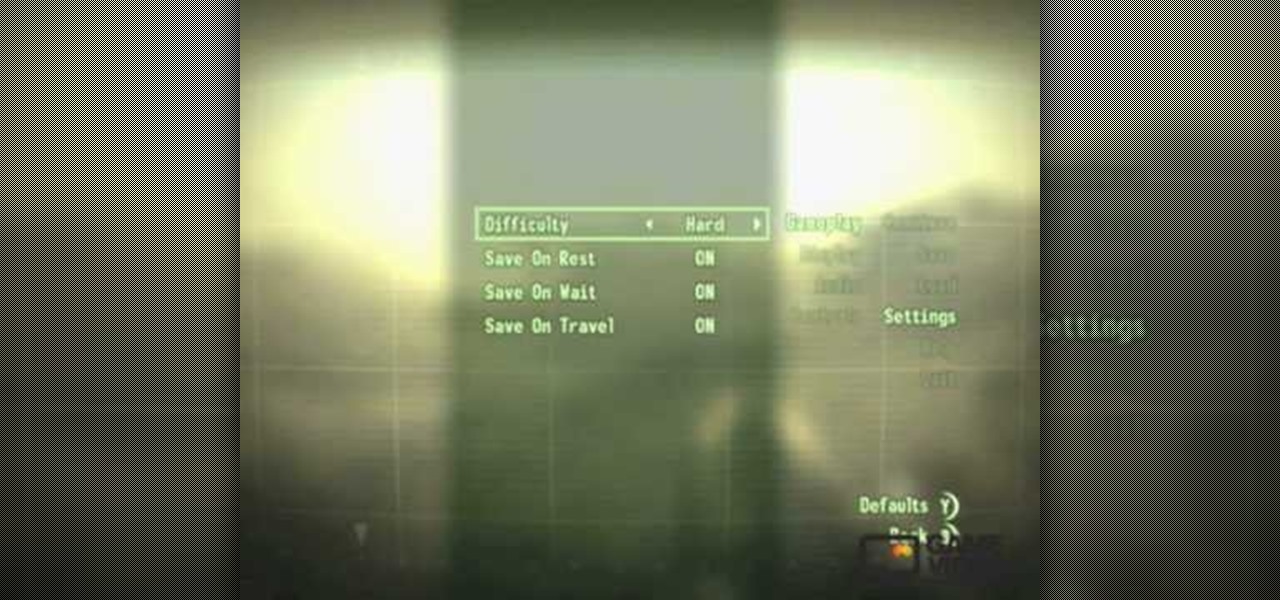
From the Fallout 3 SuperGuide on MyCheats. MyCheats staff writer Mike Nelson talks about his favorite exploits and tricks in Fallout 3.
This software tutorial shows you how to use the Knoll Light Factory Pro plug-in for After Effects. Knoll Light Factory Pro is the industry's favorite tool for creating lens flares, sunsets, photon torpedoes, stars and other effects. It offers a custom lens editor, auto tracking, alpha channel support, and pinpoint control over dozens of settings. If you haven't used the Knoll Light Factory Pro plug-in yet, watch this After Effects tutorial and get started.
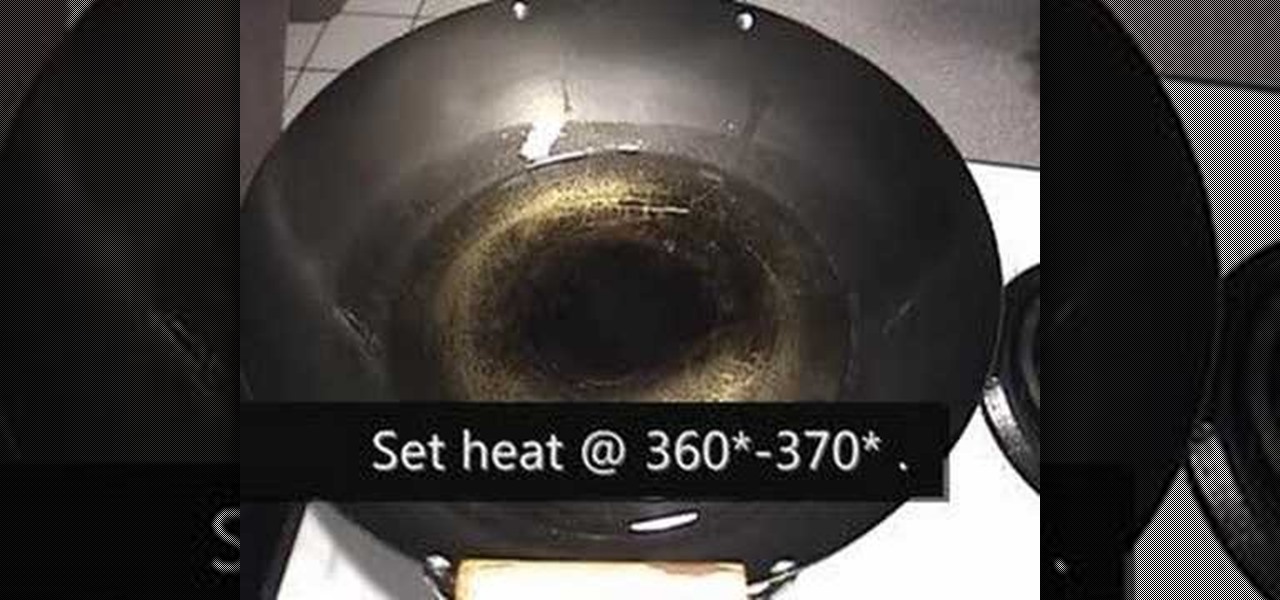
Forget the take out tonight, cook some Chinese food at home instead. Watch this how to video cooking tutorial and let Thai Chef Kai show you how to make orange chicken. Orange chicken is a classic Chinese food favorite, learn how to make it for dinner.
When there isn't space in a garden for favorite plants, they can be planted in containers and placed on a patio or deck. This how-to clip provides instructions for how to plant a beautiful and functional container garden.
Adding a decorative shelf to a room enhances the decor and also gives you a place to display your favorite photos and knickknacks. Before you get started, learn how to securely hang a shelf.
When you create a CD or DVD of your favorite photos, your photos won't be resized or lose any resolution, so it's a great way to back up and archive your photos for safekeeping.
This is one of my favorite projects, a wide format pinhole camera that uses 35mm film and is made from $10 in crafts store items.
Learn how to play guitar with this classic Lynyrd Skynyrd song from our favorite guitar teacher Justin Sandercoe. This is the first video but make sure you watch the second one so you can play all of "Sweet Home Alabama". This is really for advanced players.
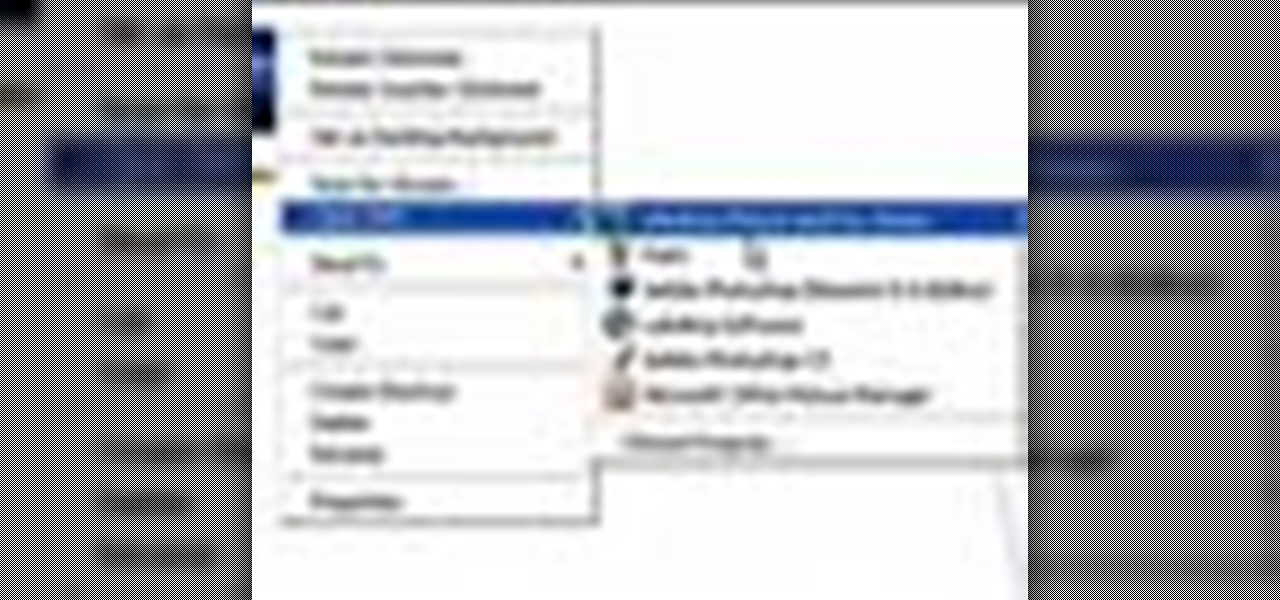
Did you know you can control which software opens which file extensions on your computer in Windows XP? Learn how to edit file associations and default to your favorite programs.
Redecorating your home can seem like an overwhelming task but it doesn’t have to be. You don’t need a professional as long as take into consideration the key elements such as your budget, the style you want and a color pattern.
The UK's best-selling football magazine has teamed up with The FA to improve your game! This how-to video shows how to do the twist and turn move! Watch this video soccer tutorial and learn how to practice this running soccer move.
Craig Anderton, music technology authority and the editor of EQ magazine, debuts his Minimoog Expansion pack for Rapture, Cakewalk's wavetable synthesizer. Craig talks about his relationship with Bob Moog, the importance of the instrument, and the painstaking process he used to creating this expansion Pack for Rapture. He also discussed how you can use these sounds in minimoog as a springboard for new sonic creations through Rapture's advanced synthesis capabilities.
RC Car Action Magazine Editor Kevin shows you how to stop a nitro engine. Just bump the flywheel with a screwdriver or pinch the fuel line. Watch this video tutorial and learn how to stop a nitro engine on an RC vehicle.
RC Car Action Magazine Editor Paul Onorato shoes a neat tip on cutting perfect body posts. Most cars come with body posts that are too long, but cutting them can warp the post. Watch this video tutorial and learn how to trim body posts for an RC car.
Origami crane. You can make them from napkins,candy wrappers, flyers, train tickets, and magazines. Try to make 1000 of them.
This week were hangin' out with the creative folks over at ReadyMade Magazine.Where we're gettin' the scoop inside their latest Re-Fashion issue, and taking on one of their super rad D.I.Y projects.
Take your Motorola Xoom Android gaming experience to the next level. Watch this video and follow these instructions to learn how to set up an Xbox 360 controller to work with your tablet wirelessly. Play all of your favorite emulator games.
In the mood to play your favorite Game Boy, SNES or Sega Genesis game? If the cartridges have been sitting around for a while, they probably need cleaning. Watch this video to learn how to properly clean a video game cartridge.
Take your iPhone/ iPod Touch NES experience to the next level by pairing a Wiimote to your jailbroken Apple iOS device. Follow the simple instructions in the video to learn how to play any ROM in the nes4iphone emulator with an actual controller. It's a whole new way to enjoy your favorite Nintendo video games.
Don't get us wrong - we love our iPhones and iPods - but sometimes we just want to kick back on the couch, pour ourselves a glass of Chardonnay, and go for the full surround sound musical experience. Get a more visceral exerpience of your favorite tunes by listening to them on your TV.
We know that every pink and red Hallmark card out there tells us that Valentine's Day is about smoochin' it up with your amor and generally cherishing the ones you love, but to be honest, the holiday is also about cherishing your love for candy and sweets.
You don't need to hire a professional bartender to have a well stocked and set up bar. In fact, all you really need for a handsome bar is Martha Stewart and her creative director, Kevin Sharkey.
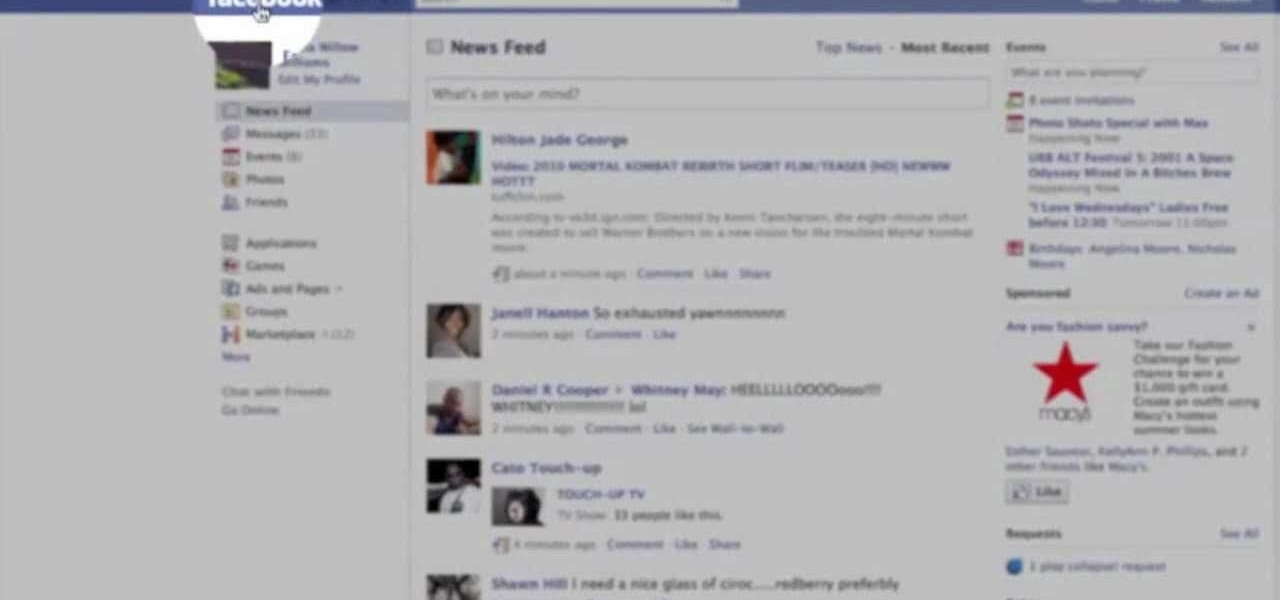
This tutorial assumes you've already set up your Facebook account, and are looking for tips and ideas on how to create a profile. Create a page for yourself, your business, your favorite group or any other organization you want to spotlight.
This is a quick and easy project you can use to make a beautiful, vintage inspired gift tag that you can attach to all your Christmas gifts! All you need is some basic papercrafting supplies in muted tones and your favorite vintage stamps!