If you use Microsoft Excel on a regular basis, odds are you work with numbers. Put those numbers to work. Statistical analysis allows you to find patterns, trends and probabilities within your data. In this MS Excel tutorial from everyone's favorite Excel guru, YouTube's ExcelsFun, the 35.2nd installment in his "Excel Statistics" series of free video lessons, you'll learn how to use Excel's GEOMEAN function to find geometric mean.
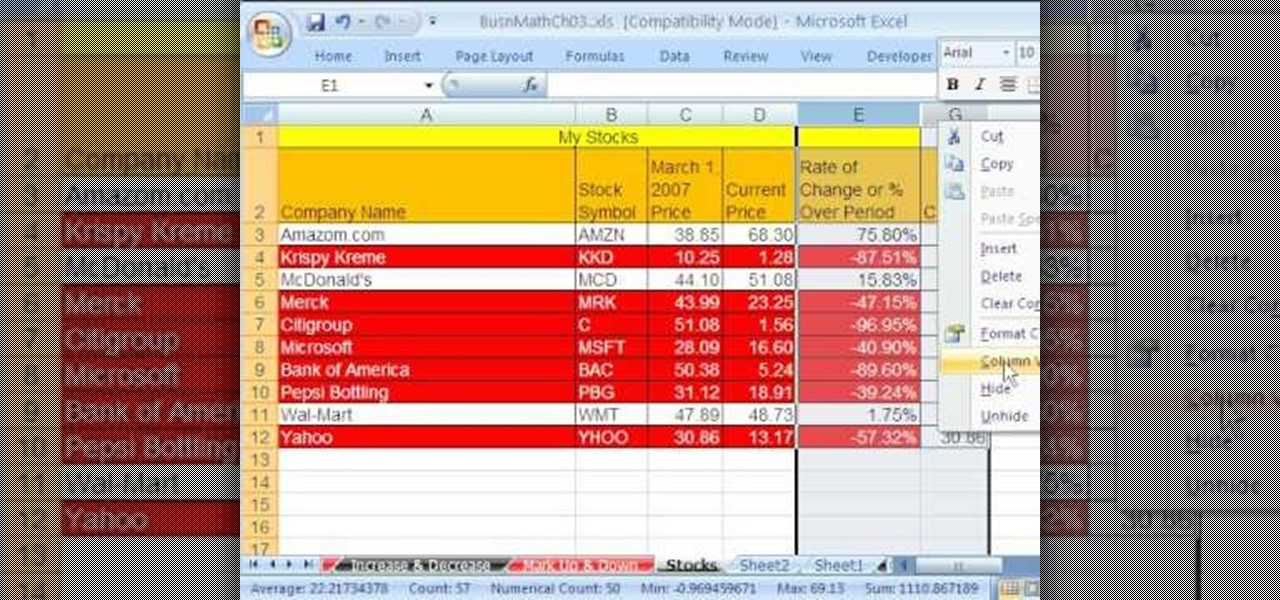
As you might guess, one of the domains in which Microsoft Excel really excels is business math. Brush up on the stuff for your next or current job with this how-to. In this tutorial from everyone's favorite digital spreadsheet guru, YouTube's ExcelIsFun, the 33rd installment in his "Excel Business Math" series of free video lessons, you'll learn how to add current stock prices to a stock analysis table in Excel using a web query.
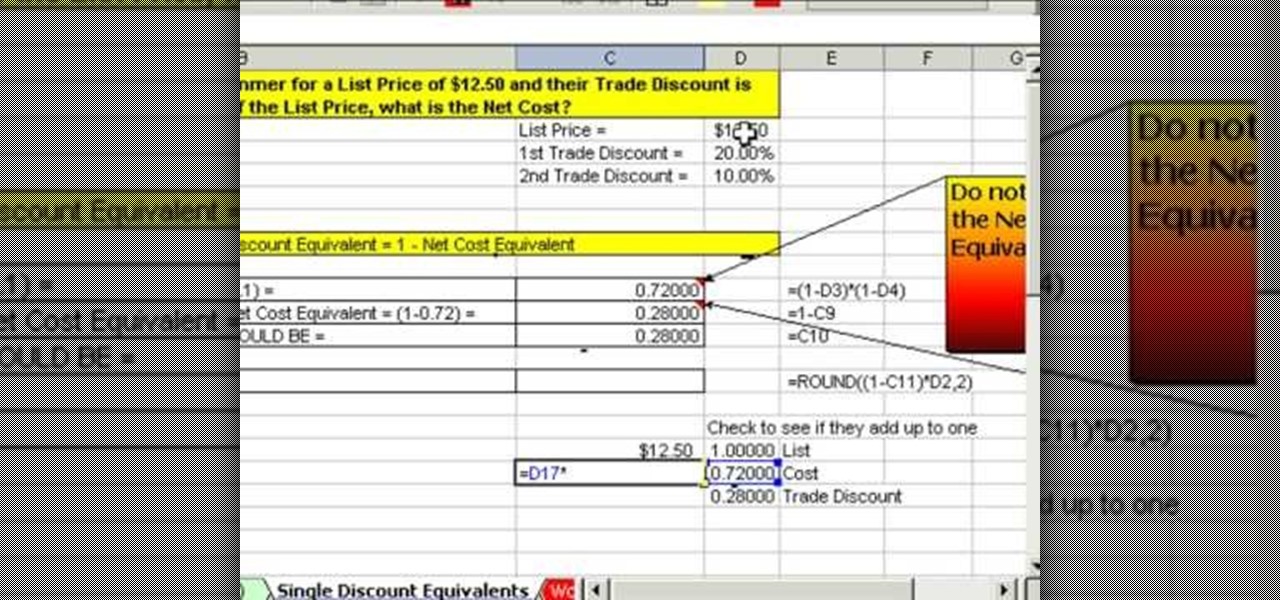
As you might guess, one of the domains in which Microsoft Excel really excels is business math. Brush up on the stuff for your next or current job with this how-to. In this tutorial from everyone's favorite digital spreadsheet guru, YouTube's ExcelIsFun, the 44th installment in his "Excel Business Math" series of free video lessons, you'll learn how to work with series trade discounts in MS Excel.

As you might guess, one of the domains in which Microsoft Excel really excels is business math. Brush up on the stuff for your next or current job with this how-to. In this tutorial from everyone's favorite digital spreadsheet guru, YouTube's ExcelIsFun, the 38th installment in his "Excel Business Math" series of free video lessons, you'll learn how to calculate gross and overtime pay in MS Excel.
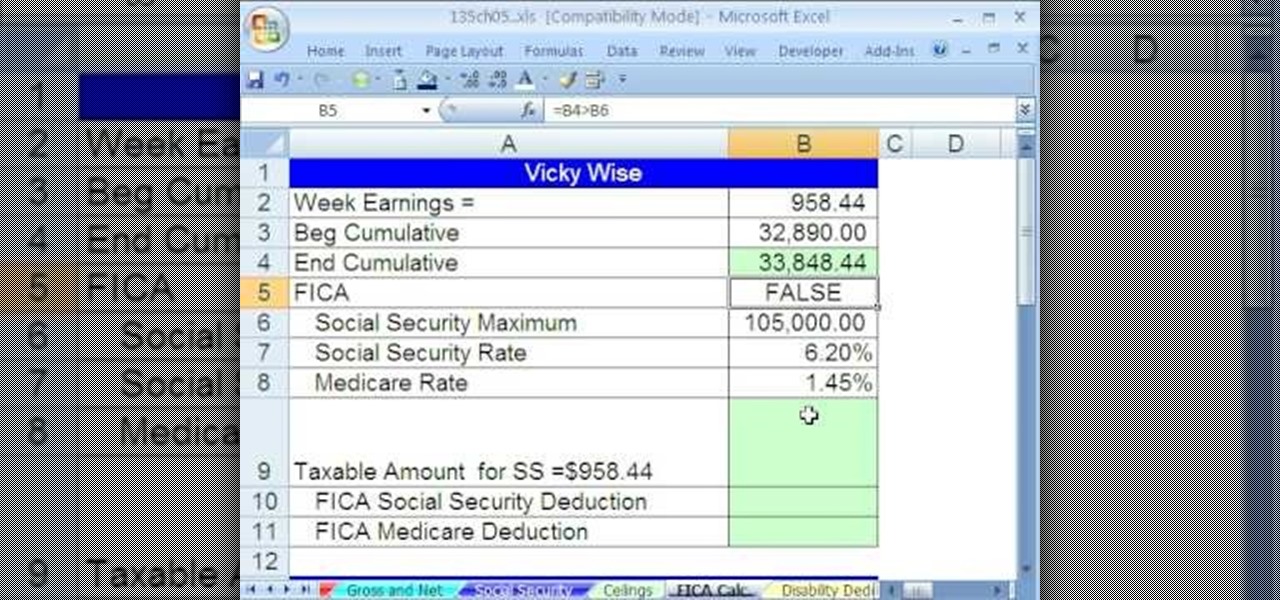
As you might guess, one of the domains in which Microsoft Excel really excels is business math. Brush up on the stuff for your next or current job with this how-to. In this tutorial from everyone's favorite digital spreadsheet guru, YouTube's ExcelIsFun, the 41st installment in his "Excel Business Math" series of free video lessons, you'll learn how to calculate deductions from paychecks when there is a ceiling or max taxable amount or hurdle.
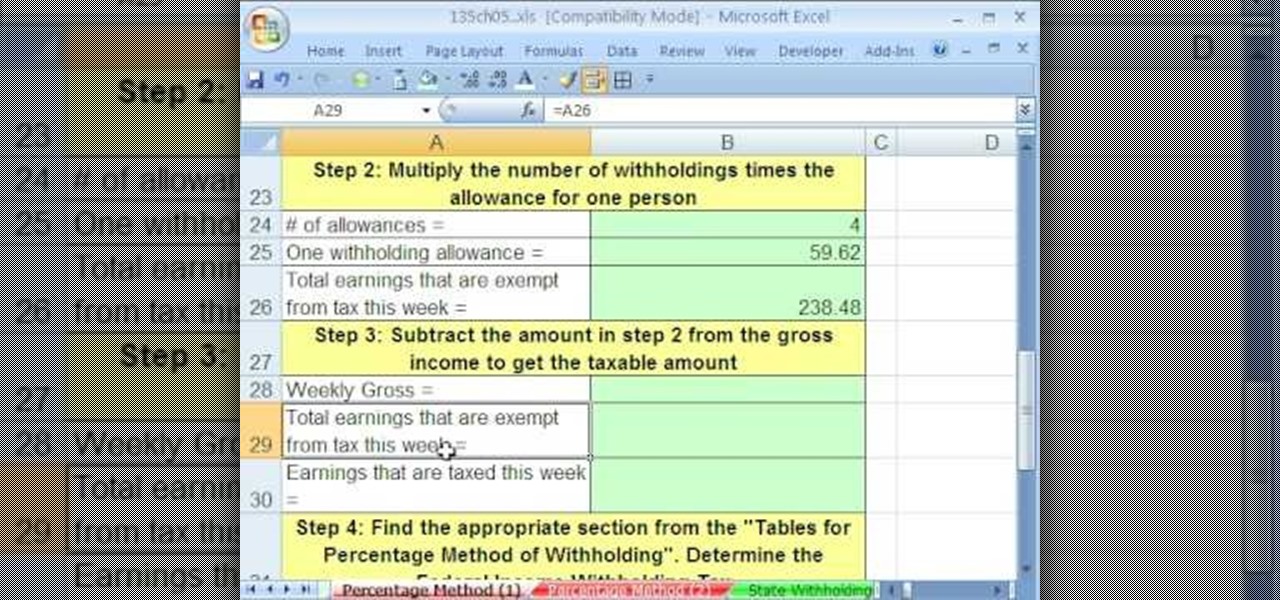
As you might guess, one of the domains in which Microsoft Excel really excels is business math. Brush up on the stuff for your next or current job with this how-to. In this tutorial from everyone's favorite digital spreadsheet guru, YouTube's ExcelIsFun, the 42nd installment in his "Excel Business Math" series of free video lessons, you'll learn about the wage bracket and percentage methods for calculating federal income tax payroll deductions.

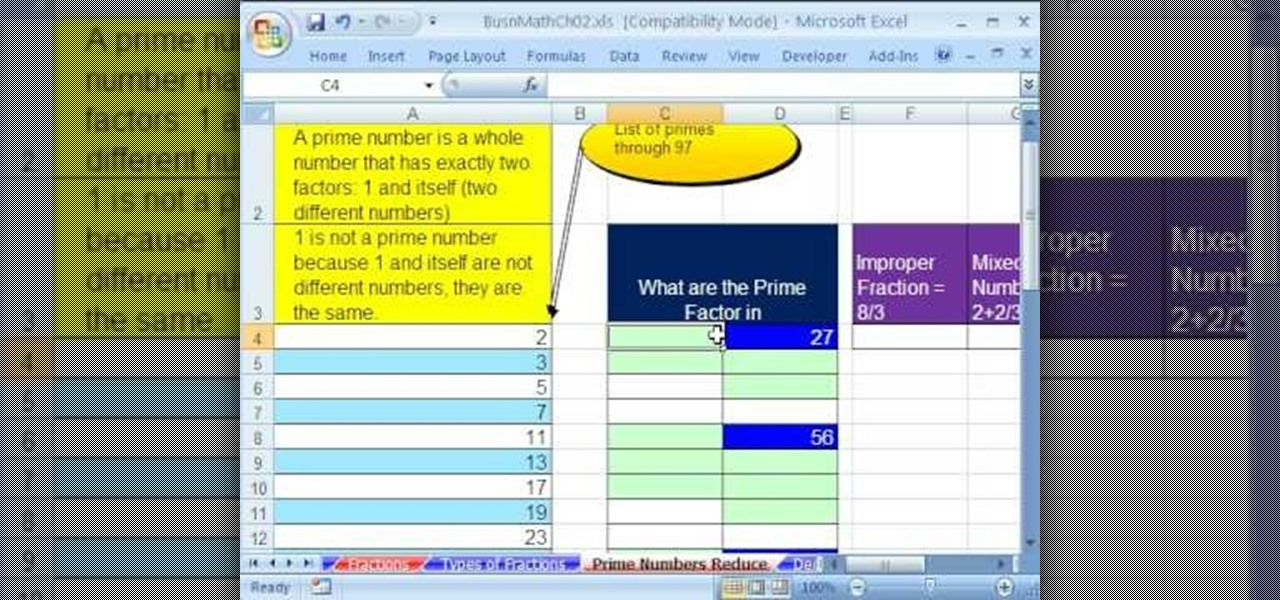
As you might guess, one of the domains in which Microsoft Excel really excels is business math. Brush up on the stuff for your next or current job with this how-to. In this tutorial from everyone's favorite digital spreadsheet guru, YouTube's ExcelIsFun, the 17th installment in his "Excel Business Math" series of free video lessons, you'll learn how to define prime numbers, determine prime factors, reduce fractions (i.e., write fractions in their lowest terms) and convert mixed numbers to imp...
If you use Microsoft Excel on a regular basis, odds are you work with numbers. Put those numbers to work. Statistical analysis allows you to find patterns, trends and probabilities within your data. In this MS Excel tutorial from everyone's favorite Excel guru, YouTube's ExcelsFun, the 40th installment in his "Excel Statistics" series of free video lessons, you'll learn how to calculate range & interquartile range for variability using the MAX, MIN, QUARTILE functions.
Looking for a primer on how to create and work with arrays in Microsoft Office Excel? You've come to the right place. In this free video tutorial from everyone's favorite MS Excel guru, YouTube's ExcelIsFun, the very first installment in his series of Excel array formula series, you'll learn how to create a basic array formula. Learn about the syntax, the Ctrl + Shift + Enter method of formula entry and the curly brackets that get entered automatically by Excel.
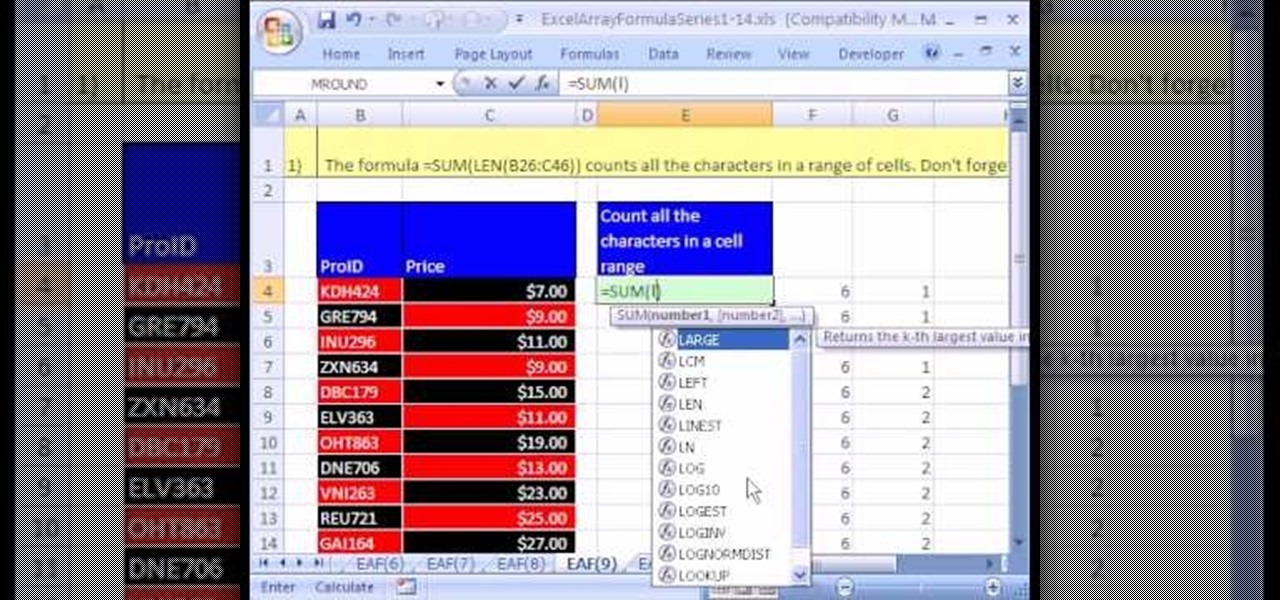
Looking for a primer on how to create and work with array formulas in Microsoft Office Excel? You've come to the right place. In this free video tutorial from everyone's favorite MS Excel guru, YouTube's ExcelIsFun, the 9th installment in his series of Excel array formula series, you'll learn create array formula that counts all the characters in a range of cells.
Looking for a primer on how to create and work with array formulas in Microsoft Office Excel? You've come to the right place. In this free video tutorial from everyone's favorite MS Excel guru, YouTube's ExcelIsFun, the 12th installment in his series of Excel array formula series, you'll learn how to use the array function MMULT to multiply multiple matrices in matrix algebra. (NB: This is an array function that requires the Ctrl + Shift + Enter trick.)
Looking for a primer on how to create and work with names in Microsoft Office Excel? You've come to the right place. In this free video tutorial from everyone's favorite MS Excel guru, YouTube's ExcelIsFun, the 12th installment in his series of Excel name tricks, you'll learn how to use the built-in dynamic range names in Excel 2007 Tables.
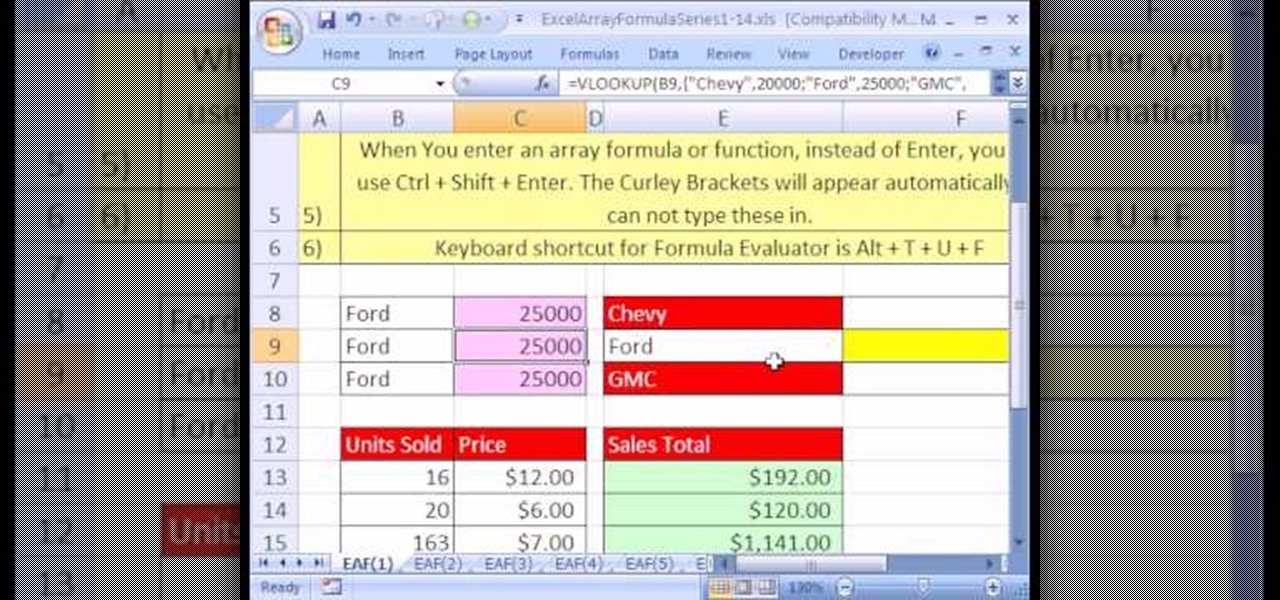
Looking for a primer on how to create and work with names in Microsoft Office Excel? You've come to the right place. In this free video tutorial from everyone's favorite MS Excel guru, YouTube's ExcelIsFun, the 10th installment in his series of Excel name tricks, you'll learn how to store lookup tables in memory using a named array.
Looking for a primer on how to create and work with names in Microsoft Office Excel? You've come to the right place. In this free video tutorial from everyone's favorite MS Excel guru, YouTube's ExcelIsFun, the 8th installment in his series of Excel name tricks, you'll learn how to name cell ranges with relative cell references instead of the default absolute cell references.
If you use Microsoft Excel on a regular basis, odds are you work with numbers. Put those numbers to work. Statistical analysis allows you to find patterns, trends and probabilities within your data. In this MS Excel tutorial from everyone's favorite Excel guru, YouTube's ExcelsFun, the 86th installment in his "Excel Statistics" series of free video lessons, you'll learn how to construct confidence intervals for proportions using NORMSINV function and other formulas.
If you use Microsoft Excel on a regular basis, odds are you work with numbers. Put those numbers to work. Statistical analysis allows you to find patterns, trends and probabilities within your data. In this MS Excel tutorial from everyone's favorite Excel guru, YouTube's ExcelsFun, the 87th installment in his "Excel Statistics" series of free video lessons, you'll learn how to calculate sample size (n) for confidence intervals.
If you use Microsoft Excel on a regular basis, odds are you work with numbers. Put those numbers to work. Statistical analysis allows you to find patterns, trends and probabilities within your data. In this MS Excel tutorial from everyone's favorite Excel guru, YouTube's ExcelsFun, the 27th installment in his "Excel Statistics" series of free video lessons, you'll learn how to create a quantitative data dot plot chart using the REPT and COUNTIF functions.
If you use Microsoft Excel on a regular basis, odds are you work with numbers. Put those numbers to work. Statistical analysis allows you to find patterns, trends and probabilities within your data. In this MS Excel tutorial from everyone's favorite Excel guru, YouTube's ExcelsFun, the 26th installment in his "Excel Statistics" series of free video lessons, you'll learn how to create quantitative data cumulative frequency distributions with pivot tables.
If you use Microsoft Excel on a regular basis, odds are you work with numbers. Put those numbers to work. Statistical analysis allows you to find patterns, trends and probabilities within your data. In this MS Excel tutorial from everyone's favorite Excel guru, YouTube's ExcelsFun, the 16th installment in his "Excel Statistics" series of free video lessons, you'll learn how to cross tabulate & do percentage cross tabulation for categorical data using a pivot table (PivotTable).
If you use Microsoft Excel on a regular basis, odds are you work with numbers. Put those numbers to work. Statistical analysis allows you to find patterns, trends and probabilities within your data. In this MS Excel tutorial from everyone's favorite Excel guru, YouTube's ExcelsFun, the 19th installment in his "Excel Statistics" series of free video lessons, you'll learn how to group categories in a frequency distribution with a formula (2 COUNTIF) and the pivot table (PivotTable) grouping fea...
If you use Microsoft Excel on a regular basis, odds are you work with numbers. Put those numbers to work. Statistical analysis allows you to find patterns, trends and probabilities within your data. In this MS Excel tutorial from everyone's favorite Excel guru, YouTube's ExcelsFun, the 17th installment in his "Excel Statistics" series of free video lessons, you'll learn how to cross tabulate & do percentage cross tabulation for categorical data using formulas rather than pivot tables.
If you use Microsoft Excel on a regular basis, odds are you work with numbers. Put those numbers to work. Statistical analysis allows you to find patterns, trends and probabilities within your data. In this MS Excel tutorial from everyone's favorite Excel guru, YouTube's ExcelsFun, the 3rd installment in his "Excel Statistics" series of free video lessons, you'll learn how to use Excel's sorting and pivot tables (PivotTables) data analysis tools.
If you use Microsoft Excel on a regular basis, odds are you work with numbers. Put those numbers to work. Statistical analysis allows you to find patterns, trends and probabilities within your data. In this MS Excel tutorial from everyone's favorite Excel guru, YouTube's ExcelsFun, the 35th installment in his "Excel Statistics" series of free video lessons, you'll learn how to calculate weighted and geometric means and see how to use the GEOMEAN function.
If you use Microsoft Excel on a regular basis, odds are you work with numbers. Put those numbers to work. Statistical analysis allows you to find patterns, trends and probabilities within your data. In this MS Excel tutorial from everyone's favorite Excel guru, YouTube's ExcelsFun, the 33rd installment in his "Excel Statistics" series of free video lessons, you'll learn how to use the AVEARGE, MEDIAN, MODE, PERCENTILE, QUARTILE and PERCENTILERANK functions to measure location.
If you use Microsoft Excel on a regular basis, odds are you work with numbers. Put those numbers to work. Statistical analysis allows you to find patterns, trends and probabilities within your data. In this MS Excel tutorial from everyone's favorite Excel guru, YouTube's ExcelsFun, the 4th installment in his "Excel Statistics" series of free video lessons, you'll learn how to create a frequency table and percentage frequency table using a Pivot Table (PivotTable).
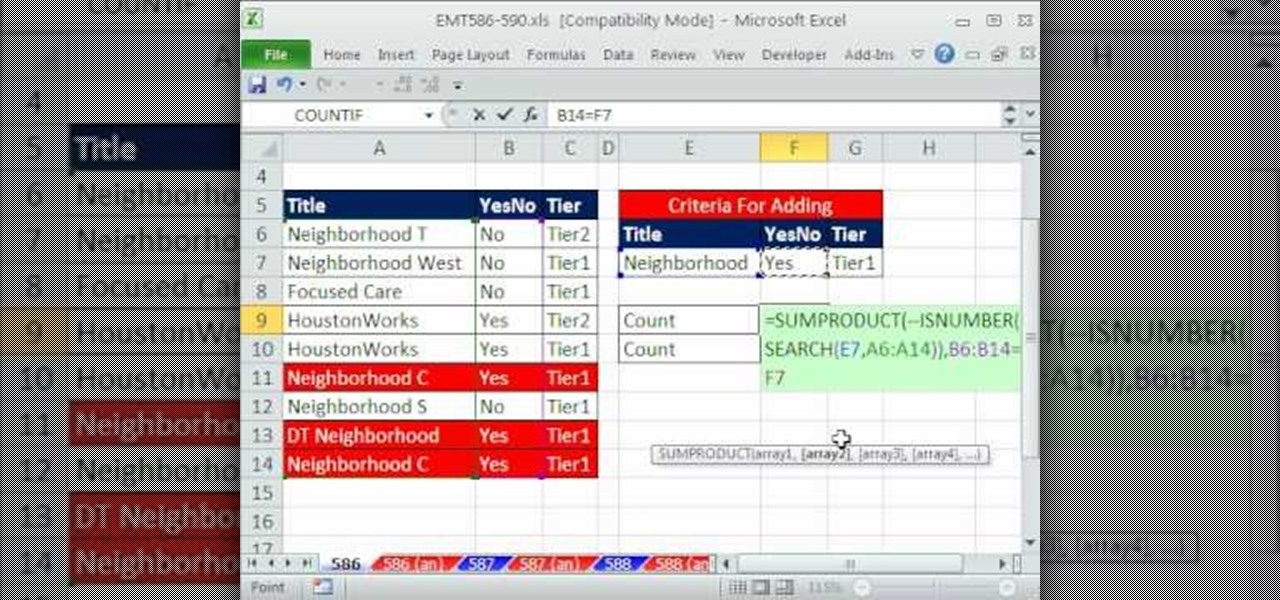
New to Microsoft Excel? Looking for a tip? How about a tip so mind-blowingly useful as to qualify as a magic trick? You're in luck. In this MS Excel tutorial from ExcelIsFun, the 586th installment in their series of digital spreadsheet magic tricks, you'll learn how to enumerate rows that meet 3 using the SEARCH function.
Not sure what to get mom for Mother's Day? Nobody could be disappointed with cake... especially an ice cream cake! In this cooking tutorial, learn how to make a beautiful flower pot ice cream cake thanks to a recipe and design thought up by Food Wishes.
Replay Music makes it possible to record audio from the web. No longer do you have to listen to streaming audio on the web and have to go back online to revisit your favorite moments. Replay Music enables you to download any audio streaming on the web straight to your computer so you can listen to it whenever you want.
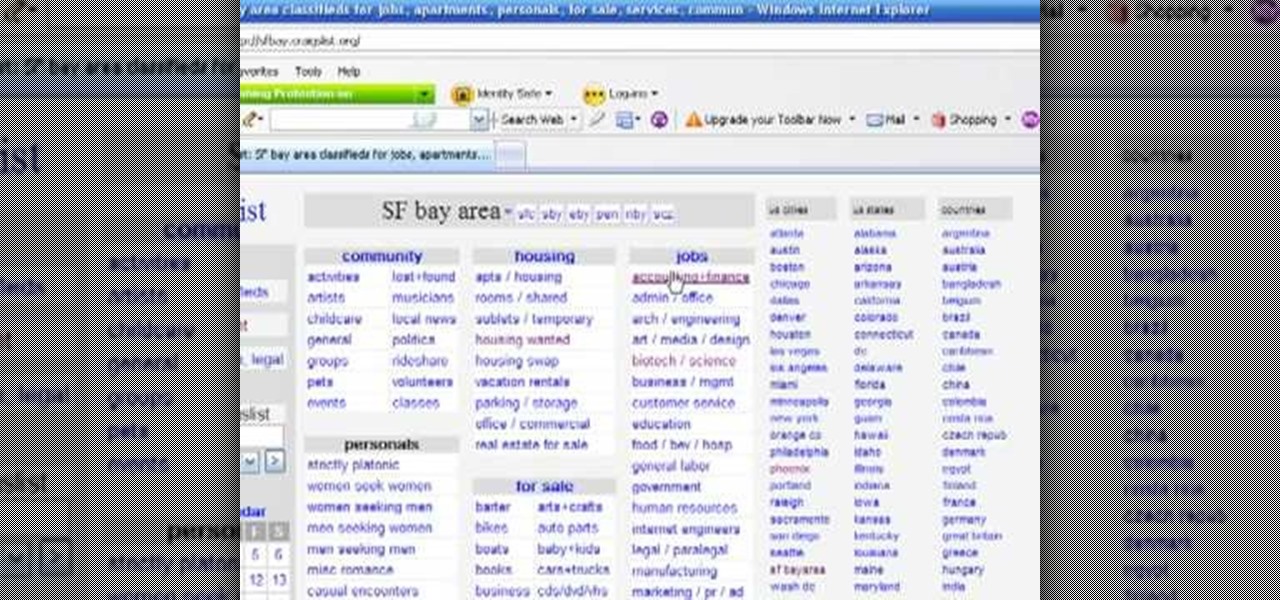
Sometimes searching Craigslist can be a real hassle if you're looking for something specific. You really have to sort your way through all the clutter in order to find whta you're looking for. If you are looking for email addresses of people who might fit your target market, you can scrape Criaglist for emails. This video will show you how.
Losing weight can be simple if you follow one rule: Cut calories! In this Ask Amy tutorial, your neighborhood nutritionist shows you how to cut back on the calories and lose the weight easily without feeling like you are sacrificing your favorites. Follow Amy's advice and you will be fitting into your jeans easier sooner than you think!
Whether you're new to Adobe's Creative Suite or a seasoned graphic design professional after a general overview of CS5's most vital new features, you're sure to be well served by this official video tutorial from the folks at Adobe TV. In it, Terry White discusses his five favorite features of the newest addition to Adobe's CS, Flash Catalyst, an application which allows you to create dynamic web pages without coding. Learn how to create dynamic scrolling content and functional Flash buttons ...
Whether you're new to Adobe Photoshop or a seasoned graphic arts professional after a general overview of CS5's most vital new features, you're sure to be well served by this official video tutorial from the folks at Adobe TV. In it, you'll join Terry White as he runs through his 5 favorite Photoshop CS5 features, including the new enhanced selection abilities and noise reduction tools.
Make-up artist/costume extraordinaire, Kandee Johnson amazingly recreates the look of the evil witch from 101 Dalmations, Cruella De Vil! In his tutorial, Kandee teaches an important skill in a lot of costume make-up application: how to erase your eyebrows.
Make-up artist, Kandee Johnson takes us through, step-by-step, how to transform our faces into traditional geisha girls with the application of make-up! Super fun!
In this step-by-step tutorial, watch as the talented make-up & hair extraordinaire, Kandee Johnson recreates the make-up and famous eye of Egyptian princess Cleopatra!
In this how-to, watch as remarkable make-up artist, Kandee Johnson shows how to apply makeup to steal the creepy Joker look from Batman! Specifically, Heath Ledger's look as the role of Joker in the recent Batman re-make "The Dark Knight."
Make-up artist, Kandee Johnson transforms herself into the King of Pop, Michael Jackson! With just some shading and contouring, watch as Kandee remarkably alters the shape of her face with the illusion of makeup!
Make-up artist, Kandee Johnson transforms into an Oompa Loompa from the beloved classic film, Charlie and the Chocolate Factory! To get the orange glowing face, Kandee uses Make-Up Forever's Flash palette.
Watch this science video tutorial from Nurd Rage on how to find chemicals for science experiments with Dr. Lithium.
Mark Crilley demonstrates how to draw wings. Mark Crilley is one of the best anime drawing instructors on the web. Search Mark Crilley on WonderHowTo for more videos from this master.