
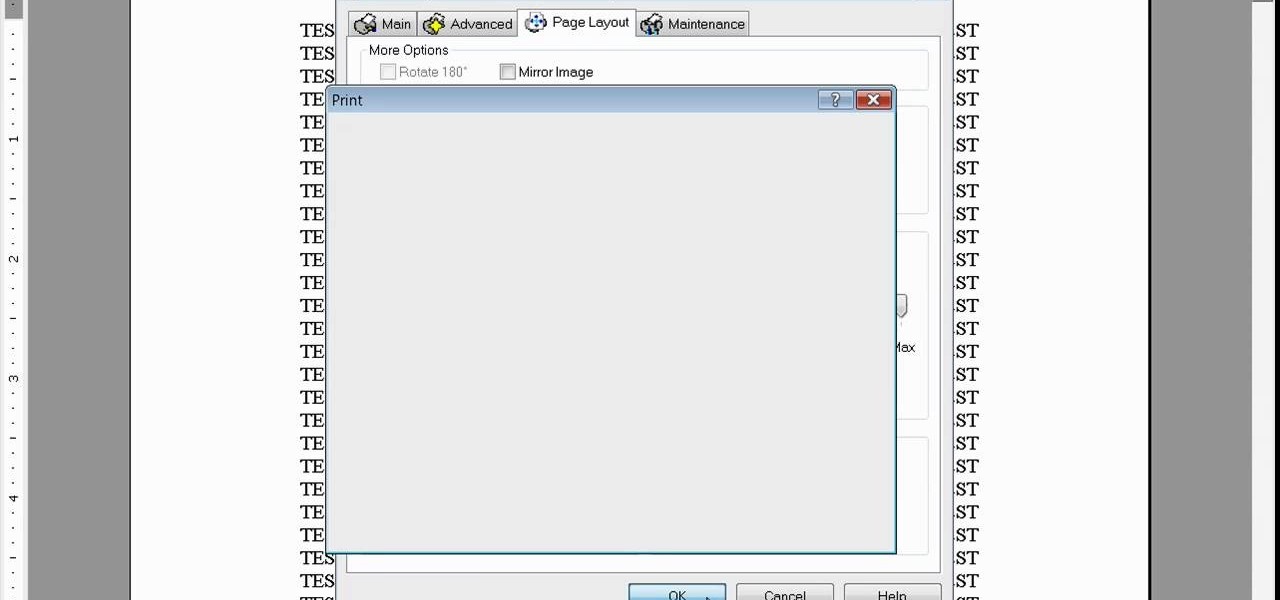
How To: Print double-sided and reverse printing order in Word
Learn how to print double-sided and reverse printing order in Microsoft Word. * Go to the Start menu and open Microsoft Word.

Learn how to print double-sided and reverse printing order in Microsoft Word. * Go to the Start menu and open Microsoft Word.

Living within your means can be done. You don't want to be a slave to the credit card company, do you? Learn what to do to stay out of credit card debt. This how to video will give you the tips. Credit card debt is a slippery slope.
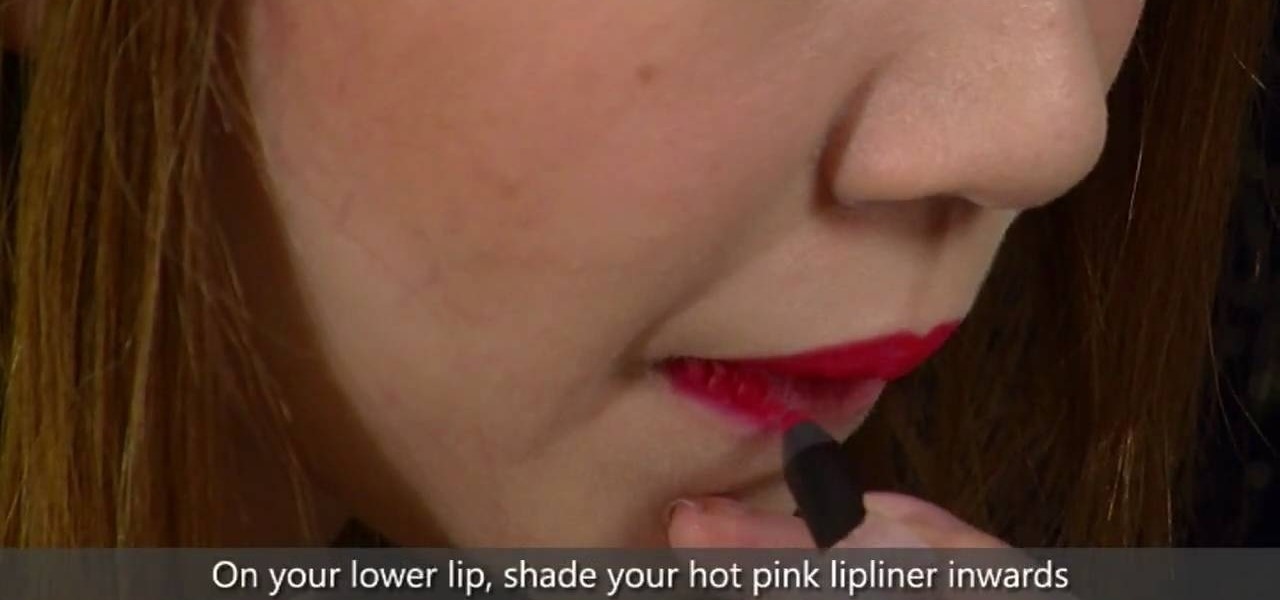
During the Fall 2010 runway shows there were a bunch of crazy makeup looks, but perhaps the most unique look was the two-tone lipstick worn by models on the Nanette Lepore catwalk.
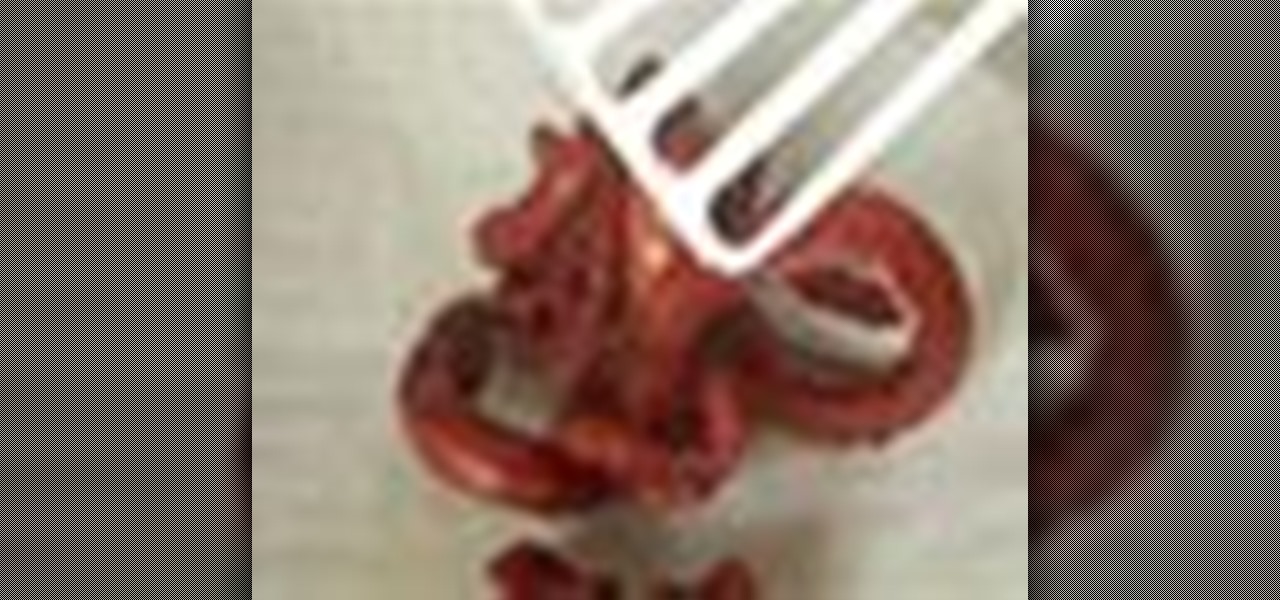
These hot dog cutting projects are the perfect "crafts" to practice on a rainy day. From making spiny hot dog balls to an octopus with funny curled tentacles, these hot dog projects are a delight to make and to eat, since you'll be deep frying them.
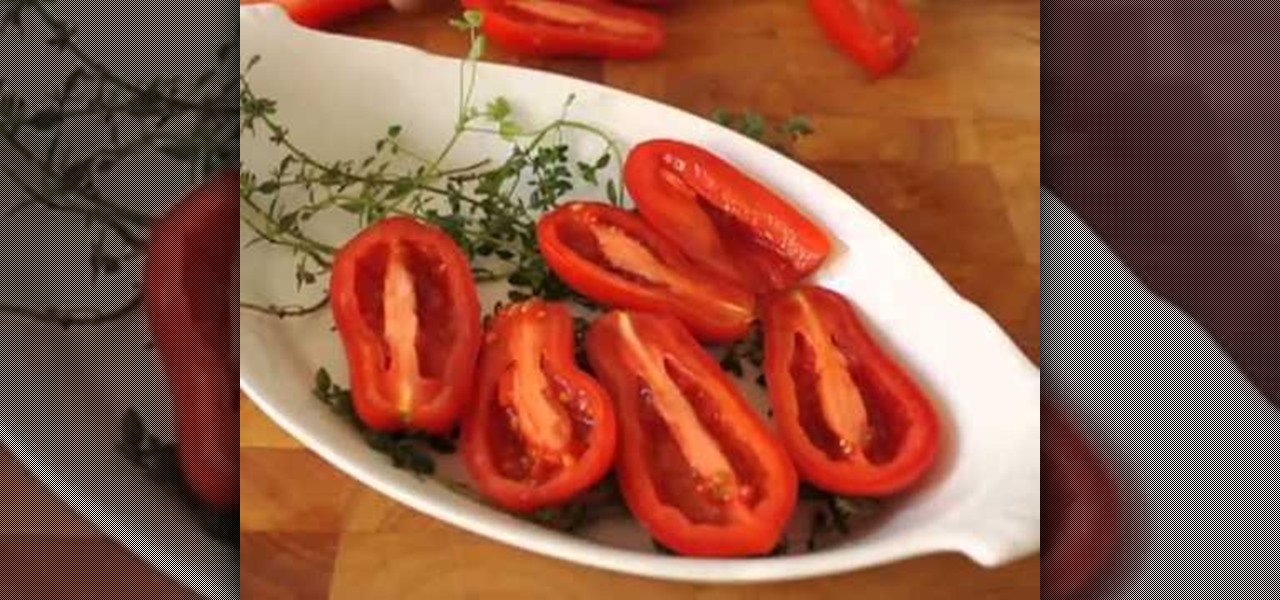
We always cringe when we see that a recipe calls for sundried tomatoes. Not that we have anything against tomatoes, but the sundried and preserved kind is all wrinkly, odd tasting, and too sterile. These oven-dried tomatoes, however, are incredibly delicious.
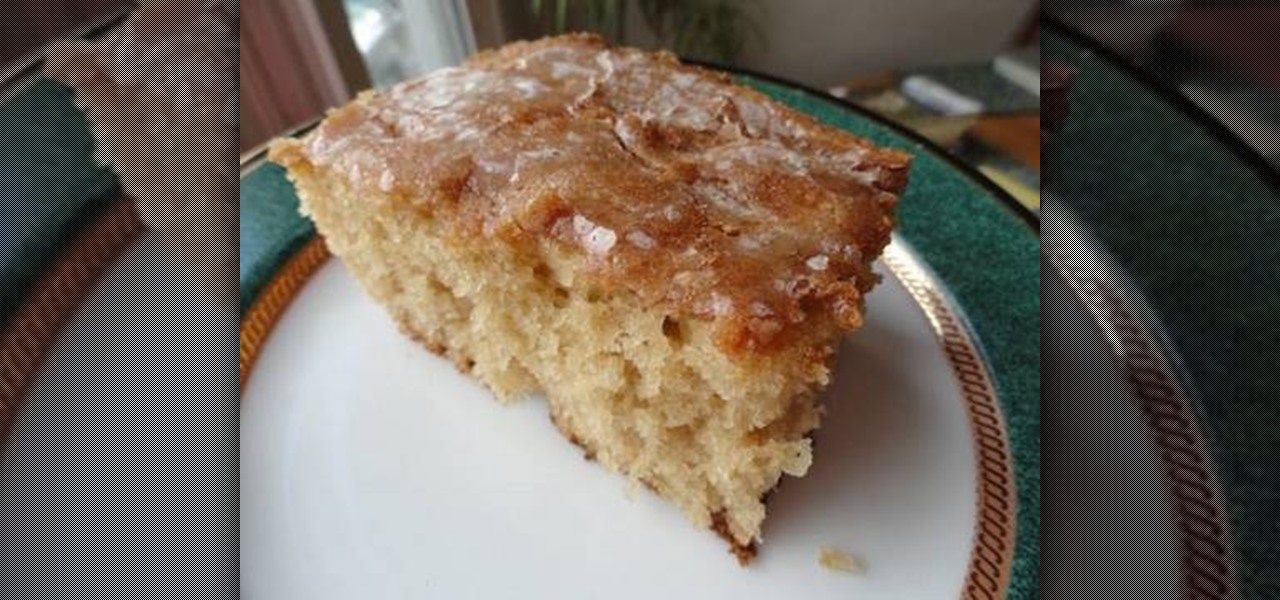
Root beer has a bunch of yummy functions, though usually they involve ice cream sodas. But there's more than just one way to enjoy this delicious carbonated drink. It may seem odd at first, but you can actually use root bear to create a glaze for cakes.
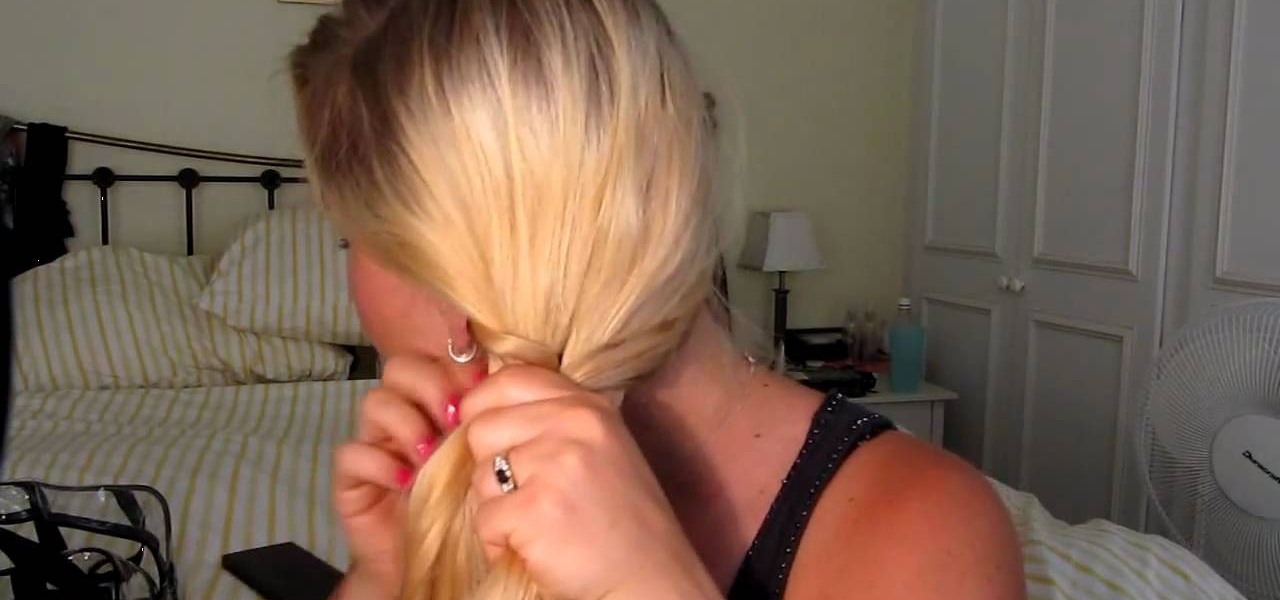
It's pretty odd that summer's hottest braided hairstyles are modeled after fish tails, given that fish don't possess much hair of their own. Either way, the fishtail braid/plait is a sexy look for everyone, especially adult women who want to wear braids without looking like Pippi Longstocking.
Having a congo drum there for those impromptu African dance groove sessions at your pad is a smart idea, but authentic drums are quite costly.
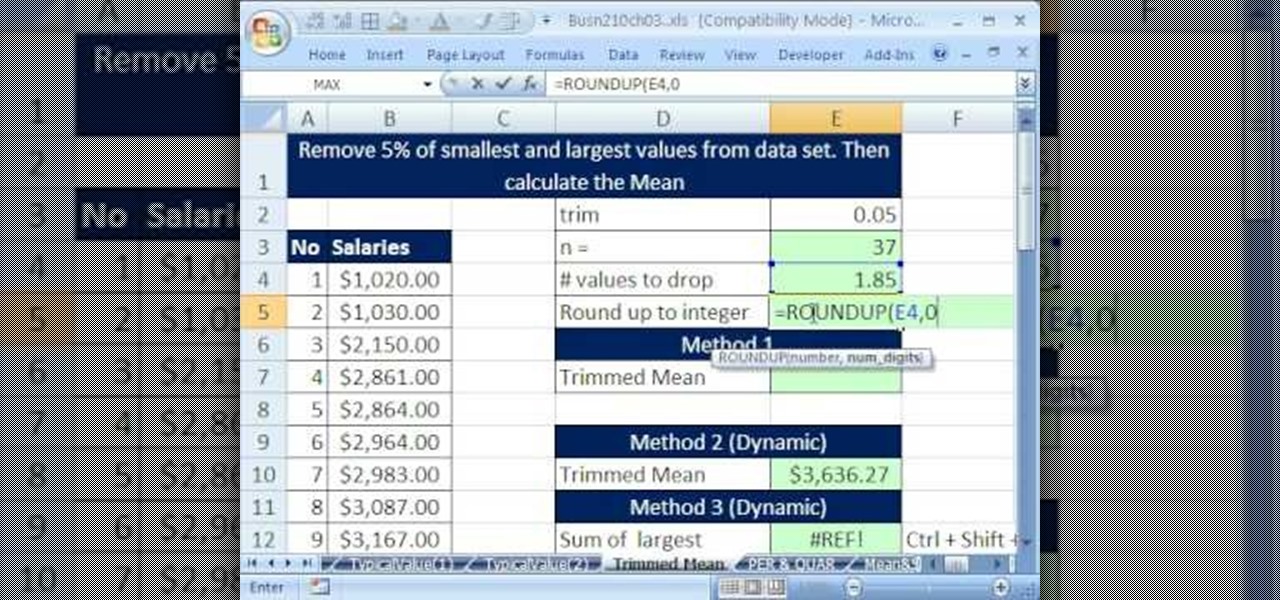
If you use Microsoft Excel on a regular basis, odds are you work with numbers. Put those numbers to work. Statistical analysis allows you to find patterns, trends and probabilities within your data. In this MS Excel tutorial from everyone's favorite Excel guru, YouTube's ExcelsFun, the 36th installment in his "Excel Statistics" series of free video lessons, you'll learn how to calculate a trimmed mean, which is used when there are extreme values in the data set that might skew the mean.

If you use Microsoft Excel on a regular basis, odds are you work with numbers. Put those numbers to work. Statistical analysis allows you to find patterns, trends and probabilities within your data. In this MS Excel tutorial from everyone's favorite Excel guru, YouTube's ExcelsFun, the 39th installment in his "Excel Statistics" series of free video lessons, you'll learn about variability (or dispersion or spread). Create an X-Y Scatter Diagram chart showing data points and the mean.
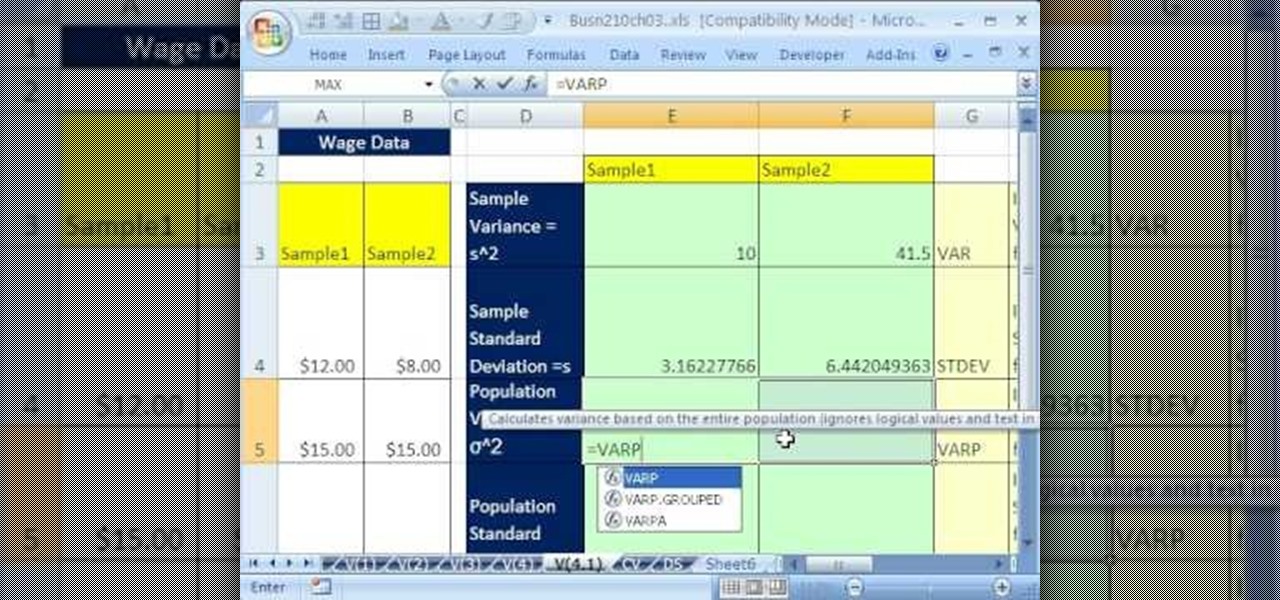
If you use Microsoft Excel on a regular basis, odds are you work with numbers. Put those numbers to work. Statistical analysis allows you to find patterns, trends and probabilities within your data. In this MS Excel tutorial from everyone's favorite Excel guru, YouTube's ExcelsFun, the 41st installment in his "Excel Statistics" series of free video lessons, you'll learn how to calculate deviations, variance and standard deviation for a sample and a population using Excel tables and the VAR, S...

If you use Microsoft Excel on a regular basis, odds are you work with numbers. Put those numbers to work. Statistical analysis allows you to find patterns, trends and probabilities within your data. In this MS Excel tutorial from everyone's favorite Excel guru, YouTube's ExcelsFun, the 32nd installment in his "Excel Statistics" series of free video lessons, you'll learn how to group when the quantitative data are whole numbers, integers or discrete data and how to group when the quantitative ...
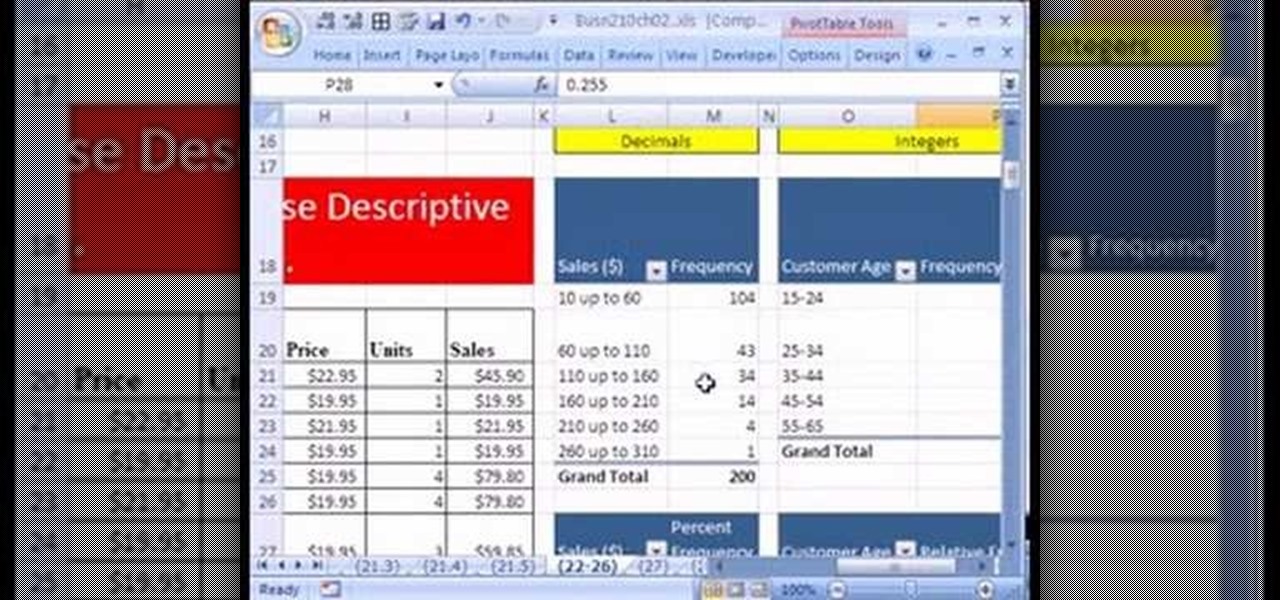
If you use Microsoft Excel on a regular basis, odds are you work with numbers. Put those numbers to work. Statistical analysis allows you to find patterns, trends and probabilities within your data. In this MS Excel tutorial from everyone's favorite Excel guru, YouTube's ExcelsFun, the 25th installment in his "Excel Statistics" series of free video lessons, you'll learn how to create quantitative data percent & relative frequency distributions with pivot tables. Also see how to create a histo...

If you use Microsoft Excel on a regular basis, odds are you work with numbers. Put those numbers to work. Statistical analysis allows you to find patterns, trends and probabilities within your data. In this MS Excel tutorial from everyone's favorite Excel guru, YouTube's ExcelsFun, the 22nd installment in his "Excel Statistics" series of free video lessons, you'll learn how to create a percent (%) cumulative frequency distribution with formulas, a histogram and an ogive chart. See how to add ...
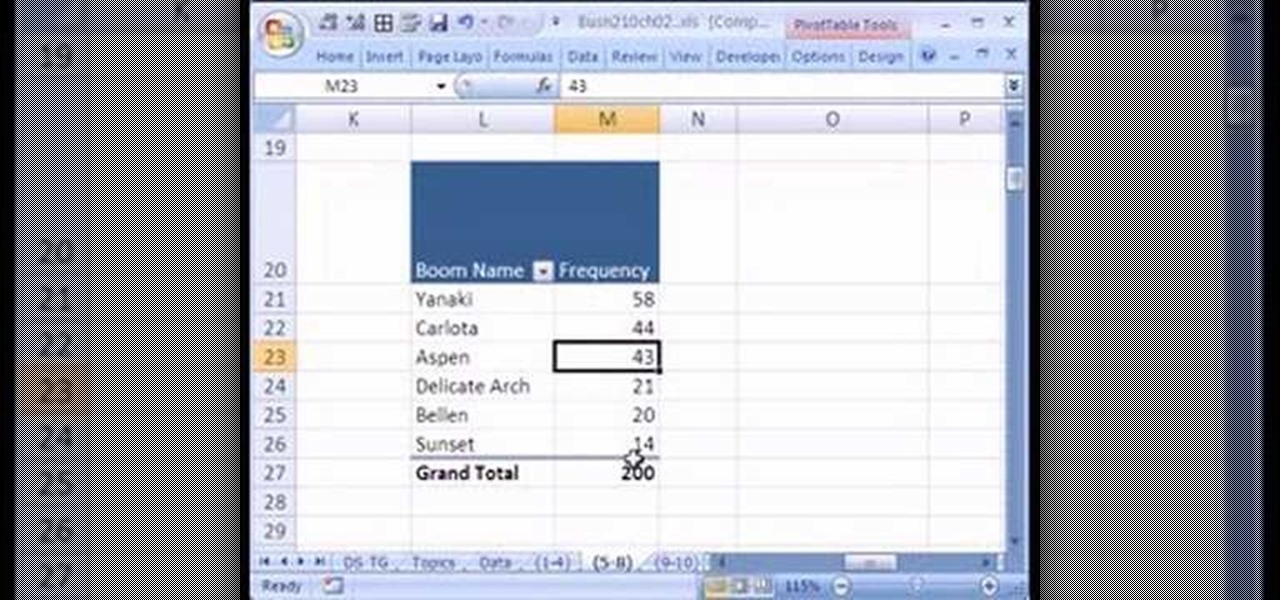
If you use Microsoft Excel on a regular basis, odds are you work with numbers. Put those numbers to work. Statistical analysis allows you to find patterns, trends and probabilities within your data. In this MS Excel tutorial from everyone's favorite Excel guru, YouTube's ExcelsFun, the 15th installment in his "Excel Statistics" series of free video lessons, you'll learn how to use create a frequency distribution, relative frequency distribution, percent frequency distribution and pie chart wi...

If you use Microsoft Excel on a regular basis, odds are you work with numbers. Put those numbers to work. Statistical analysis allows you to find patterns, trends and probabilities within your data. In this MS Excel tutorial from everyone's favorite Excel guru, YouTube's ExcelsFun, the 10th installment in his "Excel Statistics" series of free video lessons, you'll learn how about data sets and the nominal, ordinal, interval and ration scales/levels of measurement and see two Pivot Tables that...
The odds are that you'll never find yourself being held prisoner with your hands bound together with zip ties. But if you ever are, you'll be very grateful for the info you learned from this video. In this tutorial from the folks at ITS Tactical, you'll learn how to escape from zip ties using shims. You can use all sorts of things for shimming, from professional equipment to your own fingernails.

See how to avoid rejection on the singles scene! When it comes to putting the moves on someone, no one can make themselves rejection-proof. But you can increase the odds of a good outcome.
Turn mealtime odds and ends into a hearty—and tasty—soup. This is a cost efficient way to prepare a yummy meal.

Need to spruce up (or wreath up) your trailer for the holidays? For this Christmas in your trailer park, let Jolene Sugarbaker show you how to make a classic trailer park Christmas craft... the wreath. This video will show you how to turn ordinary dryer sheets into a festive holiday wreath.
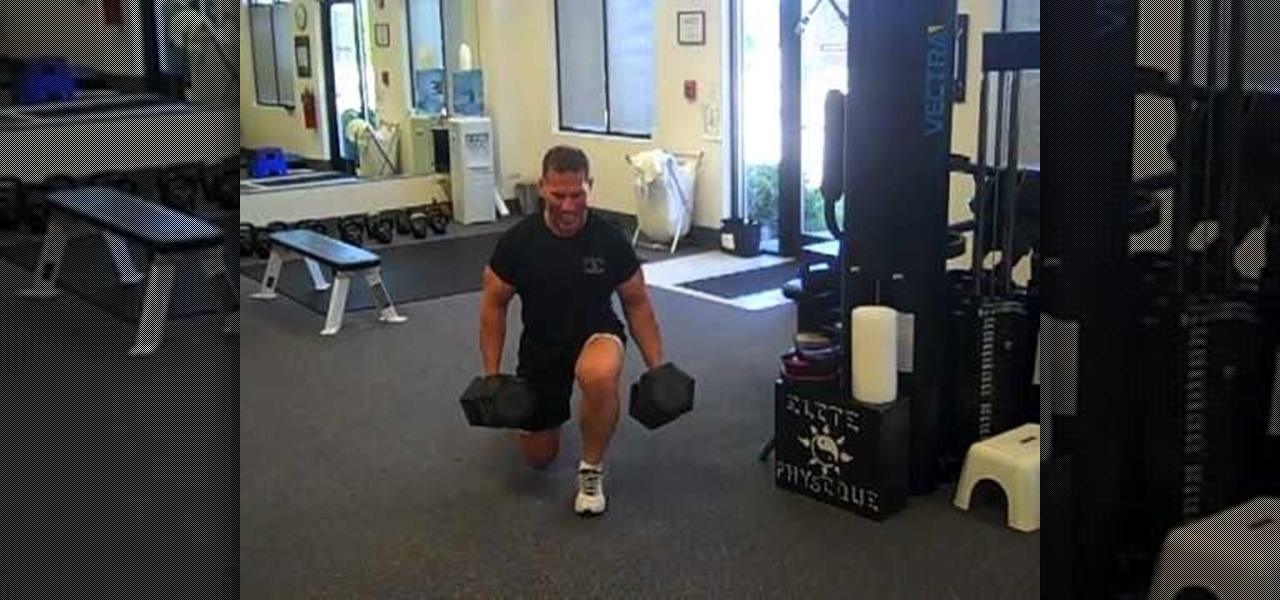
Want buff, fat-free legs that would put the Incredible Hulk to shame? Then lunges are your new best friend. While basic lunges work and are great for sculpting your entire leg, adding weights makes you work your core out more and causes your quads to really strain to get yourself up.
In this tutorial, we learn how to stop being a hypochondriac naturally. Your first step is to put your worry down, and take control of your life. Know that the chance of you catching a disease is small, and you have a full life to live. Ignore your anxieties, fall back to the principles that you are healthy, and live a healthy life. The odds will be in your favor if you take it slow and focus on living a healthy life instead of focusing on the problems and negative thoughts. Don't look up sym...

You've probably seen old t-shirts being turned into dresses, miniskirts, and if you're a fan of Gianny L, even two-piece bikinis, but you've probably never even thought about it transforming them into underwear. It may seem a bit odd at first, but making these intimate pieces from t-shirts means you can customize the pattern as well as the type of cut (cheeky, granny top, or thong?).

Seriously gals, how easy is this? Unless you're a bum living in a box under a bridge, you can probably muster up the simple tools needed to make this makeup organizer. All you need is Elmer's household cement and six office stamper covers.
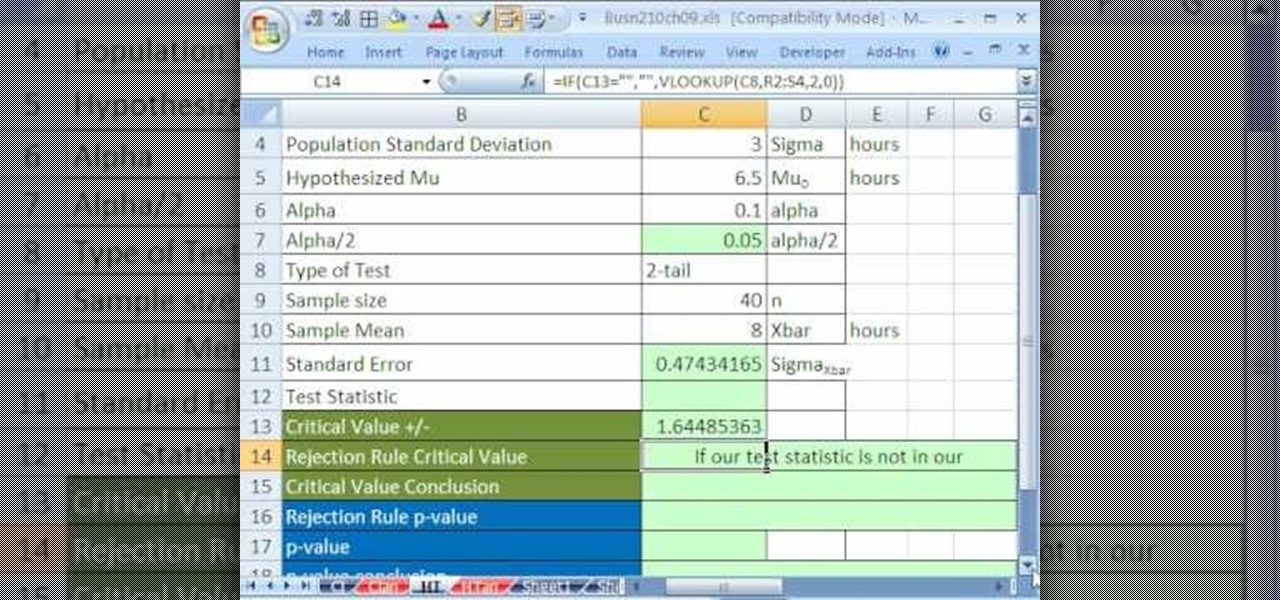
If you use Microsoft Excel on a regular basis, odds are you work with numbers. Put those numbers to work. Statistical analysis allows you to find patterns, trends and probabilities within your data. In this MS Excel tutorial from everyone's favorite Excel guru, YouTube's ExcelsFun, the 47th installment in his "Excel Statistics" series of free video lessons, you'll learn how to use the NORMSINV function for critical values and the NORSDIST function for p-values. Compare building confidence int...
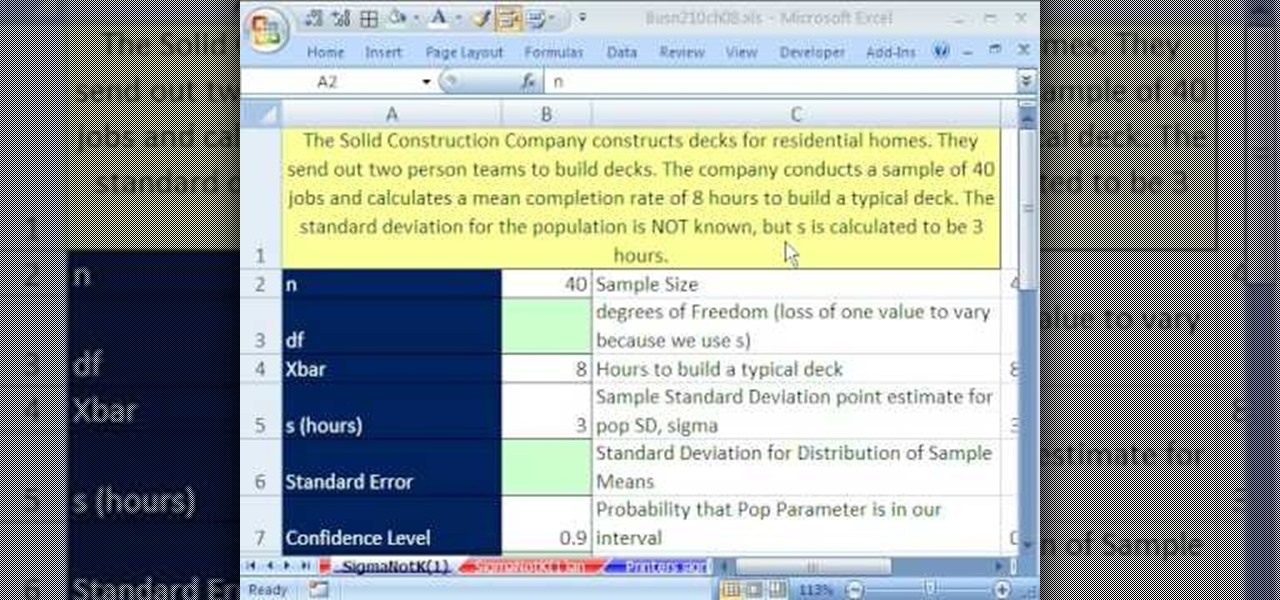
If you use Microsoft Excel on a regular basis, odds are you work with numbers. Put those numbers to work. Statistical analysis allows you to find patterns, trends and probabilities within your data. In this MS Excel tutorial from everyone's favorite Excel guru, YouTube's ExcelsFun, the 82nd installment in his "Excel Statistics" series of free video lessons, you'll learn how to construct confidence intervals when the sigma value (the population's standard deviation) in NOT Known using the TINV...

If you use Microsoft Excel on a regular basis, odds are you work with numbers. Put those numbers to work. Statistical analysis allows you to find patterns, trends and probabilities within your data. In this MS Excel tutorial from everyone's favorite Excel guru, YouTube's ExcelsFun, the very first installment in his "Excel Statistics" series of free video lessons, you'll learn how to get started doing statistical analysis in Microsoft Excel 2007.
If you think that card counting is only a thing in the movies then think again. You too can try a couple of methods to help you count cards. Like anything, the more you work on it the better you will be.
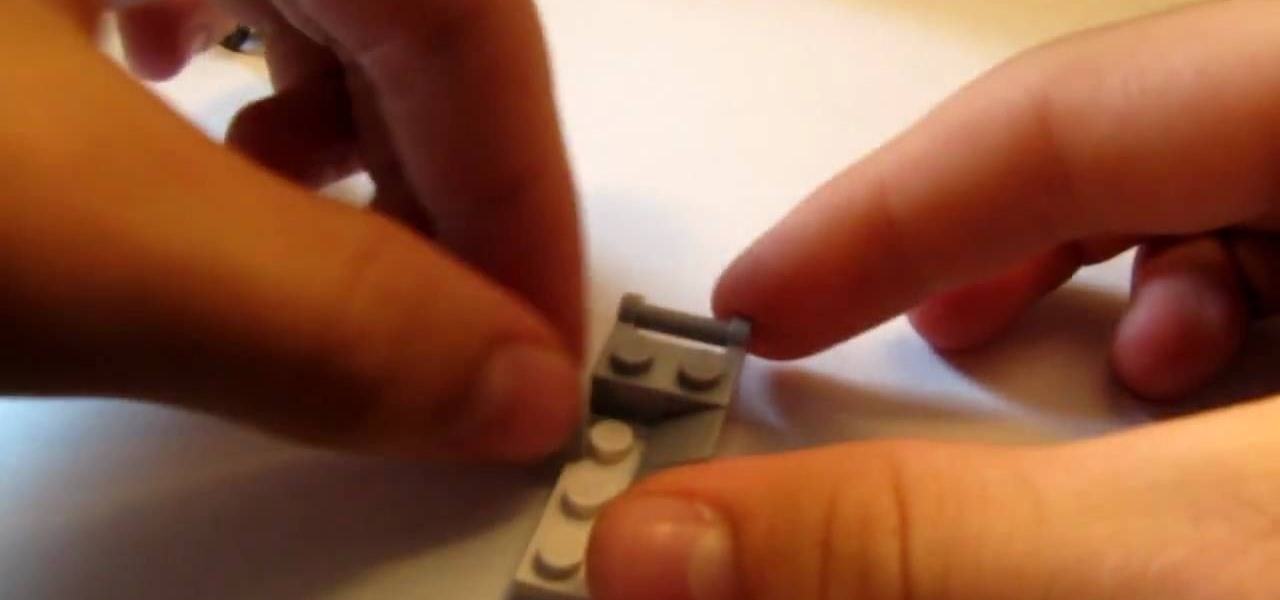
In this video you will learn how to build a LEGO stroller. The materials you will need are 4 of the small slanted bricks, one two by four thin brick, 3 two by 1 thick bricks, 2 one by one thin bricks, 2 one by one by four studded bricks, a small smooth brick, two odd angled smoothed bricks, 4 wheels, one one by two with dot in center bricks, and one one by two handle bricks. Then after carefully assembling the bricks as shown he will show you a example of what it will look like when you're fi...

Boost your odds of having a baby with these 10 tested tips. Learn how to increase your chances of getting pregnant with this informative video.

The first video explains the Method of Mathematical Induction. It also gives a background of Francesco Maurolico, Pascal and John Wallis. You'll see how to apply the Method of Induction to prove the sum of odd numbers is a square.
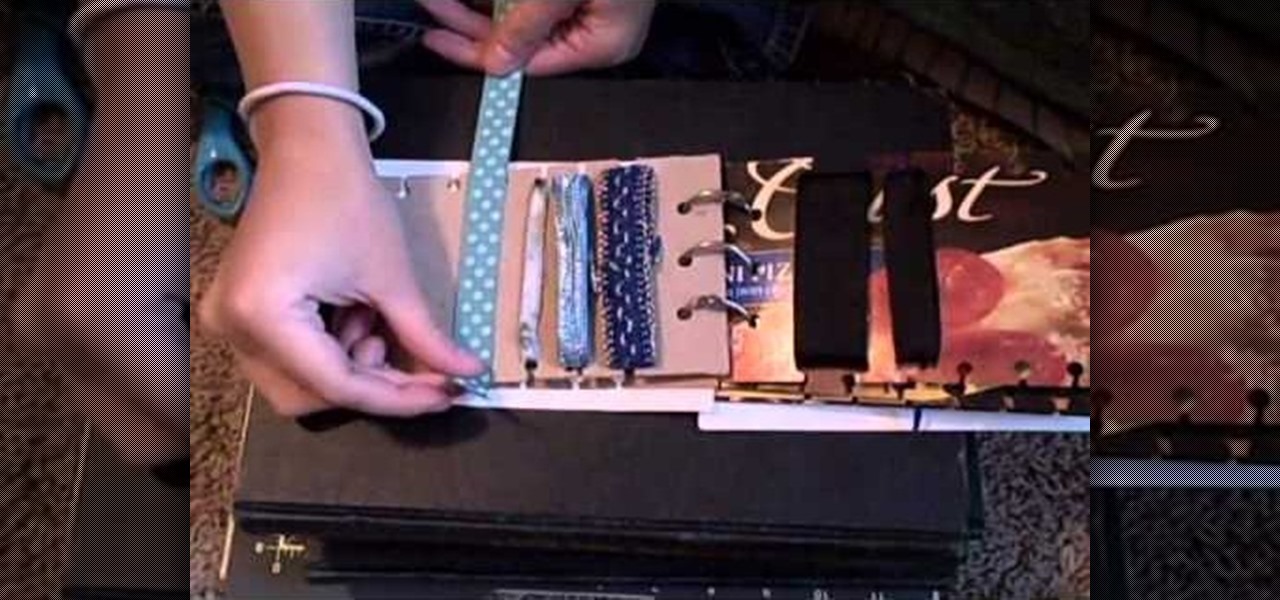
If you're an arts and crafts fanatic then you probably have more than your fair share of ribbons lying all around the house. You snip off one long piece from the roll and then you have to go and tape it to itself again to keep everything in place, and then eventually you give up and the remaining ribbon ends up in an odds-and-ends jar.

Still baking your turkey all traditional-like in the oven? Why not try a new way of serving turkey this year for Thanksgiving that doesn't even involve the oven? It may sound odd and even a bit difficult, but deep frying a turkey is one of the best ways to eat a turkey.

What would "Star Wars" be without its infamous red-faced villain, Darth Maul? True, we never thought he was the prettiest character in the "Star Wars" franchise (that title still goes to hottie Natalie Portman as Princess Amidala), but he had some pretty cool makeup going on.

Lady Gaga is truly the queen of outrageous, outre makeup looks, so unique that the only person capable of upstaging her previous looks is herself. In her unforgettable music video for "Bad Romance" she reinvents her look many times, going from odd party hostess to insane asylum babe to monster dancer to glittery hooker to a girl seducing a guy in a bear cape.
In Japan, kanzashi are hair ornaments, often in a floral or jeweled style, which adorn traditional female Japanese hairstyles. These are gorgeous long pins with a special adornment attached at the end.
Getting the perfect shot is difficult, so when you finally get that perfect picture of yourself, you want to enhance it as much as possible. But if this perfect picture took place in a humdrum location like the bathroom or your living room and you want to glorify your face even more by surrounding it with, say, an island paradise, you can transplant your head (and body) using Photoshop.

At first glance, this drawing looks like nothing special, just an odd design of lines, but then you notice the two bolded lines. They look like they are different sizes, but are they? No! They are the exact same length. Tricky… very tricky.
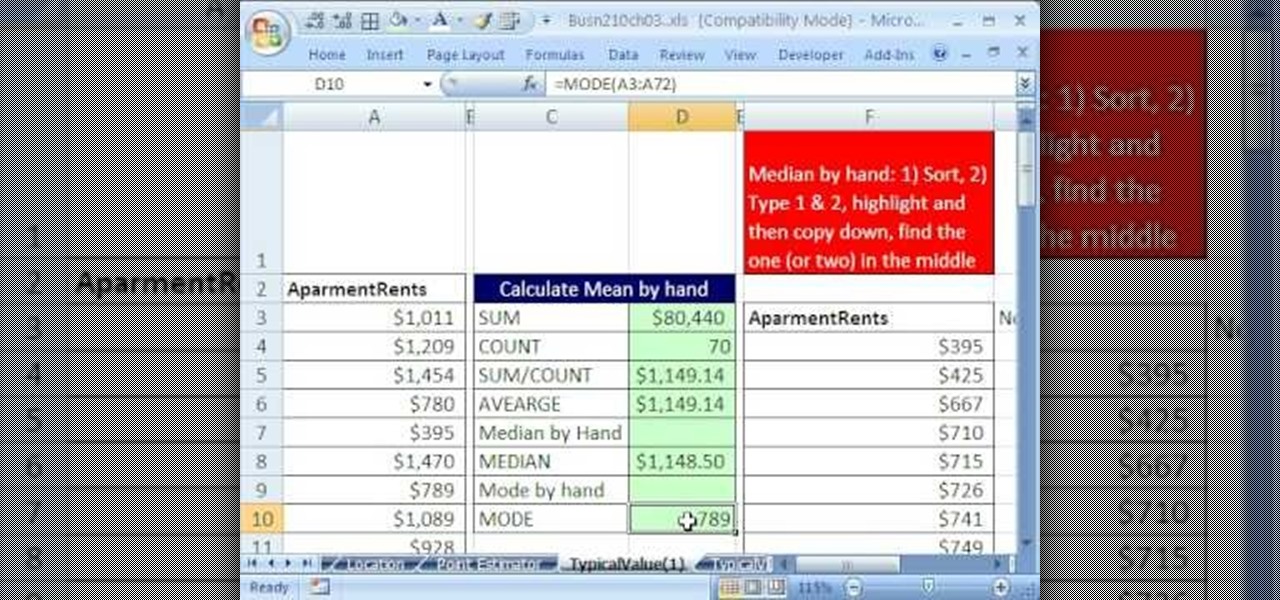
If you use Microsoft Excel on a regular basis, odds are you work with numbers. Put those numbers to work. Statistical analysis allows you to find patterns, trends and probabilities within your data. In this MS Excel tutorial from everyone's favorite Excel guru, YouTube's ExcelsFun, the 34th installment in his "Excel Statistics" series of free video lessons, you'll learn how to use MEAN, MEDIAN, MODE. These measures give us a typical value, a measure of central tendency one value that can repr...
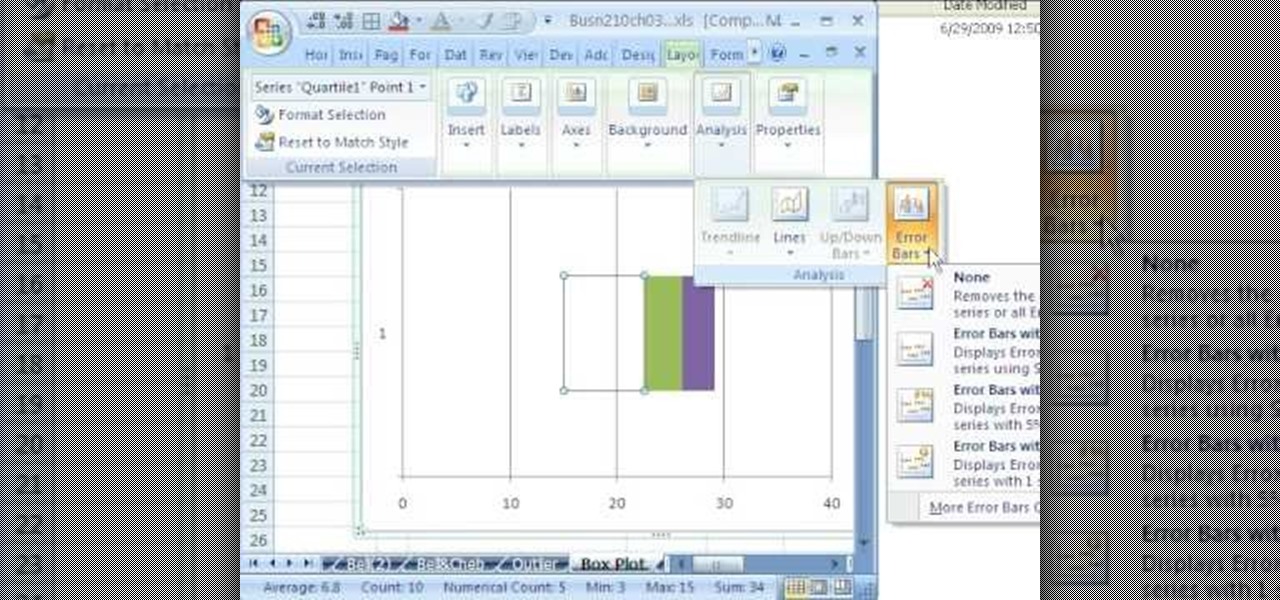
If you use Microsoft Excel on a regular basis, odds are you work with numbers. Put those numbers to work. Statistical analysis allows you to find patterns, trends and probabilities within your data. In this MS Excel tutorial from everyone's favorite Excel guru, YouTube's ExcelsFun, the 49th installment in his "Excel Statistics" series of free video lessons, you'll learn how to find outliers with the +/- 3 Z-score rule and the ABS function. See how to do a box plot by hand and in Excel. For th...