Every once in a while you're going to run into an odd meter song, and one of the most common is 7/8 (7 eighth notes per measure). If you listen to a lot of Frank Zappa then odd meter is nothing new to you. If you're not familiar with odd timing, or are having trouble lining up, this amazing guitar lesson from Ross Bolton, an instructor at Musician's Institute, can help you out. In this video you will learn how to count 7/8 meter as well as play it and apply it to funk guitar.
Learn how to bake a delicious pecan pie topped with fresh whipped cream in this cooking video. This pecan pie recipe is brought to you by Chef Frank Brigtsen on How2Heroes. Search How2Heroes on WonderHowTo for more cooking videos.

If your opponent in a martial arts match has pinned you on the bottom, you can use a special technique to escape. Frank Mir, a champion of Brazilian jiu jitsu, demonstrates the way to use an arm post to get out of the pin. Move your opponent over your center line and use your elbows to escape.

Unlock the "Closer Analysis: Hidden Intel" trophy in Call of Duty: Black Ops! This achievement is won by finding the hidden intelligence documents in Missions 1, 2 & 4.

Whether you're interested in learning Microsoft Excel from the bottom up or just looking to pick up a few tips and tricks, you've come to the right place. In this tutorial from everyone's favorite digital spreadsheet guru, ExcelIsFun, the nth installment in his "Highline Excel Class" series of free video Excel lessons, you'll learn how to do basic statistical analysis in Excel. Specifically, this video covers the following topics:
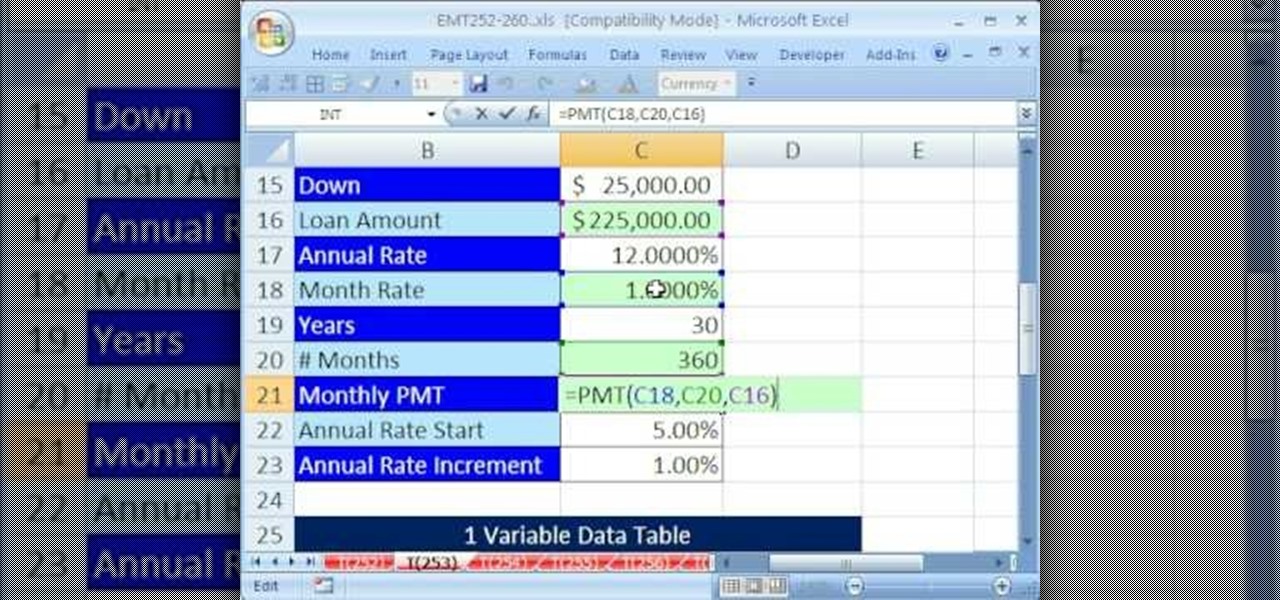
New to Microsoft Excel? Looking for a tip? How about a tip so mind-blowingly useful as to qualify as a magic trick? You're in luck. In this MS Excel tutorial from ExcelIsFun, the 253rd installment in their series of digital spreadsheet magic tricks, you'll learn how to use a data table for what-if analysis. You'll also learn about the PMT and see the formula equivalent to a data table.

In this scientific video tutorial, undergraduate students in a forensic chemistry lab demonstrate how to perform gunshot residue analysis (GSR). Learn how to perform gun shot residue analysis (GSR)! Just like in CSI.
Dr. Keith Johnson shows how to correctly sample a large round bale for forage analysis Learn how to determine the nutritional content of the livestock feed to make sure that the dietetic needs of the farm animals being fed are being met.
Matt covers some lines with a black ...Bg4. He found the first game with analysis on the Kenilworth Chess Club site. Most of the analysis he gave for this game is taken verbatim, but he does mention a couple side variations that you should be curious about. So watch!
"Buy low and sell high" is great advice, but how do you accomplish it? While the stock market can be unpredictable, it's not a complete enigma. There are patterns to watch for that can make you a successful trader.
If you're reading this, you're likely a tech-savvy coding pro whose analytical talents are mostly applied to designing apps, cracking passwords, and infiltrating networks — all of which are admirable activities for both aspiring and seasoned white hat hackers. But there are other profitable ways that you can put these types of skills to use, namely in the world of investment and trading.
We all know how volatile the stock market is, especially during times of crisis. That does not mean that the market is impossible to gauge, however. Day traders are trained to read charts in order to recognize market trends and price patterns, giving them the insight they need to make their trades as profitable as possible.
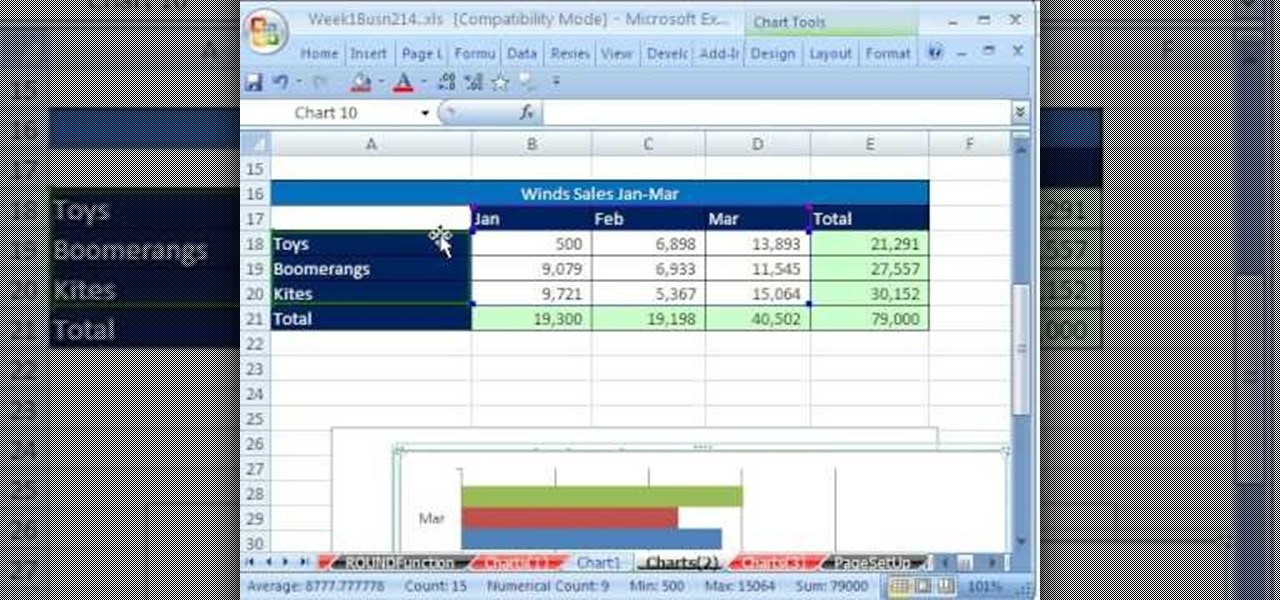
Whether you're interested in learning Microsoft Excel from the bottom up or just looking to pick up a few tips and tricks, you're in the right place. In this tutorial from everyone's favorite digital spreadsheet guru, ExcelIsFun, the 5th installment in his "Highline Excel Class" series of free video Excel lessons, you'll learn how to create seven types of charts — X-Y scatter diagrams, pie charts, column charts, bar charts, stacked bar charts, line charts, and column and line chart combined. ...
If you use Microsoft Excel on a regular basis, odds are you work with numbers. Put those numbers to work. Statistical analysis allows you to find patterns, trends and probabilities within your data. In this MS Excel tutorial from everyone's favorite Excel guru, YouTube's ExcelsFun, the very first installment in his "Excel Statistics" series of free video lessons, you'll learn how to get started doing statistical analysis in Microsoft Excel 2007.
This how-to video is about how to enable the commenting tools in the free Adobe Reader using Acrobat 9 Pro and Acrobat 9 Pro Extended.
Coco Chanel once said that fashion fades but style is eternal. So even with Lady Gaga's new single "Born This Way" catching fire and Britney Spears in the midst of her pop comeback, time and time again we still go back to perennial favorites like Miles Davis, Frank Sinatra, and Charlie Brown tunes.
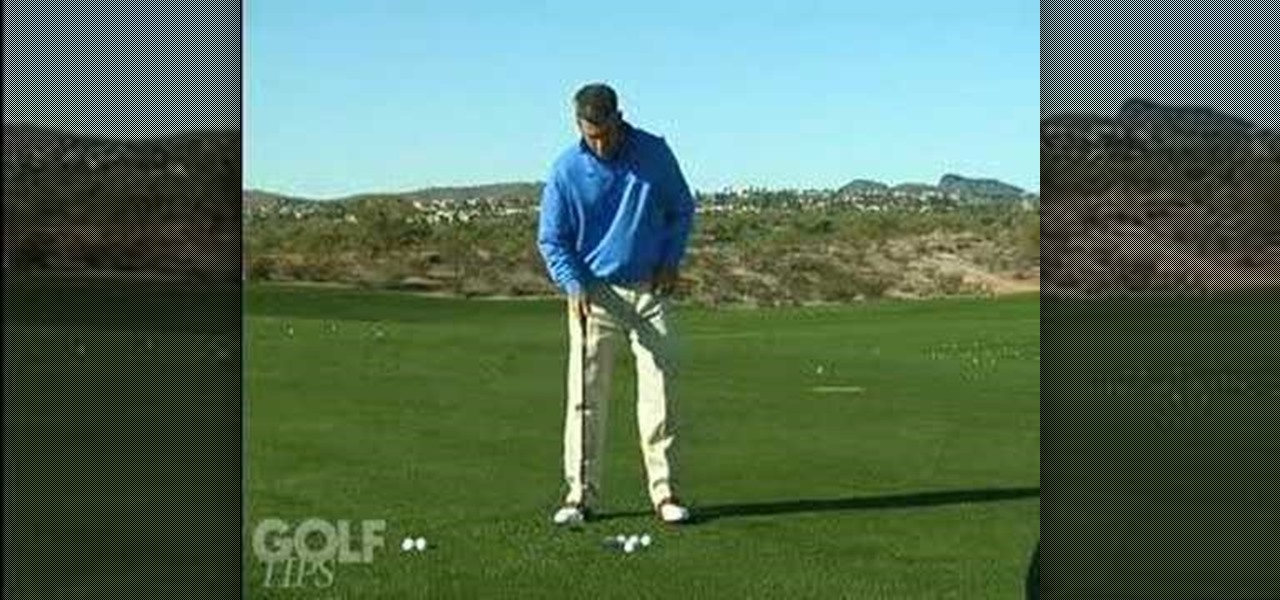
If you have some hybrid golf clubs, then you need to know exactly where to place the ball for correct contact. Learn to make solid contact with your hybrids by mastering ball position. Frank O'Connell shows us the proper stance and position for hitting hybrids.
Leave it to some lazy college kids to attempt to figure out a way to brew a pot of coffee without leaving the couch.
Unlock the "Closer Analysis: Hidden Intel" trophy in Call of Duty: Black Ops! This achievement is won by finding the hidden intelligence documents in Missions 11, 12 & 13.
Unlock the third "Closer Analysis: Hidden Intel" trophy in Call of Duty: Black Ops! This achievement is won by finding the hidden intelligence documents in Missions 14 & 15.
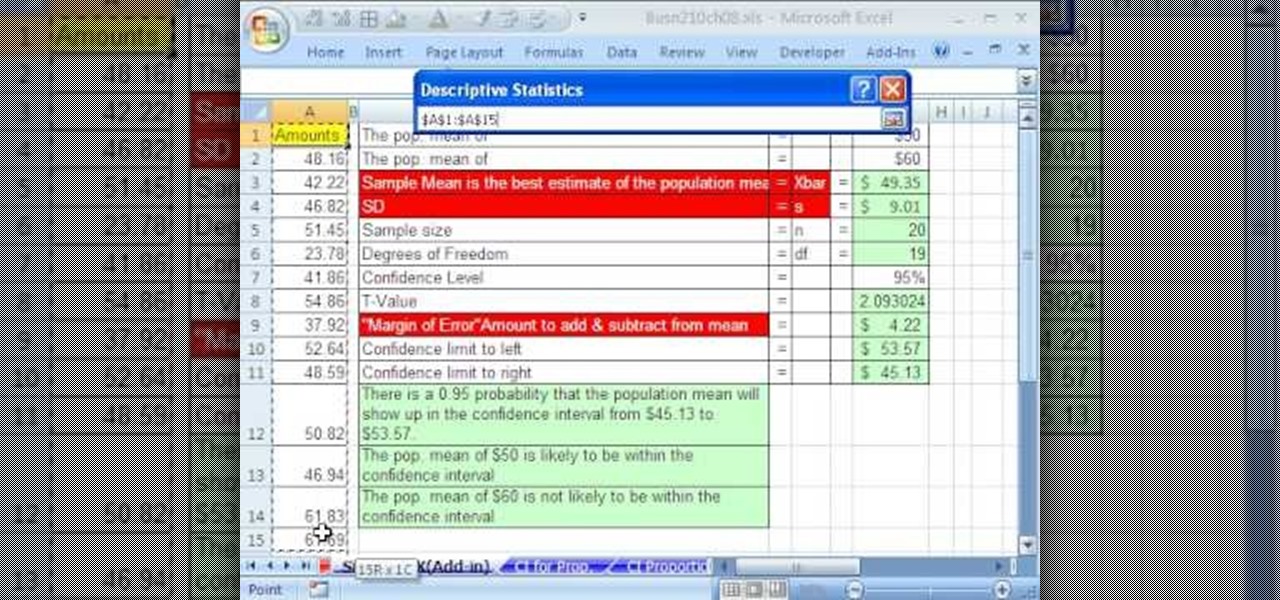
If you use Microsoft Excel on a regular basis, odds are you work with numbers. Put those numbers to work. Statistical analysis allows you to find patterns, trends and probabilities within your data. In this MS Excel tutorial from everyone's favorite Excel guru, YouTube's ExcelsFun, the 84th installment in his "Excel Statistics" series of free video lessons, you'll learn how to construct confidence intervals when the sigma is NOT known using the Descriptive Statistics data analysis add-in.
If you use Microsoft Excel on a regular basis, odds are you work with numbers. Put those numbers to work. Statistical analysis allows you to find patterns, trends and probabilities within your data. In this MS Excel tutorial from everyone's favorite Excel guru, YouTube's ExcelsFun, the 38th installment in his "Excel Statistics" series of free video lessons, you'll learn how to use the RANK and PERCENTRANK functions as well as the Data Analysis add-in's Rank & Percentile tools.
"I was wondering if you could take the triad Harmonic Analysis lesson you had done a step further and cover the concept of Transposing chord progressions into other keys?" Before you begin you do have to know some background information about your key signatures, knowing major, minor and diminished steps in triad analysis, and seventh chord harmony. The idea of transposing is that your take a set of notes and change they key it is originally played in. Andrew will walk you through all the ste...
This video is based on a chemistry experiment. This video is going to explain to us how to use gravimetric analysis in order to analyze sulfuric acid. This experiment should not be done for those who do not have a fundamental knowledge of chemical compounds, reactions and chemical safety. He explains first what he is about to do before he does it. Sulfuric acid is acidic and can be toxic if ingested or in contact with the eyes. Take extreme care with this experiment.
Chef Frank Miller shares his recipe for this spicy dish, which can be made more or less spicy depending on your taste.
Notice: This is probably not new to many people. This *IS* new for some people however, and meant for them! Post interesting cameras you find.
This chess tutorial from Grandmaster Alexandra Kosteniuk is a perfect example of Retrograde Analysis.
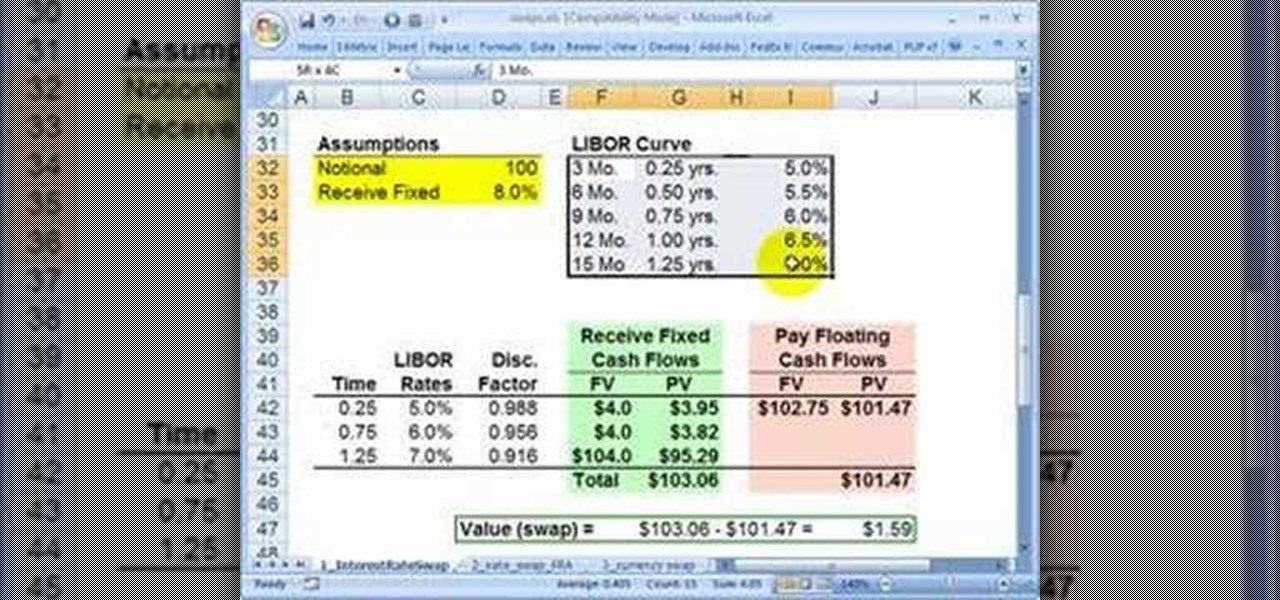
High finance and statistical analysis are too complex for most people once they forget what they learned in high school. If you are an investor or small business owner, you can't afford to forget this stuff. This video will teach you how to value an interest rate swap, good info for financial professionals and students.
If you use Microsoft Excel on a regular basis, odds are you work with numbers. Put those numbers to work. Statistical analysis allows you to find patterns, trends and probabilities within your data. In this MS Excel tutorial from everyone's favorite Excel guru, YouTube's ExcelsFun, the 45th installment in his "Excel Statistics" series of free video lessons, you'll learn how to see how to calculate a z-score.
If you use Microsoft Excel on a regular basis, odds are you work with numbers. Put those numbers to work. Statistical analysis allows you to find patterns, trends and probabilities within your data. In this MS Excel tutorial from everyone's favorite Excel guru, YouTube's ExcelsFun, the 35.2nd installment in his "Excel Statistics" series of free video lessons, you'll learn how to use Excel's GEOMEAN function to find geometric mean.
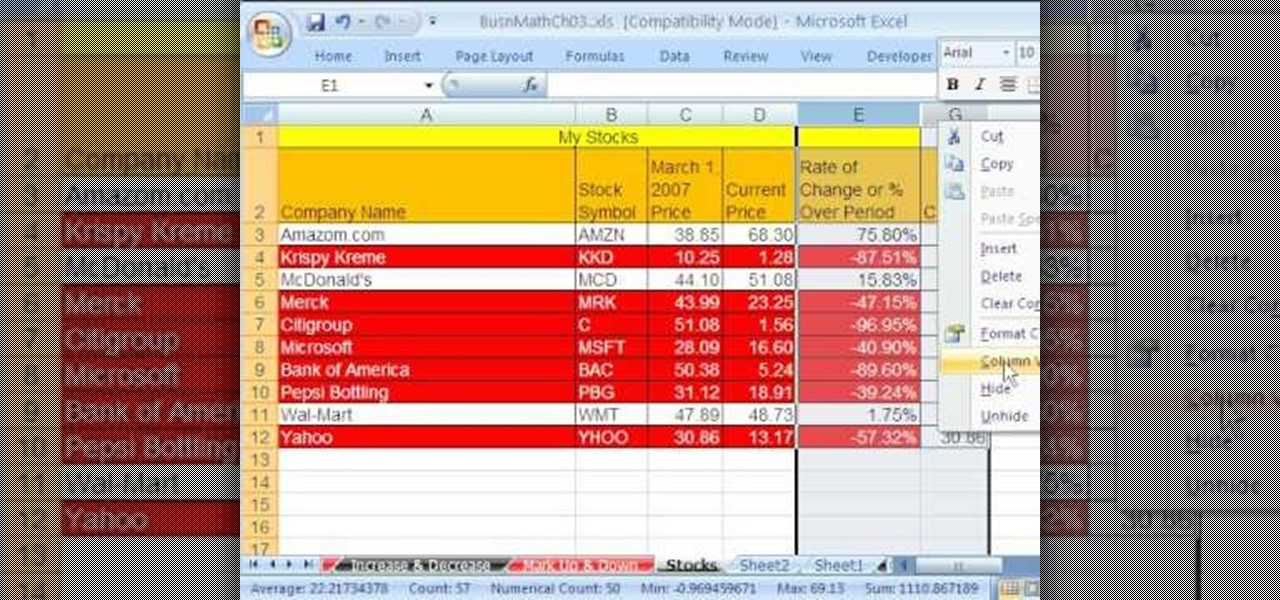
As you might guess, one of the domains in which Microsoft Excel really excels is business math. Brush up on the stuff for your next or current job with this how-to. In this tutorial from everyone's favorite digital spreadsheet guru, YouTube's ExcelIsFun, the 33rd installment in his "Excel Business Math" series of free video lessons, you'll learn how to add current stock prices to a stock analysis table in Excel using a web query.
If you use Microsoft Excel on a regular basis, odds are you work with numbers. Put those numbers to work. Statistical analysis allows you to find patterns, trends and probabilities within your data. In this MS Excel tutorial from everyone's favorite Excel guru, YouTube's ExcelsFun, the 40th installment in his "Excel Statistics" series of free video lessons, you'll learn how to calculate range & interquartile range for variability using the MAX, MIN, QUARTILE functions.
If you use Microsoft Excel on a regular basis, odds are you work with numbers. Put those numbers to work. Statistical analysis allows you to find patterns, trends and probabilities within your data. In this MS Excel tutorial from everyone's favorite Excel guru, YouTube's ExcelsFun, the 86th installment in his "Excel Statistics" series of free video lessons, you'll learn how to construct confidence intervals for proportions using NORMSINV function and other formulas.
If you use Microsoft Excel on a regular basis, odds are you work with numbers. Put those numbers to work. Statistical analysis allows you to find patterns, trends and probabilities within your data. In this MS Excel tutorial from everyone's favorite Excel guru, YouTube's ExcelsFun, the 87th installment in his "Excel Statistics" series of free video lessons, you'll learn how to calculate sample size (n) for confidence intervals.
If you use Microsoft Excel on a regular basis, odds are you work with numbers. Put those numbers to work. Statistical analysis allows you to find patterns, trends and probabilities within your data. In this MS Excel tutorial from everyone's favorite Excel guru, YouTube's ExcelsFun, the 27th installment in his "Excel Statistics" series of free video lessons, you'll learn how to create a quantitative data dot plot chart using the REPT and COUNTIF functions.
If you use Microsoft Excel on a regular basis, odds are you work with numbers. Put those numbers to work. Statistical analysis allows you to find patterns, trends and probabilities within your data. In this MS Excel tutorial from everyone's favorite Excel guru, YouTube's ExcelsFun, the 26th installment in his "Excel Statistics" series of free video lessons, you'll learn how to create quantitative data cumulative frequency distributions with pivot tables.
If you use Microsoft Excel on a regular basis, odds are you work with numbers. Put those numbers to work. Statistical analysis allows you to find patterns, trends and probabilities within your data. In this MS Excel tutorial from everyone's favorite Excel guru, YouTube's ExcelsFun, the 16th installment in his "Excel Statistics" series of free video lessons, you'll learn how to cross tabulate & do percentage cross tabulation for categorical data using a pivot table (PivotTable).
If you use Microsoft Excel on a regular basis, odds are you work with numbers. Put those numbers to work. Statistical analysis allows you to find patterns, trends and probabilities within your data. In this MS Excel tutorial from everyone's favorite Excel guru, YouTube's ExcelsFun, the 19th installment in his "Excel Statistics" series of free video lessons, you'll learn how to group categories in a frequency distribution with a formula (2 COUNTIF) and the pivot table (PivotTable) grouping fea...
If you use Microsoft Excel on a regular basis, odds are you work with numbers. Put those numbers to work. Statistical analysis allows you to find patterns, trends and probabilities within your data. In this MS Excel tutorial from everyone's favorite Excel guru, YouTube's ExcelsFun, the 17th installment in his "Excel Statistics" series of free video lessons, you'll learn how to cross tabulate & do percentage cross tabulation for categorical data using formulas rather than pivot tables.
If you use Microsoft Excel on a regular basis, odds are you work with numbers. Put those numbers to work. Statistical analysis allows you to find patterns, trends and probabilities within your data. In this MS Excel tutorial from everyone's favorite Excel guru, YouTube's ExcelsFun, the 35th installment in his "Excel Statistics" series of free video lessons, you'll learn how to calculate weighted and geometric means and see how to use the GEOMEAN function.