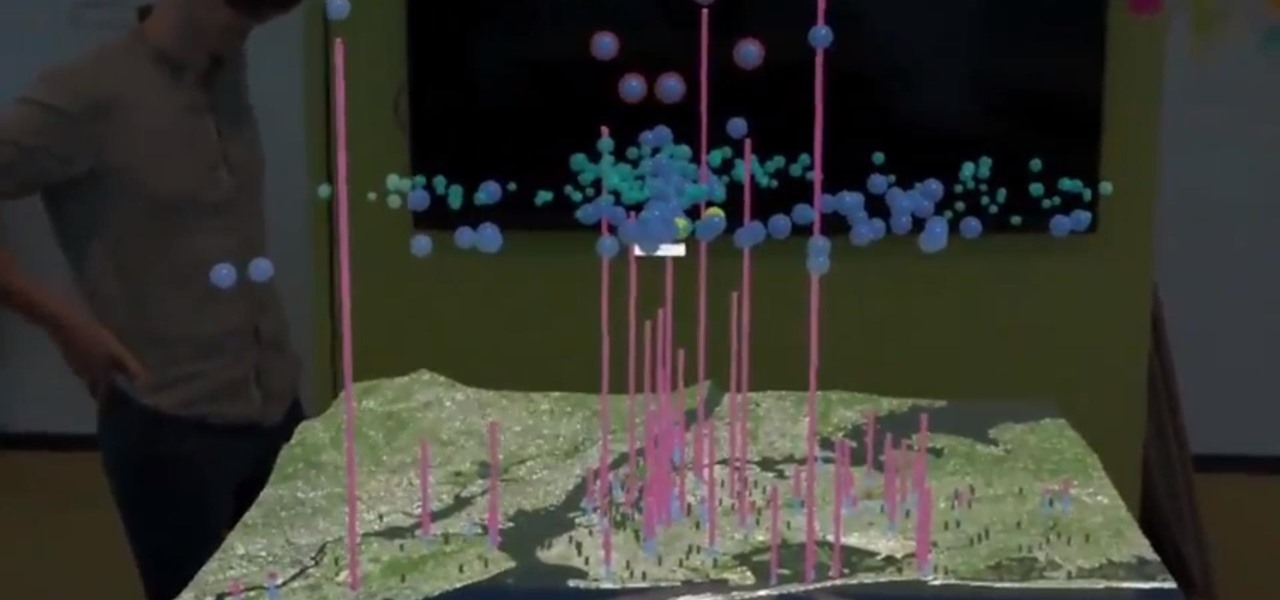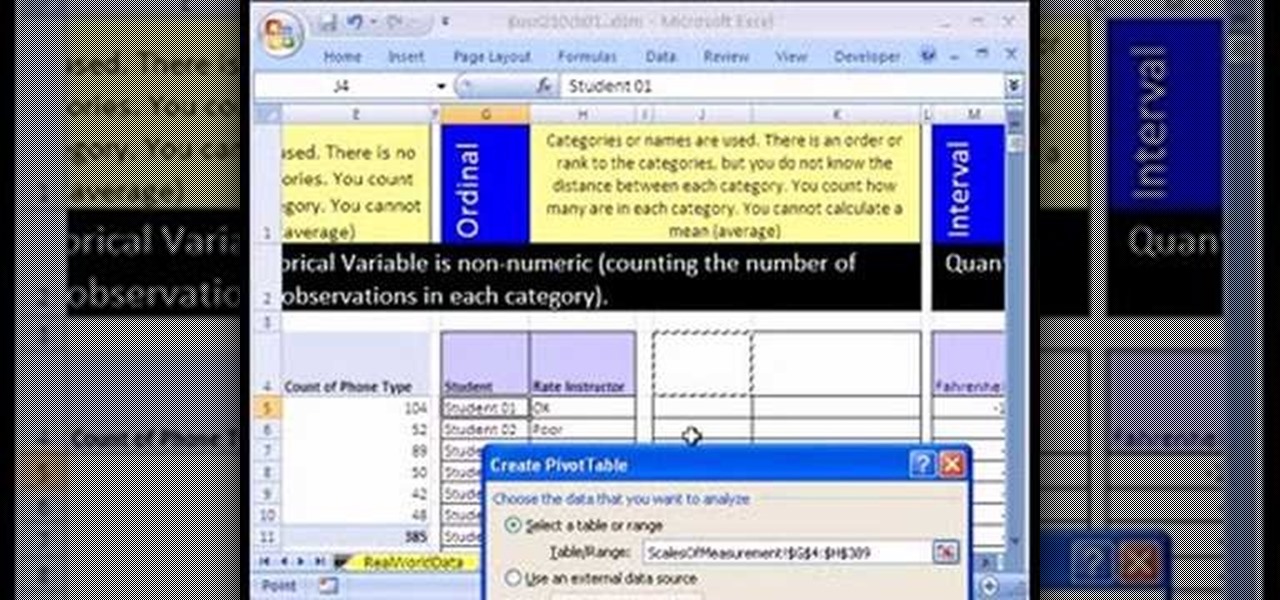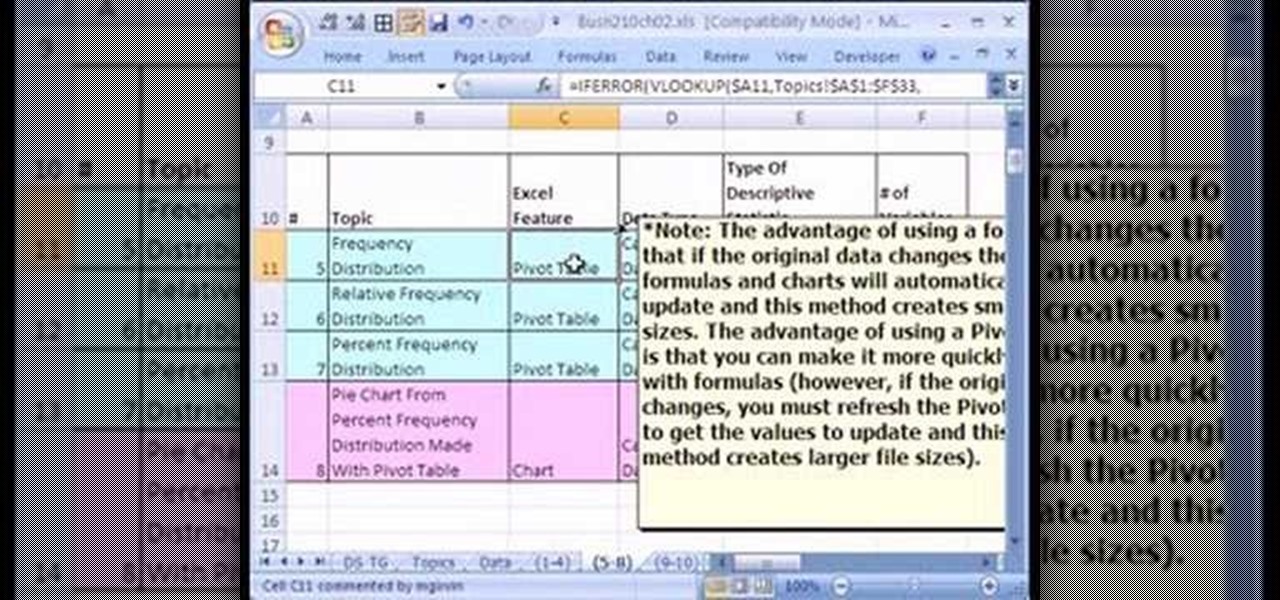
If you use Microsoft Excel on a regular basis, odds are you work with numbers. Put those numbers to work. Statistical analysis allows you to find patterns, trends and probabilities within your data. In this MS Excel tutorial from everyone's favorite Excel guru, YouTube's ExcelsFun, the 12th installment in his "Excel Statistics" series of free video lessons, you'll learn how to use Advanced Filter 'Unique Records Only" to extract a list of unique items from a data base, and then use the COUNTI...

Check out this informative video tutorial from Apple on how to format data values with the format bar in Numbers '09.

Even Halo: Reach on the Xbox 360 has hidden collectable items! All in the convenient (for the people hiding them) size of a small data pad! Earlier you got access to the first 9 data pads that you can get on any difficulty. Next, you will get a look on the next 9 data pads that you can only acquire while being on Legendary difficulty!
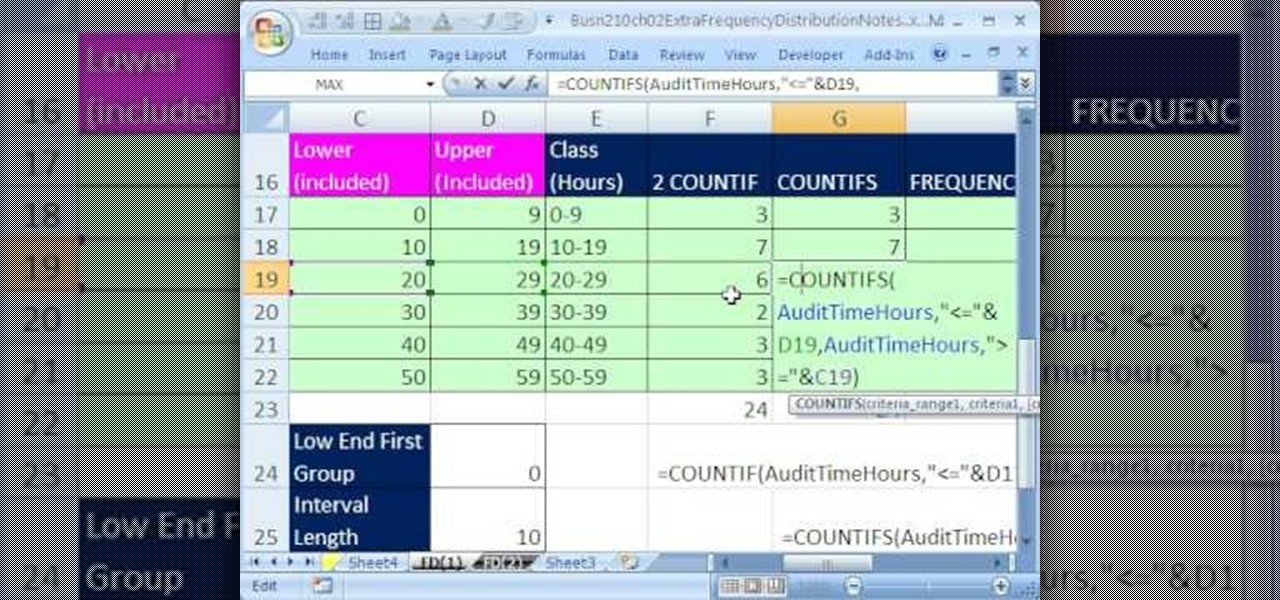
If you use Microsoft Excel on a regular basis, odds are you work with numbers. Put those numbers to work. Statistical analysis allows you to find patterns, trends and probabilities within your data. In this MS Excel tutorial from everyone's favorite Excel guru, YouTube's ExcelsFun, the 32nd installment in his "Excel Statistics" series of free video lessons, you'll learn how to group when the quantitative data are whole numbers, integers or discrete data and how to group when the quantitative ...

New to Microsoft Excel? Looking for a tip? How about a tip so mind-blowingly useful as to qualify as a magic trick? You're in luck. In this MS Excel tutorial from ExcelIsFun, the 255th installment in their series of digital spreadsheet magic tricks, you'll learn how to create a two-variable data table in Excel for what-if analysis. See the PMT function and learn about the formula equivalent to a data table.
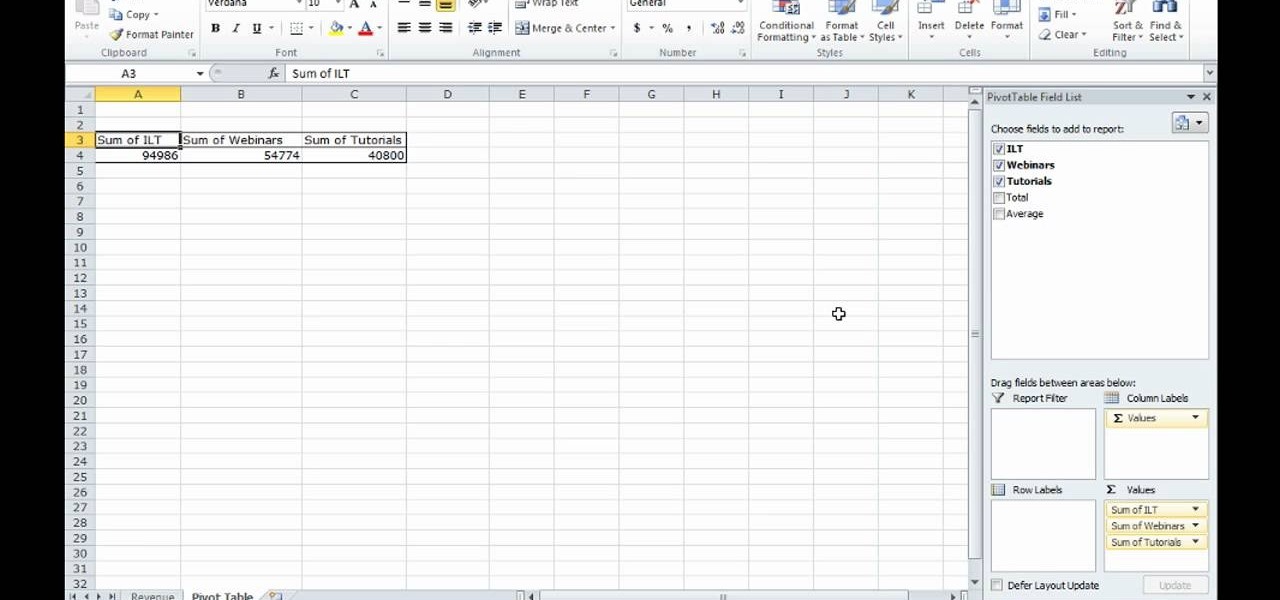
This video shows how to make a quick pivot table data filtering by using Excel 2010's ‘Slicer’ functionality. ‘Slicer’ delivers enhanced visual filtering method to allow you to get the data you need more quickly. When selecting a cell in the pivot table you will find ‘Slicer’ in the filter group of the ‘Insert’ tab. Click on ‘Slicer’ and an 'Insert Slicer' dialogue shows up where you can pick particular data fields from the slider list. Once you click on ‘OK’, the ‘Slicer’ objects with filter...

Core Data is a powerful data-management framework introduced with Mac OS X v10.4 Tiger. When you take advantage of Core Data, it slashes the amount of custom code you need to write in order to manage application data. Opening, saving and undo management can all be handled by Core Data, freeing you to concentrate on creating unique features for your application. This video tutorial, which presents a general introduction to using Core Data, will walk you through the process of building a simple...

If you're reading this, you're likely a tech-savvy coding pro whose analytical talents are mostly applied to designing apps, cracking passwords, and infiltrating networks — all of which are admirable activities for both aspiring and seasoned white hat hackers. But there are other profitable ways that you can put these types of skills to use, namely in the world of investment and trading.

This month, the power of artificial intelligence will be coming to more augmented reality developers as a leader in the game and 3D software development space and a major force behind the current school of cloud-based AI have officially announced a new partnership.

When it comes to Hi-Fi music streaming services, Jay-Z's Tidal is one of your only choices. But as you can imagine, true High Fidelity audio requires faster download speeds than your average music service. So the question becomes, how do you listen to Hi-Fi tracks on Tidal when a speedy internet connection isn't available? Offline music is the answer.

Intel launched their Advanced Vehicle Lab in Silicon Valley this week, and the tech giant is now on the hunt for potential partners.

NOTICE: Ciuffy will be answering questions related to my articles on my behalf as I am very busy. Hope You Have Fun !!!

This three-part tutorial offers an overview of the the basics of Houdini CHOPS, providing two examples of music driven animation. The first part looks at how to bring data into a CHOPS network, and export it using lag as an example. Create music-driven animations via CHOPS in Houdini 10 - Part 1 of 3.

Waymo claims in court documents filed yesterday in its lawsuit against Uber that ex-Uber CEO Travis Kalanick knew that former Google engineer Anthony Levandowski was in the possession of stolen documents while employed at the troubled ride-sharing firm.

The Cloud Security Alliance (CSA), a leading IT trade association, has published its first report on risks and recommendations for connected-vehicle security, ahead of when driverless cars are about to see volume production in the near future.

Do you have a file (or many files) that, in the wrong hands, may cause you trouble? Don't worry about it, because I'll show you how to wipe it (or them) from your computer in order to leave no trace behind.

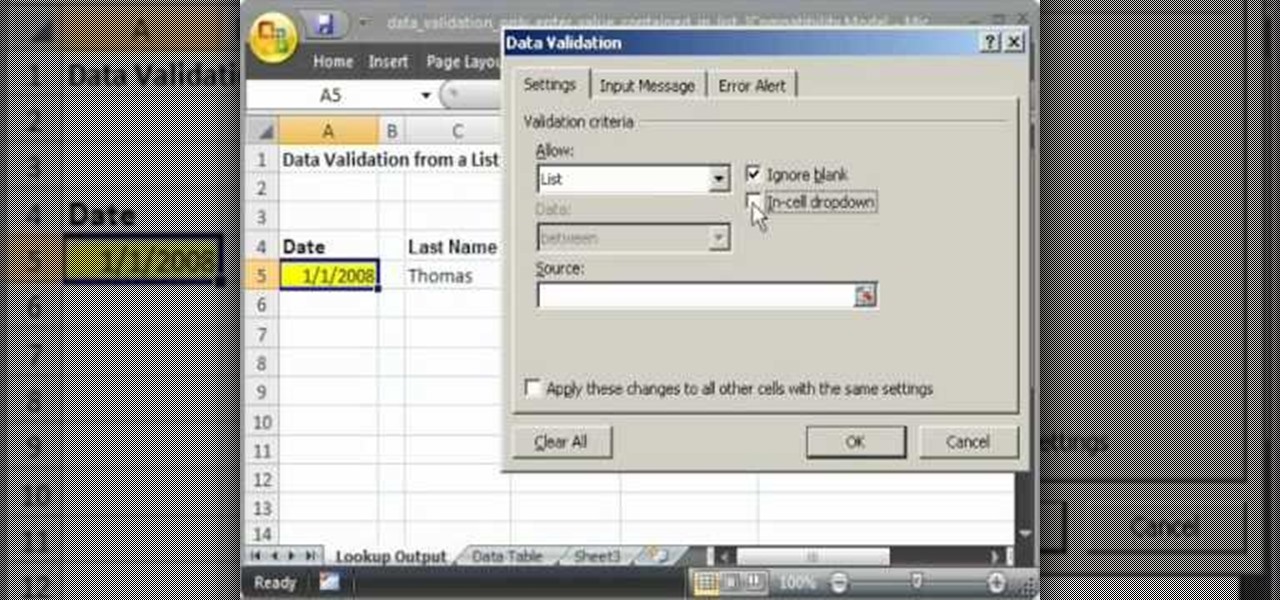
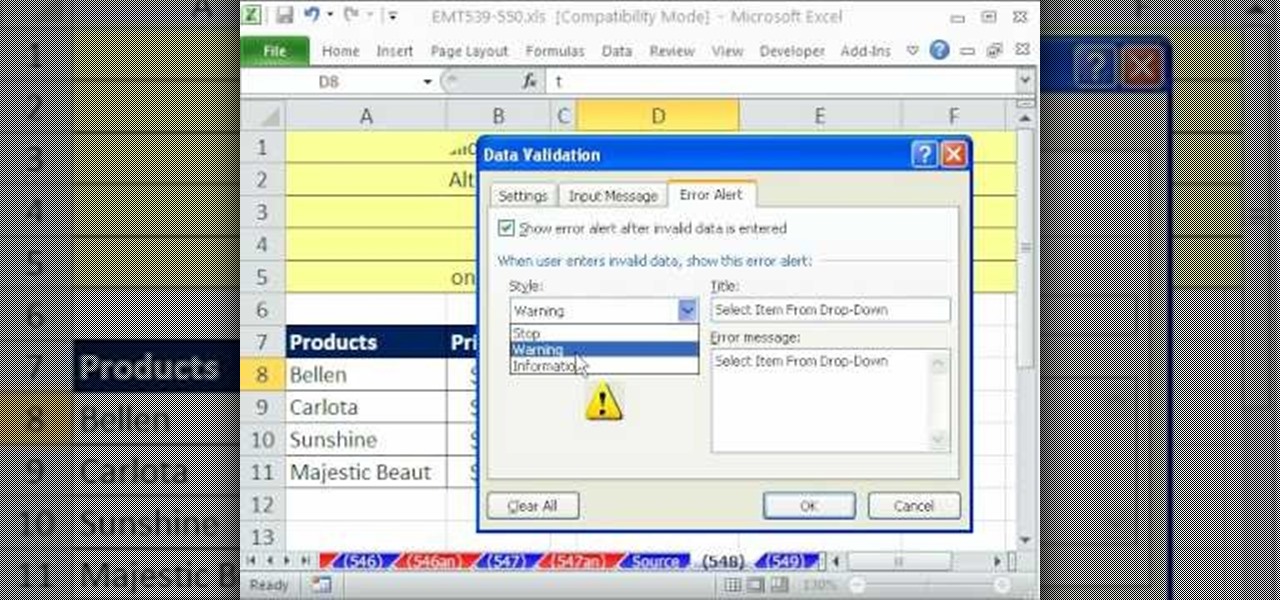
This video shows you how to idiot-proof a data set in Excel pretty much. It demonstrates how to enable data validation in a cell, so that when you type something in it must be in a predetermined list or will not work. Start by typing in your data table in a second tab. His example is a date, then information about certain employees based on that day. To enter the data validation menu, click the cell you want to use and then hit ALT+D+L to bring it up. Go to settings, then under the Allow menu...

Looking to find the standard deviation of your set of values? Standard deviation quantifies how diverse the values of your data set are, and is useful in determining how different your numbers are from each other.

At first, the Black Ops 1.04 patch seemed like a godsend. It was supposed to fix the horde of issues plaguing Call of Duty: Black Ops on the PlayStation 3.

I recently picked up a Pixel Slate when Google had a deal going on. I'd been in the market for an Android tablet since the Nexus 7, and this was the closest thing to it. Unfortunately, I soon learned Chrome OS and Android aren't as integrated as I had hoped.

Google Drive has a very simple way to switch from iOS to Android. iPhone users who want to take the plunge into the wonderful world of Android, but were hesitant to do so in the past because of the laborious process of backing up their data, can back up their contacts, photos, videos, and calendars with the tap of a button.

Welcome back, my nascent hackers! In the conclusion of the Mr. Robot television series, Elliot and fsociety successfully completed their mission of encrypting all of Evil Corp's data with AES-128 encryption and destroying the key.

We all have our reasons for erasing personal data from a phone. Whether you just ended a bad relationship whose face you never want to see again (lots of text messages) or just want to restore your privacy on the cell phone, erasing may be your only option.

If you use Microsoft Excel on a regular basis, odds are you work with numbers. Put those numbers to work. Statistical analysis allows you to find patterns, trends and probabilities within your data. In this MS Excel tutorial from everyone's favorite Excel guru, YouTube's ExcelsFun, the 10th installment in his "Excel Statistics" series of free video lessons, you'll learn how about data sets and the nominal, ordinal, interval and ration scales/levels of measurement and see two Pivot Tables that...

When you're on the road, you want to be in control of your vehicle. The only way to be in control and improve your driving skills is by having good hand positions and correct and comfortable seating position. Learn how to drive safe with a good hand and seat position (Ford DSFL). A professional driver gives this important tip about seating position.

Excel is great, and if you're a Mac user, Excel 2008 for Mac has a lot of new and useful great features you can use to maximize efficiency in your spreadsheets. Excel doesn't have to be the boss anymore, you can! The Microsoft Office for Mac team shows you all the great features in this how-to video.

Data can be troubling, especially if there's a ton of it plaguing your Excel worksheet. But Excel 2008 for Mac makes life a little easier and less confusing thanks to a few worksheet tips and features you can utilize to work with your data in worksheet cells. The Microsoft Office for Mac team shows you just how to work with worksheets in this how-to video.

Not every client or coworker likes to mine through a spreadsheet to find all the important data. So, with Excel 2008 for Mac, you can easily share that data without sending the entire Excel spreadsheet. To do this, all you need to do is to use the "copy as picture" option. The Microsoft Office for Mac team shows you just how to insert a spreadsheet snippet in this how-to video.

Top-Windows-Tutorials is a great site dedicated to Windows tutorials for almost all things Windows. Whether you are a computer novice or an expert in Windows operating systems, you'll find useful information in these guides catering to your level of expertise. These user friendly and easy to follow free Windows tutorials will show you all that you can do with your Windows PC.

While many of the latest content partnerships announced by Magic Leap appear to lean towards entertainment and gaming, a new partnership with medical technology provider Brainlab has Magic Leap getting down to more serious business.

Because it sources a majority of its vital data from actual drivers on the road, Waze is easily one of the best navigation apps to use if you prioritize safety. Benefits such as crowd-sourced traffic data, police trap locations, and road work avoidance, when combined, help you anticipate traffic conditions with unprecedented accuracy and make adjustments accordingly.

It looks like Chris Urmson has spent the six months since he left Google's Self Driving Car Project trying to build a get-rich-quick self-driving unicorn, along with Sterling Anderson, formerly with Tesla Motors. At least that is one of several scandalous accusations in a Tesla lawsuit aimed at the pair, and their secretive startup Aurora Innovation, LLC.

Just recently, I was experimenting with a dual-boot Windows setup, and somehow managed to wipe my primary Windows installation in the process. "Why," I asked myself, "Why didn't I make a backup before I started this?" Still to this day, I'm going through the painstaking process of installing and configuring all of my favorite programs, and I may not ever get things back exactly the way they were.

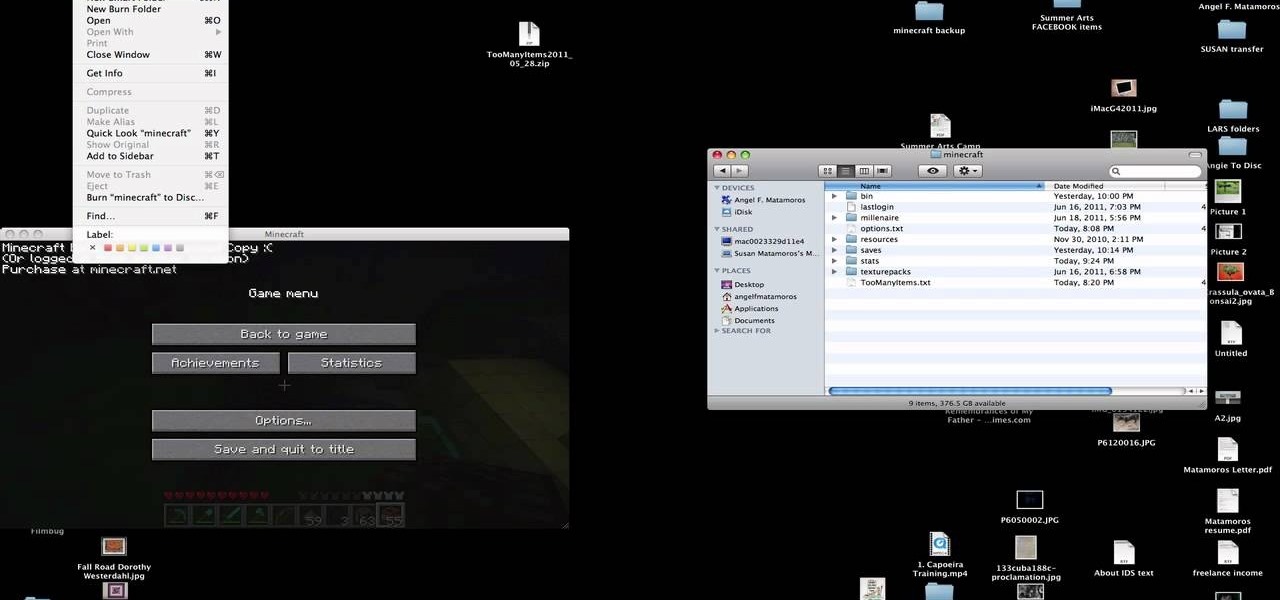
You have worked long and hard creating an entire world of Minecraft data. Make sure you have all of that saved data backed up. Watch this video to learn how to backup your Minecraft data. You will be glad that you did.

Thirty dollars a month may be a little steep for an unlimited data plan for iPad users. To cut down on your data usage, you can download the Offline Pages app to browse articles or blogs offline. InstaPaper is another account you can use as well, and both will cut down on your data usage per month.

If you want to manage what sort of data is entered into your Excel spreadsheet, data validation will help you to accomplish just that. In this Excel tutorial from ExcelIsFun, the 549th installment in their series of Excel magic tricks, you'll learn how to use data validation to full effect in your Microsoft Office projects.

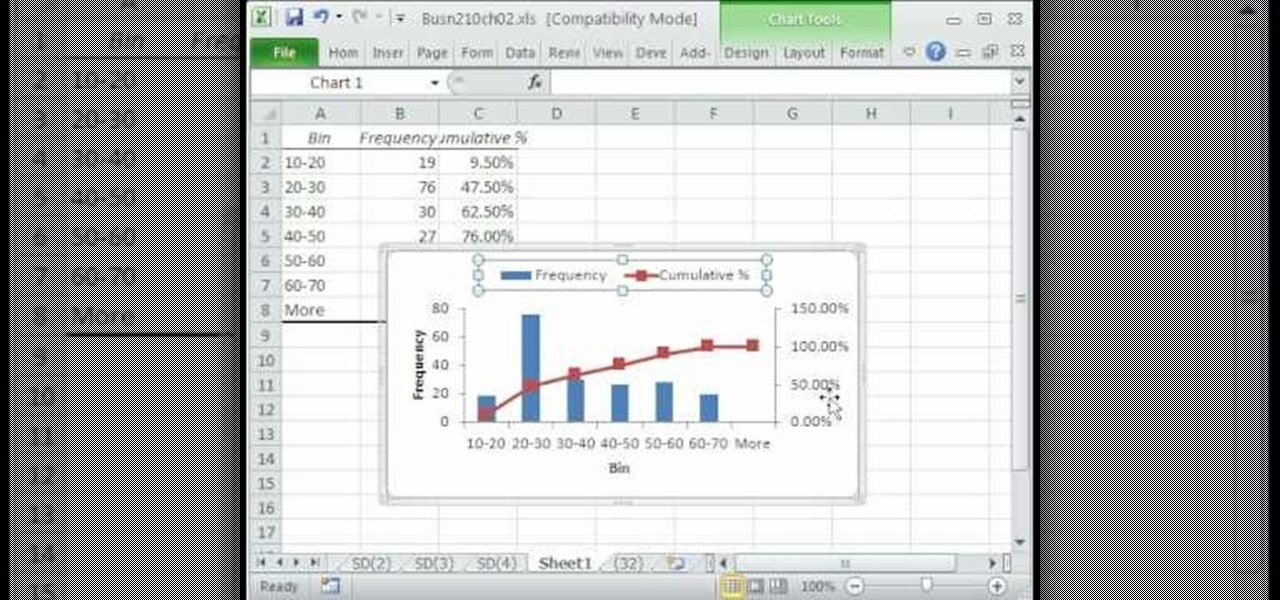
A histogram is a summary graph showing a count of data points that fall in various ranges. Histograms are used in statistics and other forms of mathematics. In this video, learn how to create your own histogram using data analysis on the computer. This tutorial will show you how to create a frequency distribution, a cumulative frequency distribution, a histogram chart and an ogive chart with the data analysis add-in.

In Halo: Reach for the Xbox 360, there is so much to do! The campaign, the multiplayer, the achievements! But One tough one to get is all 19 hidden data pads. Luckily for you, the first nine can be acquired on any difficulty, and in this video you will learn the locations of all nine of the initial data pads on levels such as Winter Contingency and Pillar of Autumn!

ReadyBoost in Windows 7 can give your PC a boost. How? This feature takes advantage of unused space and can quickly free up room and make your computer faster. Watch this Microsoft video for more details.

If you are new to Trapster, and wish to help your fellow users by submitting a speed trap, check out this quick clip. In it, you will learn how to submit a trap to the application so everyone in your area gets an alert. This app depends on users helping other users, so stay informed and join the Trapster revolution.


