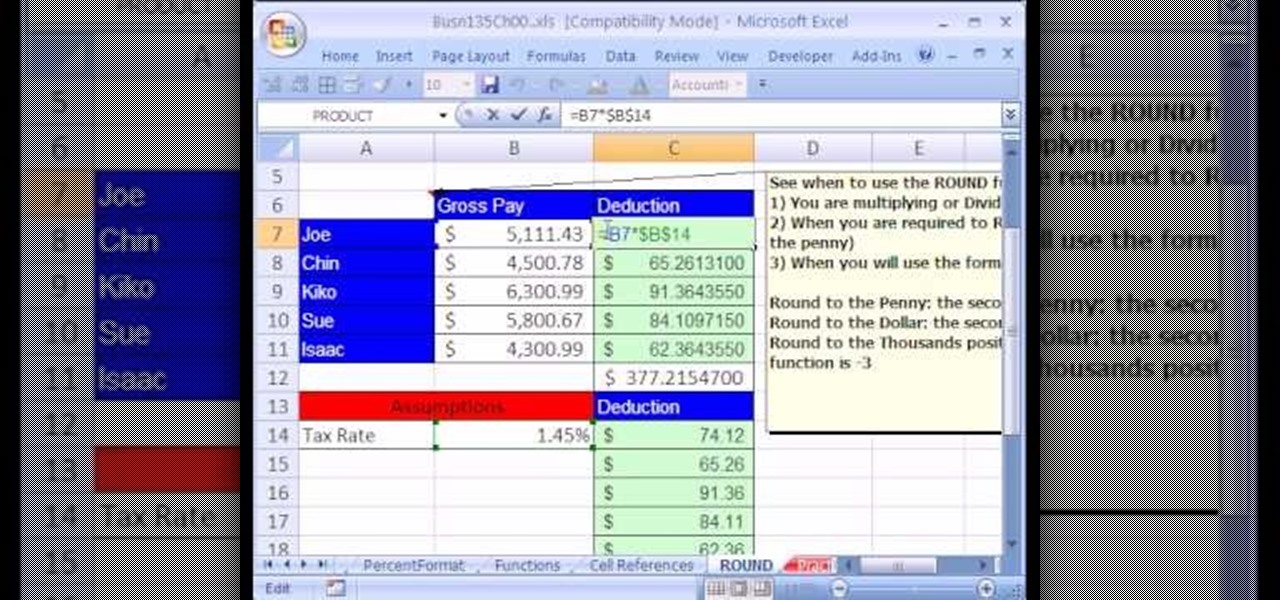
As you might guess, one of the domains in which Microsoft Excel really excels is business math. Brush up on the stuff for your next or current job with this how-to. In this tutorial from everyone's favorite digital spreadsheet guru, YouTube's ExcelIsFun, the 7th installment in his "Business Math" series of free video lessons, you'll learn when to use the ROUND function for math calculations.

Looking for a primer on how to create and work with arrays in Microsoft Office Excel? You've come to the right place. In this free video tutorial from everyone's favorite MS Excel guru, YouTube's ExcelIsFun, the 2nd installment in his series of Excel array formula series, you'll learn how to use the array TRANSPOSE function to transpose a table, switching rows and columns to columns and rows.
Looking for a primer on how to create and work with arrays in Microsoft Office Excel? You've come to the right place. In this free video tutorial from everyone's favorite MS Excel guru, YouTube's ExcelIsFun, the 3rd installment in his series of Excel array formula series, you'll learn how to create an array formula that will calculate the expected return for a given stock.
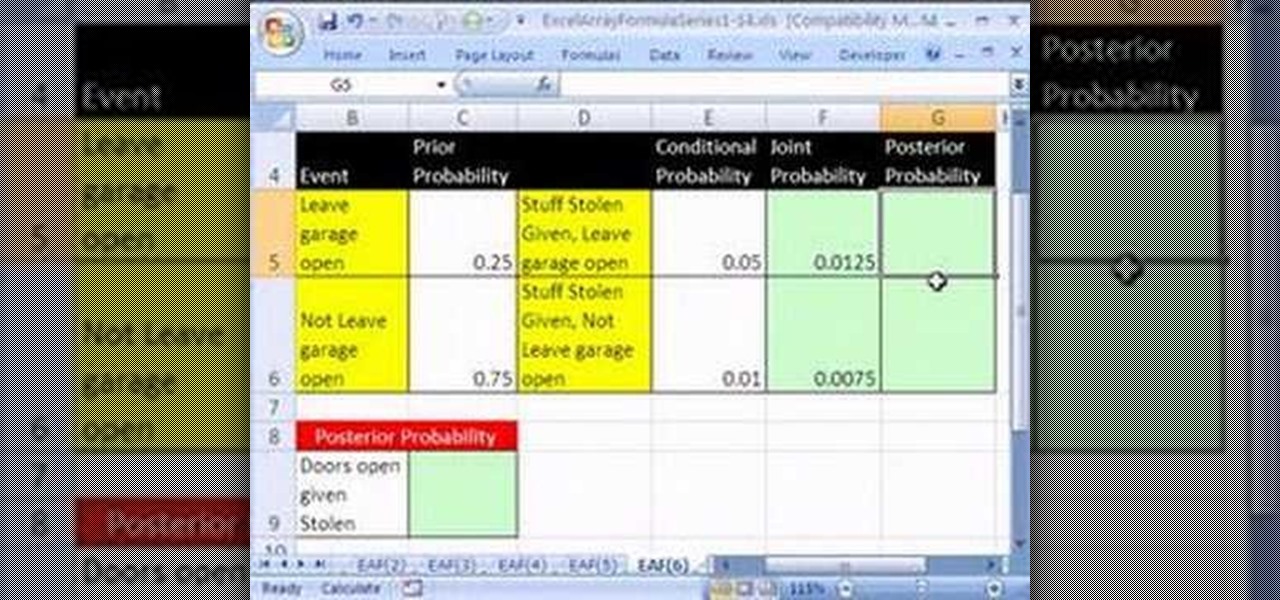
Looking for a primer on how to create and work with array formulas in Microsoft Office Excel? You've come to the right place. In this free video tutorial from everyone's favorite MS Excel guru, YouTube's ExcelIsFun, the 8th installment in his series of Excel array formula series, you'll learn how to create an array formula for Bayes' Theorem.
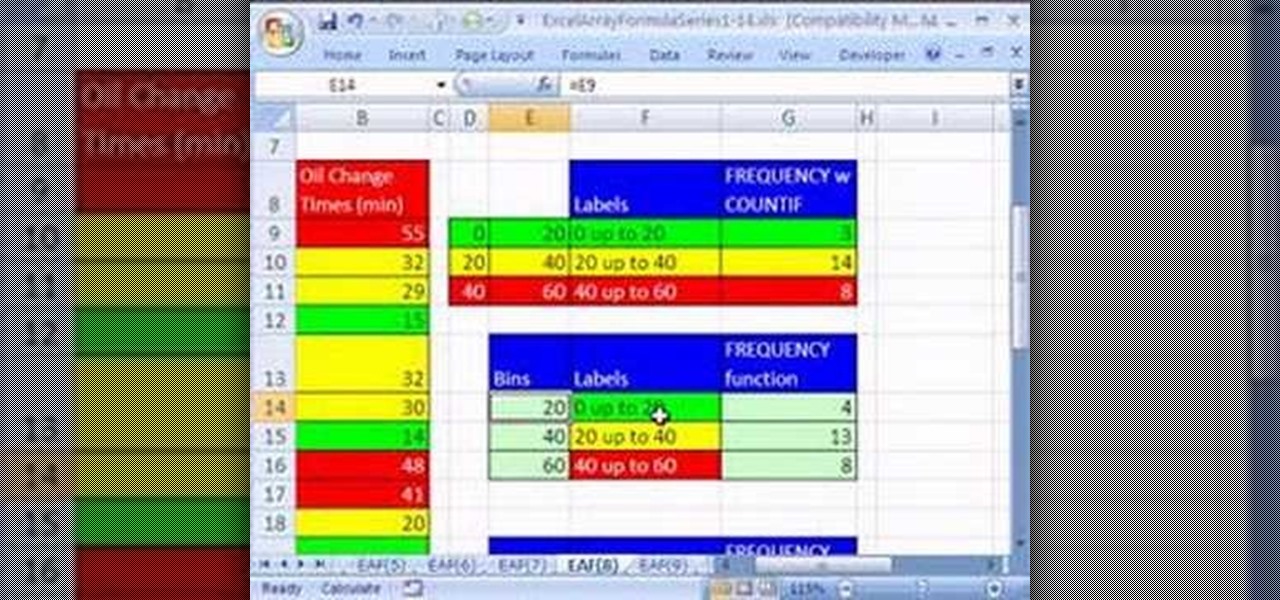
Looking for a primer on how to create and work with array formulas in Microsoft Office Excel? You've come to the right place. In this free video tutorial from everyone's favorite MS Excel guru, YouTube's ExcelIsFun, the 8th installment in his series of Excel array formula series, you'll learn how to use the array FREQUNCY function correctly.
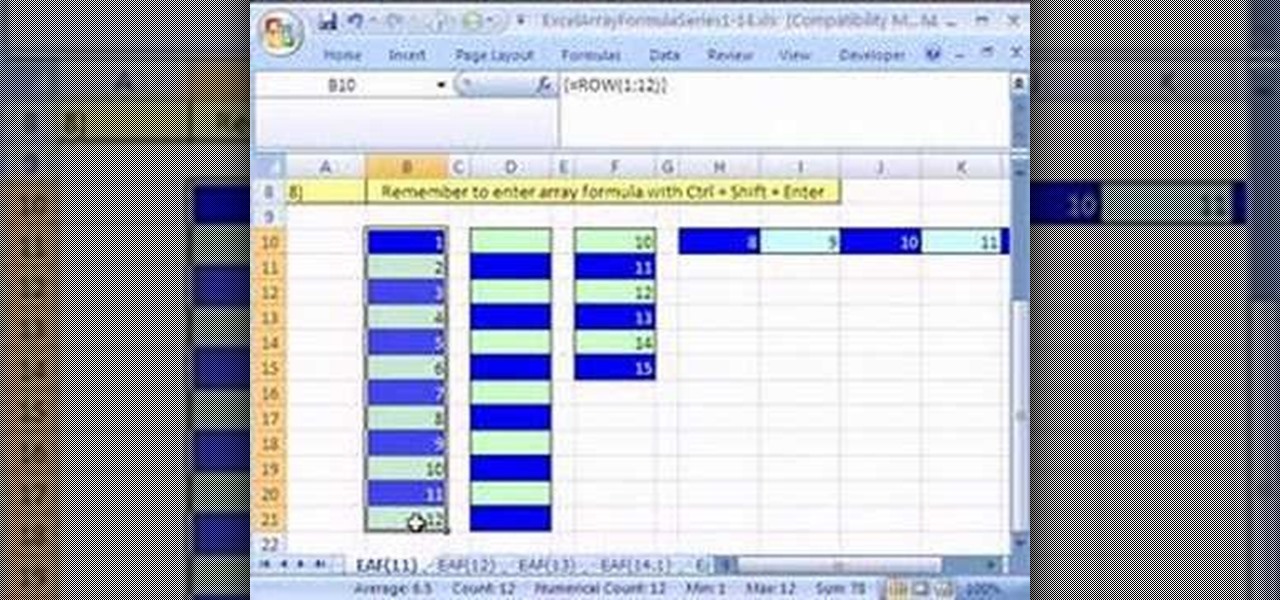
Looking for a primer on how to create and work with array formulas in Microsoft Office Excel? You've come to the right place. In this free video tutorial from everyone's favorite MS Excel guru, YouTube's ExcelIsFun, the 12th installment in his series of Excel array formula series, you'll learn how to create array formulas with the ROW & COLUMN functions that will in turn permit you to create a set of permanently consecutive integers.

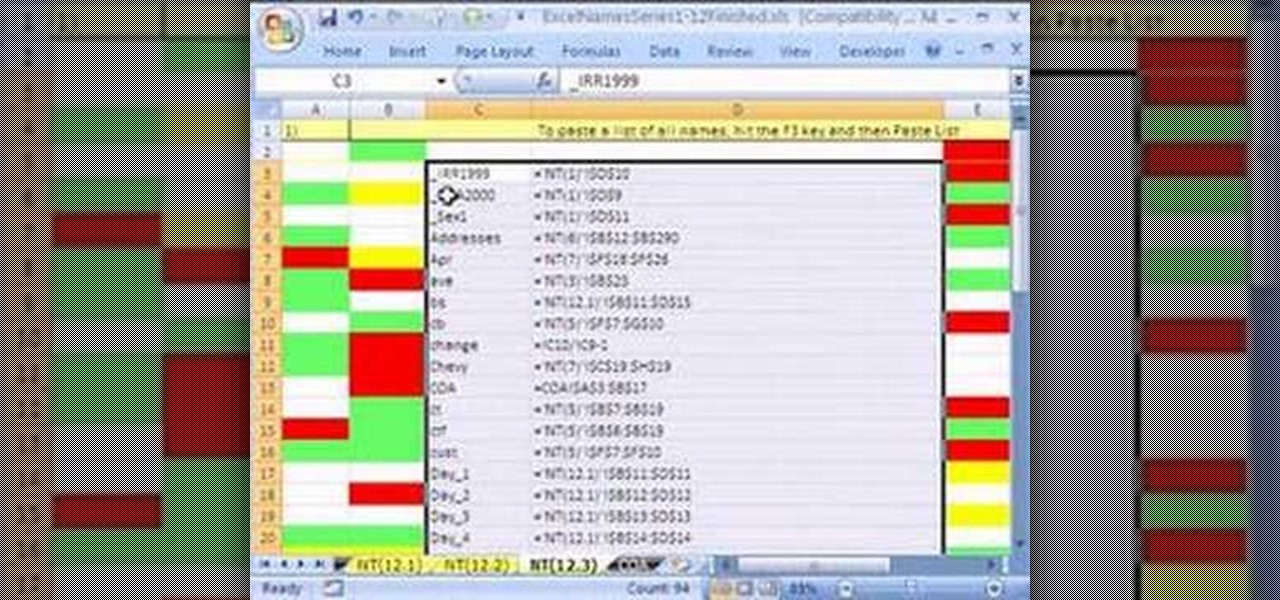
Looking for a primer on how to create and work with names in Microsoft Office Excel? You've come to the right place. In this free video tutorial from everyone's favorite MS Excel guru, YouTube's ExcelIsFun, the 12.66th installment in his series of Excel name tricks, you'll learn how to paste a list of all names in the workbook, both the name and the formula that defines the name.

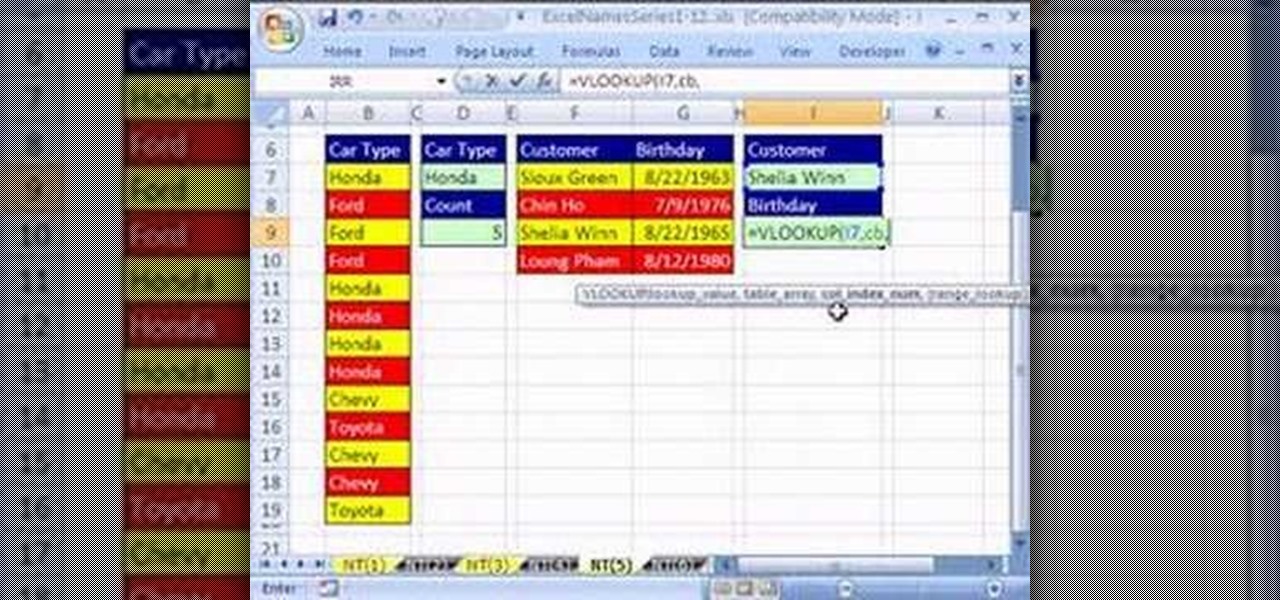
Looking for a primer on how to create and work with names in Microsoft Office Excel? You've come to the right place. In this free video tutorial from everyone's favorite MS Excel guru, YouTube's ExcelIsFun, the 5th installment in his series of Excel name tricks, you'll learn to use names with pivot tables, data validation & the VLOOKUP & COUNTIF functions and formulas.

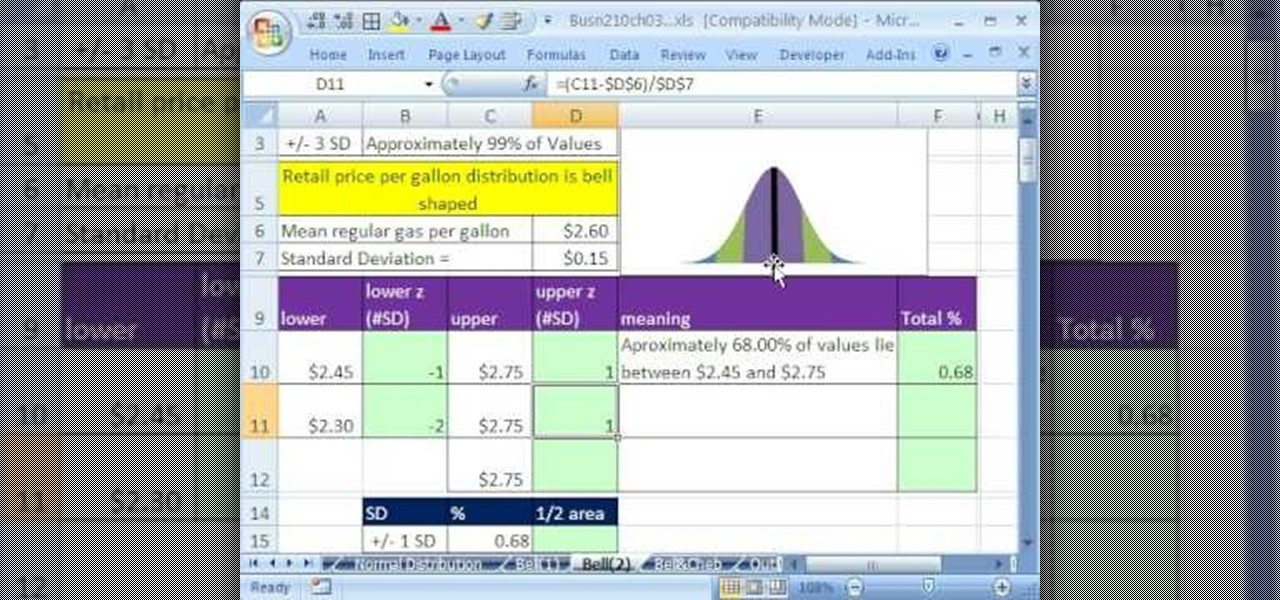
If you use Microsoft Excel on a regular basis, odds are you work with numbers. Put those numbers to work. Statistical analysis allows you to find patterns, trends and probabilities within your data. In this MS Excel tutorial from everyone's favorite Excel guru, YouTube's ExcelsFun, the 47th installment in his "Excel Statistics" series of free video lessons, you'll learn about the basics of the empirical rule (the bell curve) and how to apply it in various ways.

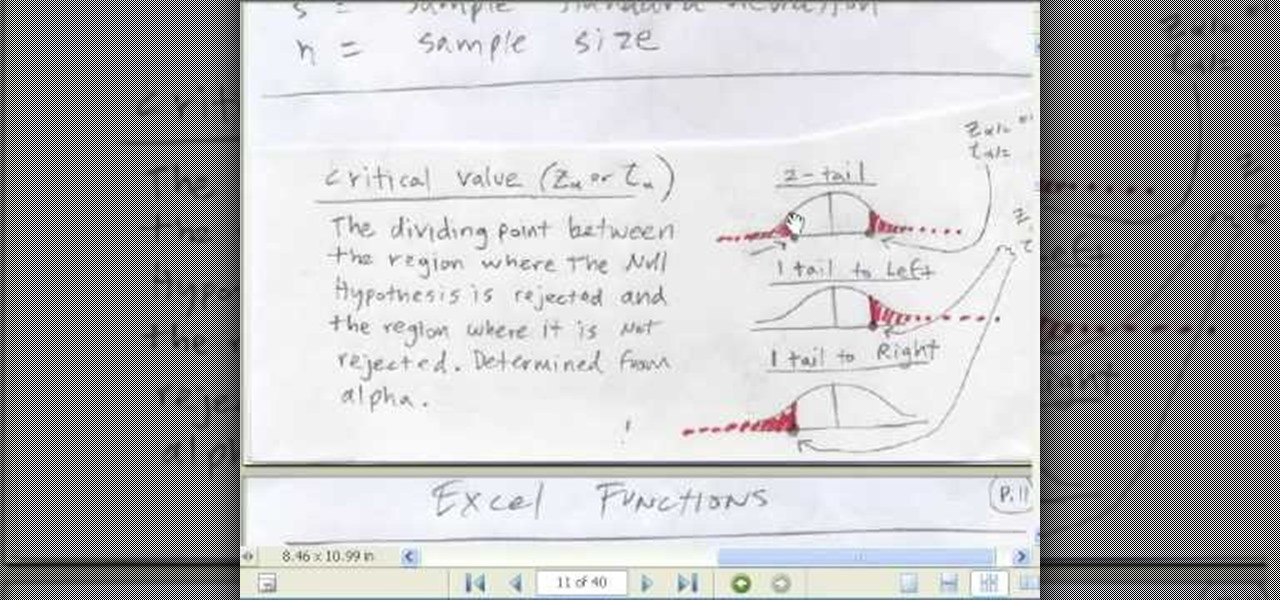
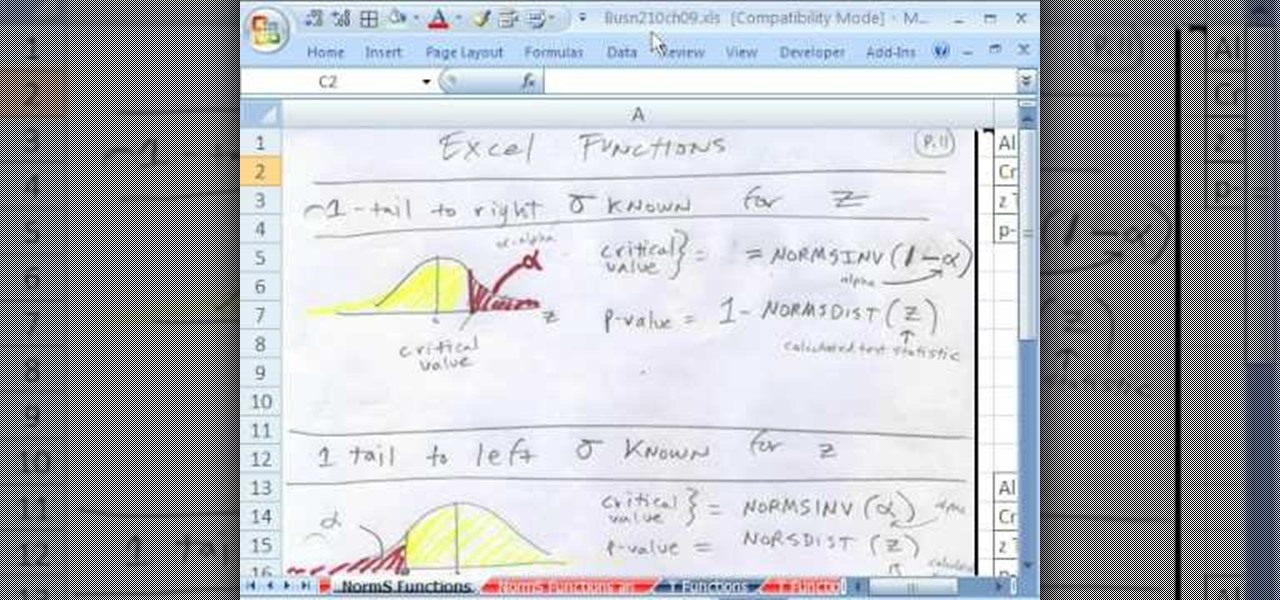
If you use Microsoft Excel on a regular basis, odds are you work with numbers. Put those numbers to work. Statistical analysis allows you to find patterns, trends and probabilities within your data. In this MS Excel tutorial from everyone's favorite Excel guru, YouTube's ExcelsFun, the 89th installment in his "Excel Statistics" series of free video lessons, you'll learn how to use the NORMSINV function for critical values and the NORSDIST function for p-values.

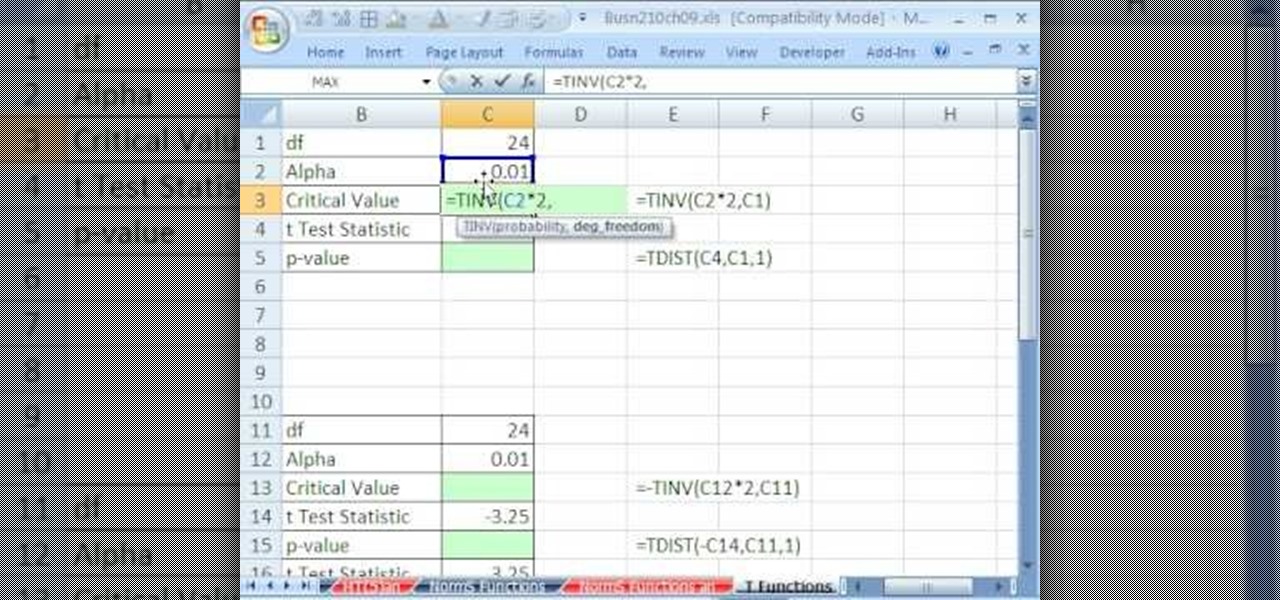
If you use Microsoft Excel on a regular basis, odds are you work with numbers. Put those numbers to work. Statistical analysis allows you to find patterns, trends and probabilities within your data. In this MS Excel tutorial from everyone's favorite Excel guru, YouTube's ExcelsFun, the 91st installment in his "Excel Statistics" series of free video lessons, you'll learn how to use TINV and TDIST functions to find critical values given an unknown sigma value.

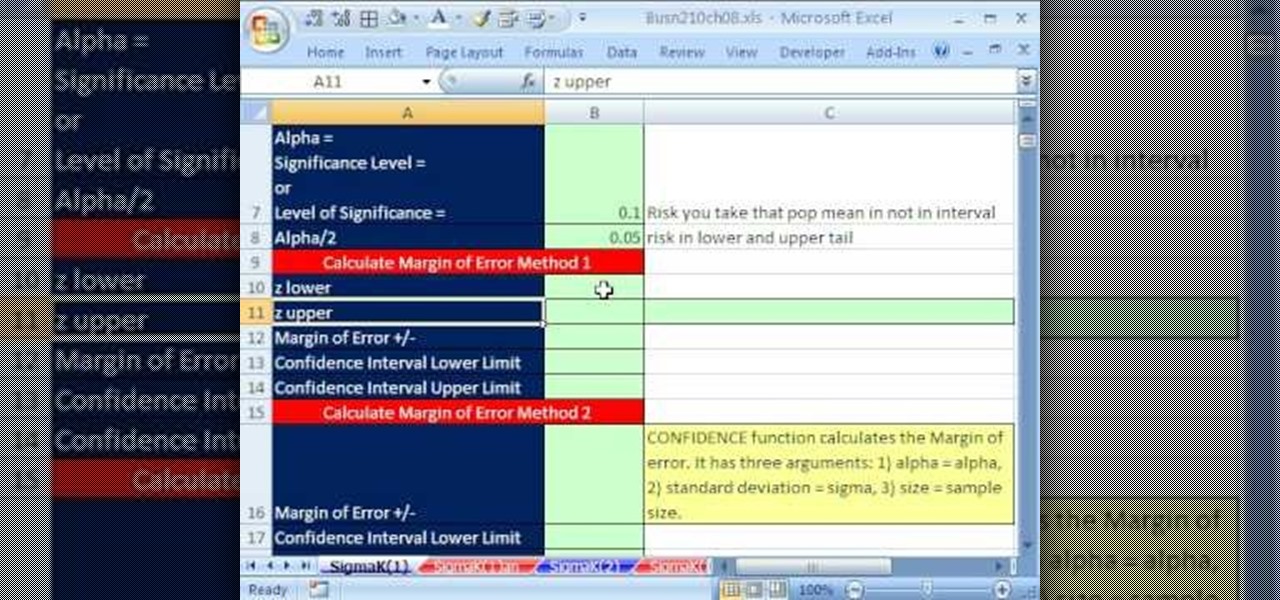
If you use Microsoft Excel on a regular basis, odds are you work with numbers. Put those numbers to work. Statistical analysis allows you to find patterns, trends and probabilities within your data. In this MS Excel tutorial from everyone's favorite Excel guru, YouTube's ExcelsFun, the 80th installment in his "Excel Statistics" series of free video lessons, you'll learn how to construct confidence intervals when the sigma is known known using the CONFIDENCE and NORMSINV functions.

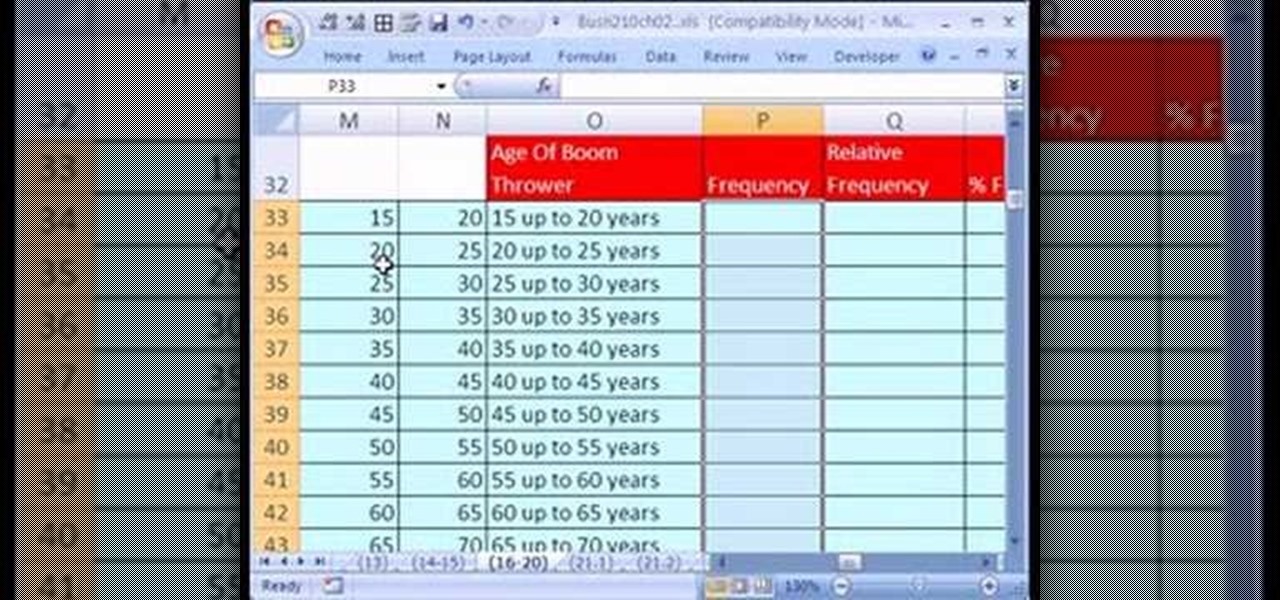
If you use Microsoft Excel on a regular basis, odds are you work with numbers. Put those numbers to work. Statistical analysis allows you to find patterns, trends and probabilities within your data. In this MS Excel tutorial from everyone's favorite Excel guru, YouTube's ExcelsFun, the 21st installment in his "Excel Statistics" series of free video lessons, you'll learn how to build labels and counting formulas for a frequency distribution.

If you use Microsoft Excel on a regular basis, odds are you work with numbers. Put those numbers to work. Statistical analysis allows you to find patterns, trends and probabilities within your data. In this MS Excel tutorial from everyone's favorite Excel guru, YouTube's ExcelsFun, the 87th installment in his "Excel Statistics" series of free video lessons, you'll learn how to use NORMSINV to test a hypothesis with population standard deviation (sigma) known and proportions.

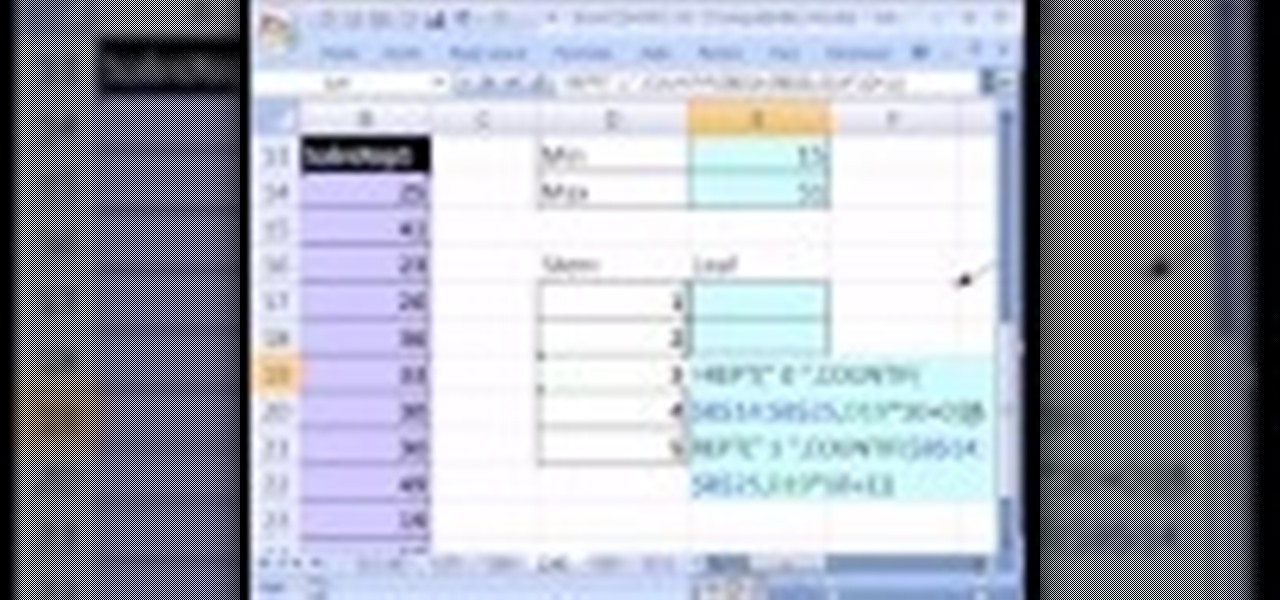
If you use Microsoft Excel on a regular basis, odds are you work with numbers. Put those numbers to work. Statistical analysis allows you to find patterns, trends and probabilities within your data. In this MS Excel tutorial from everyone's favorite Excel guru, YouTube's ExcelsFun, the 28th installment in his "Excel Statistics" series of free video lessons, you'll learn how to create quantitative data stem & leaf charts using the REPT and COUNTIF functions.

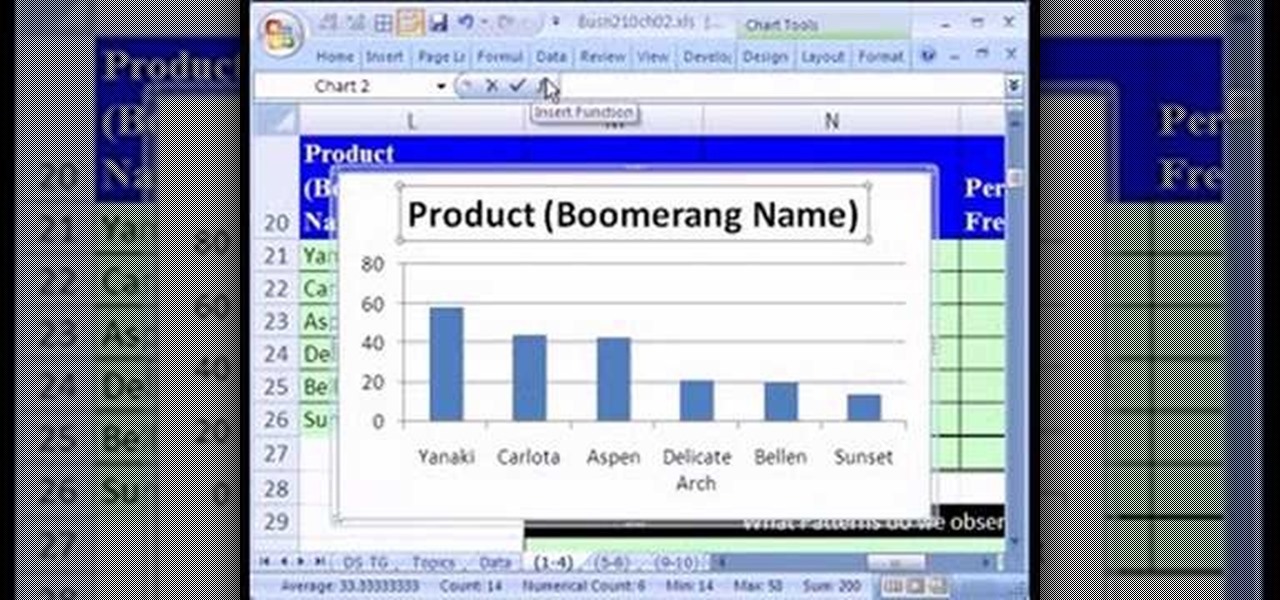
If you use Microsoft Excel on a regular basis, odds are you work with numbers. Put those numbers to work. Statistical analysis allows you to find patterns, trends and probabilities within your data. In this MS Excel tutorial from everyone's favorite Excel guru, YouTube's ExcelsFun, the 13th installment in his "Excel Statistics" series of free video lessons, you'll learn how to create a column chart from a frequency distribution for categorical data.

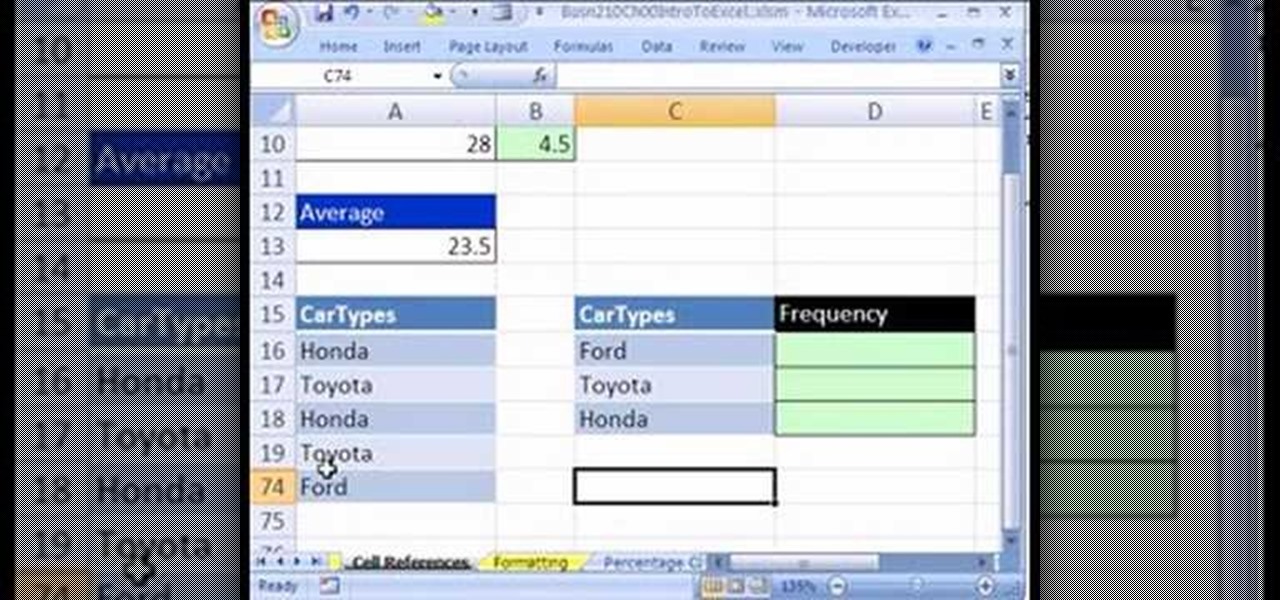
If you use Microsoft Excel on a regular basis, odds are you work with numbers. Put those numbers to work. Statistical analysis allows you to find patterns, trends and probabilities within your data. In this MS Excel tutorial from everyone's favorite Excel guru, YouTube's ExcelsFun, the 5th installment in his "Excel Statistics" series of free video lessons, you'll learn how to use relative and absolute cell references to save time when writing formulas.

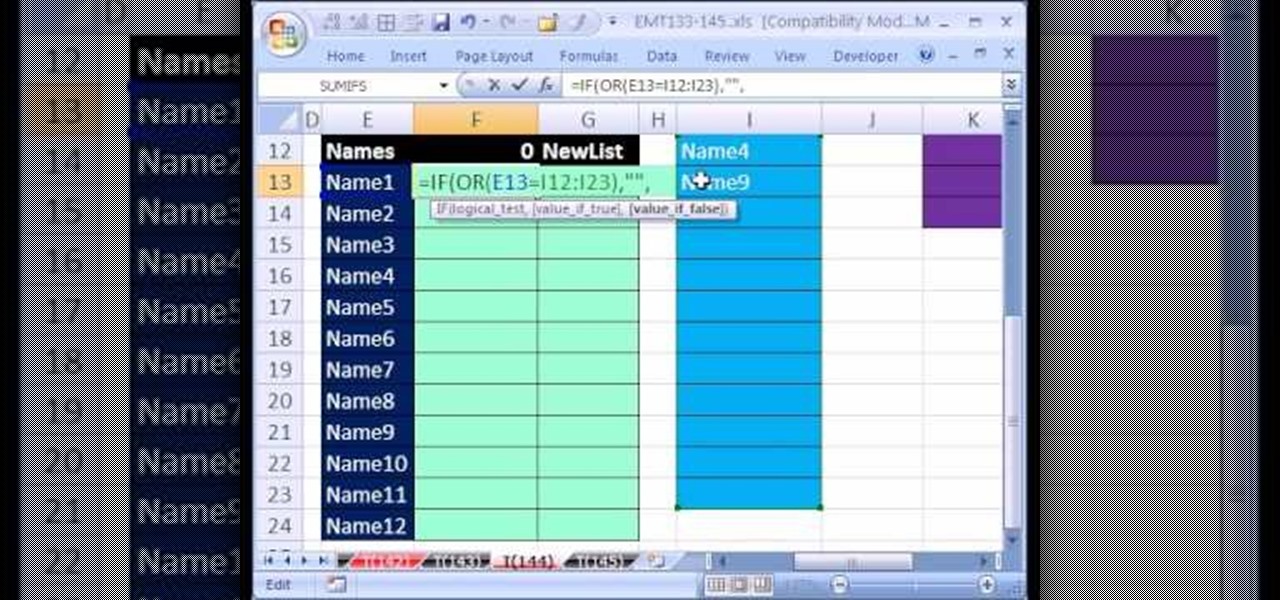
Love Microsoft Excel? This clip contains a tip that just might induce you to. With this free video tutorial from ExcelIsFun, the 144th installment of his "YouTubers Love Excel" or YTLE series of free video MS Excel lessons, you'll learn how to work around data validation's one-rule limit by creating a second shrinking list that looses values as they are used in the data validation area.

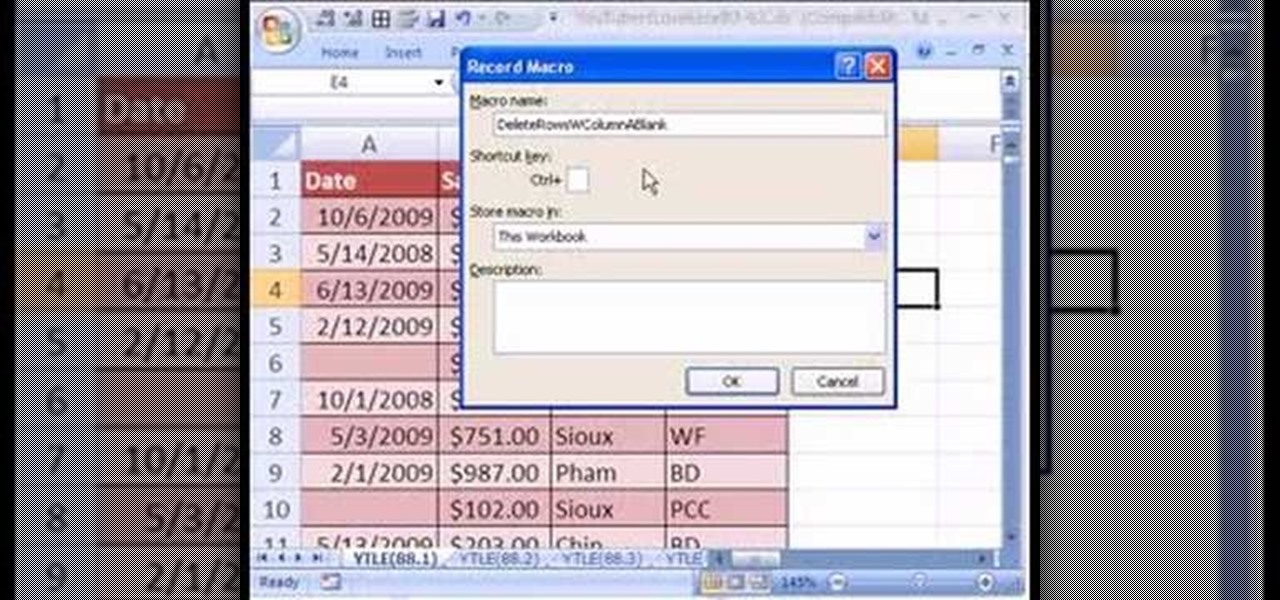
Love Microsoft Excel? This clip contains a tip that just might induce you to. With this free video tutorial from ExcelIsFun, the 88th installment of his "YouTubers Love Excel" or YTLE series of free video MS Excel lessons, you'll learn how to remove rows of a table where the row has a blank in column A using a macro.

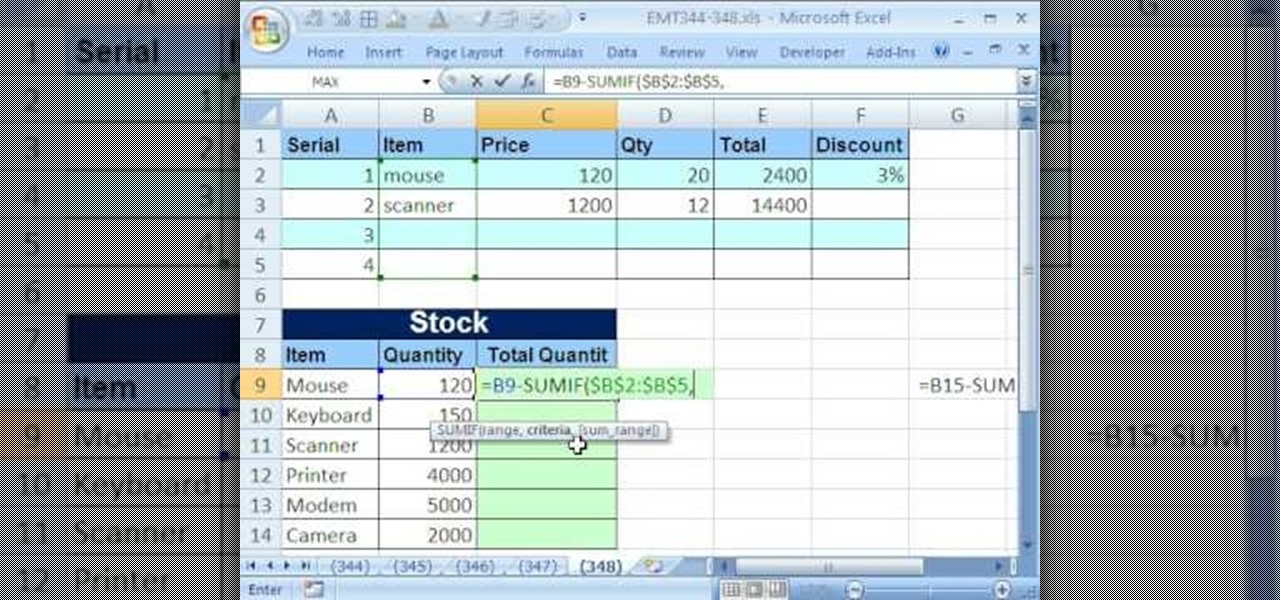
Love Microsoft Excel? This clip contains a tip that just might induce you to. With this free video tutorial from ExcelIsFun, the 348th installment of his "YouTubers Love Excel" or YTLE series of free video MS Excel lessons, you'll learn how to build a formula that will take invoice information for inventory quantity sold and update inventory records to show correct amount on hand (in stock).

Love Microsoft Excel? This clip contains a tip that just might induce you to. With this free video tutorial from ExcelIsFun, the 107th installment of his "YouTubers Love Excel" or YTLE series of free video MS Excel lessons, you'll learn how to use DATE and TIME in the same cell to solve a common time math problem.

Love Microsoft Excel? This clip contains a tip that just might induce you to. With this free video tutorial from ExcelIsFun, the 82nd installment of his "YouTubers Love Excel" or YTLE series of free video MS Excel lessons, you'll learn how to use the UPPER & EXACT functions to create a TRUE/FALSE formula to determine whether or not uppercase text has been entered into a cell.

Love Microsoft Excel? This clip contains a tip that just might induce you to. With this free video tutorial from ExcelIsFun, the 92nd installment of his "YouTubers Love Excel" or YTLE series of free video MS Excel lessons, you'll learn how the AVERAGE function sees zeroes and uses them in calculating an average but does not see blanks.

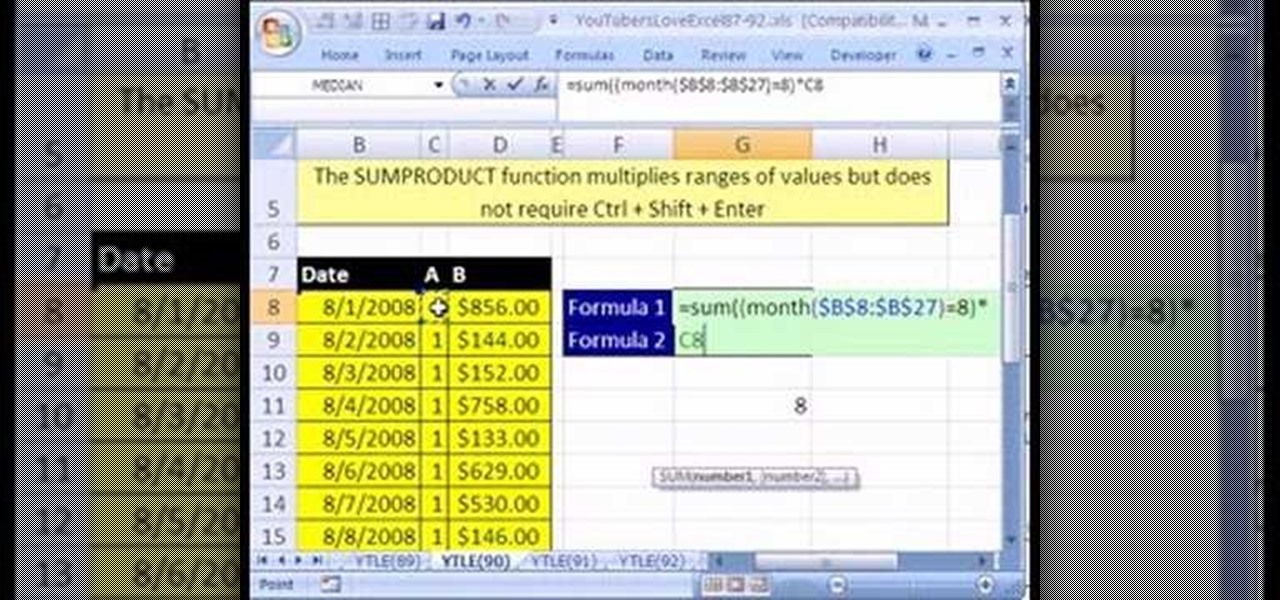
Love Microsoft Excel? This clip contains a tip that just might induce you to. With this free video tutorial from ExcelIsFun, the 90th installment of his "YouTubers Love Excel" or YTLE series of free video MS Excel lessons, you'll see a complicated average calculation with multiple criteria using the MONTH function on a date field. Learn to love digital spreadsheets more perfectly with the tricks outlined in this free Microsoft Office how-to.

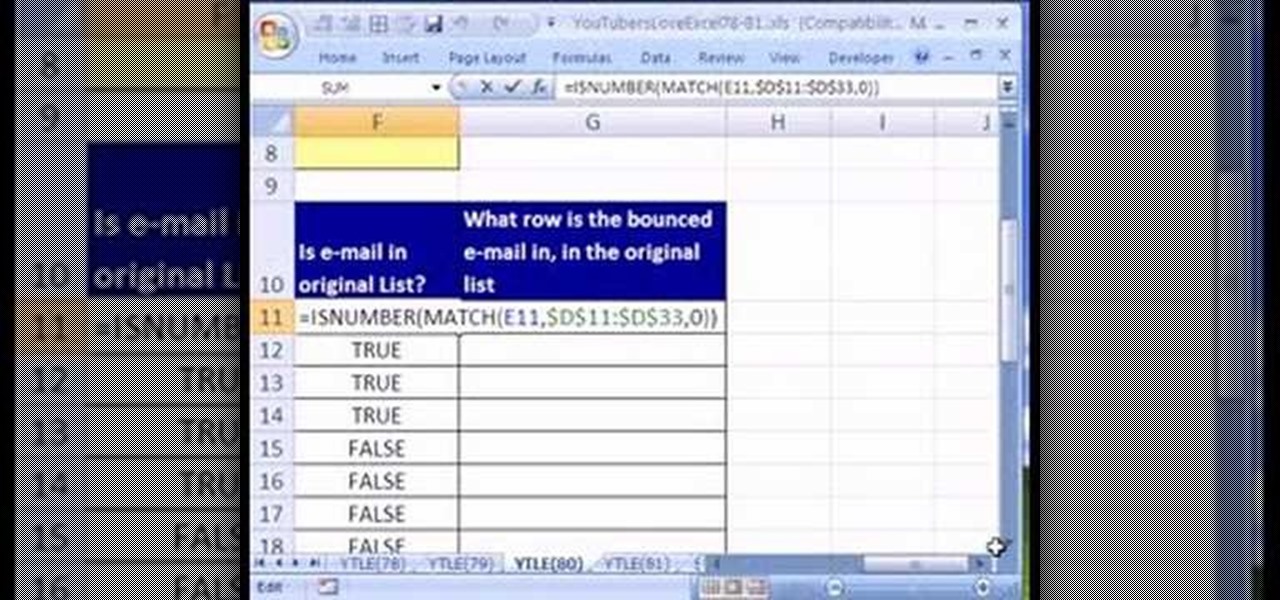
Love Microsoft Excel? This clip contains a tip that just might induce you to. With this free video tutorial from ExcelIsFun, the 80th installment of his "YouTubers Love Excel" or YTLE series of free video MS Excel lessons, you'll learn how to highlight an entire record (row) in a database that matches a bounced email addresss. Learn to love digital spreadsheets more perfectly with the tricks outlined in this free Microsoft Office how-to.

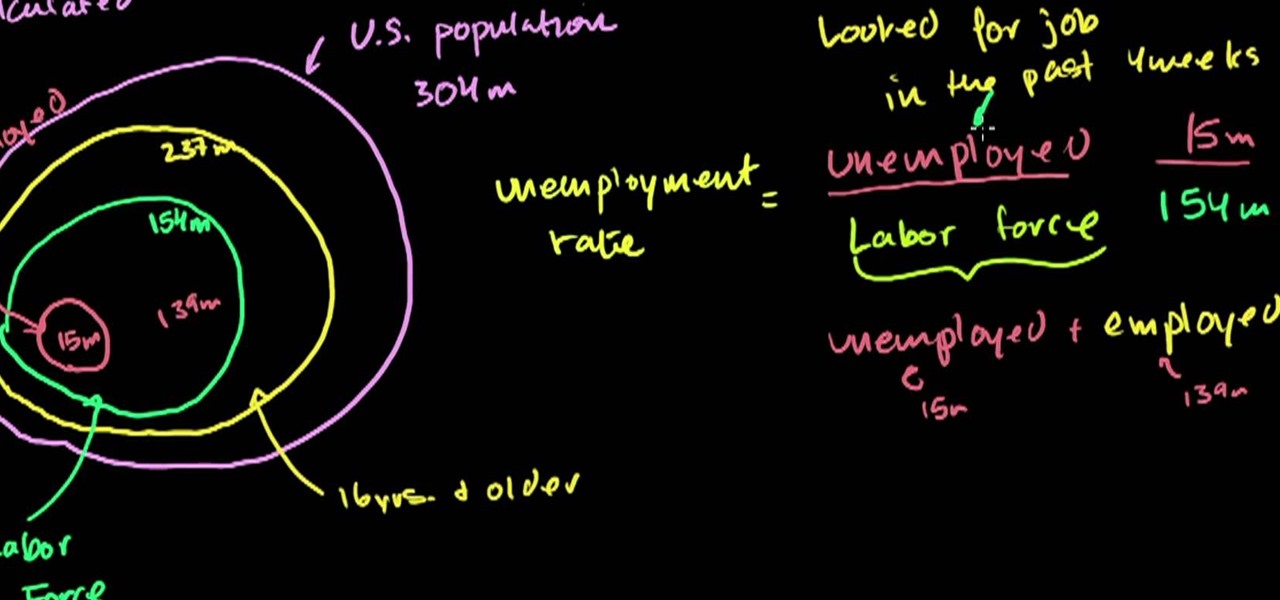
From Ramanujan to calculus co-creator Gottfried Leibniz, many of the world's best and brightest mathematical minds have belonged to autodidacts. And, thanks to the Internet, it's easier than ever to follow in their footsteps (or just study for that next big test). With this installment from Internet pedagogical superstar Salman Khan's series of free math tutorials, you'll learn how to calculate the US unemployment rate given the raw data.

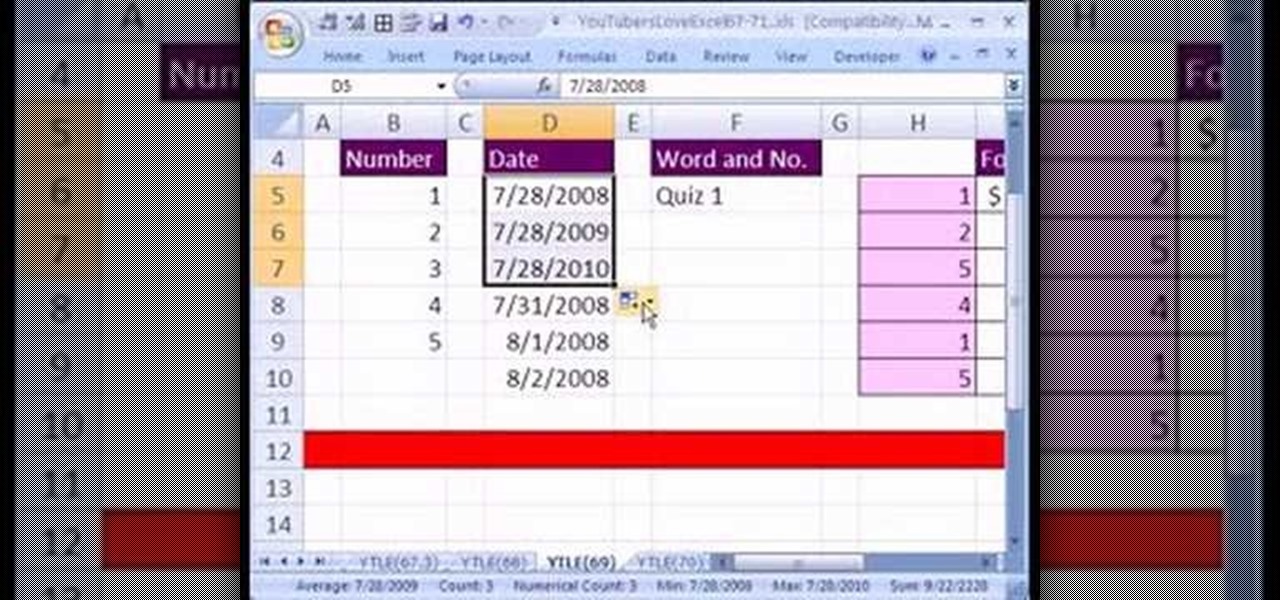
Love Microsoft Excel? This clip contains a tip that just might induce you to. With this free video tutorial from ExcelIsFun, the 69th installment of his "YouTubers Love Excel" or YTLE series of free video MS Excel lessons, you'll learn how to use Excel's Auto Fill tool.

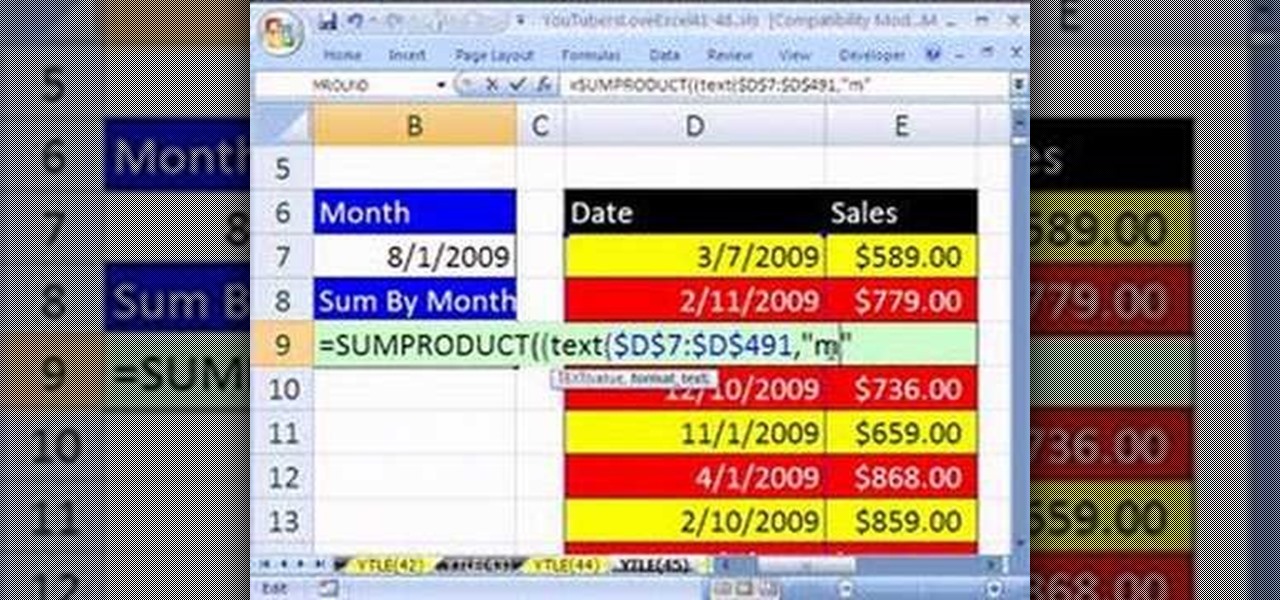
Love Microsoft Excel? This clip contains a tip that just might induce you to. With this free video tutorial from ExcelIsFun, the 45th installment of his "YouTubers Love Excel" or YTLE series of free video MS Excel lessons, you'll learn how to use the SUMPRODUCT & TEXT functions together in 1 formula to sum the month's sales. Learn to love digital spreadsheets more perfectly with the tricks outlined in this free Microsoft Office how-to.

From Ramanujan to calculus co-creator Gottfried Leibniz, many of the world's best and brightest mathematical minds have belonged to autodidacts. And, thanks to the Internet, it's easier than ever to follow in their footsteps (or just study for that next big test). With this installment from Internet pedagogical superstar Salman Khan's series of free math tutorials, you'll learn how to work with radical equations containing invalid or "extraneous" solutions.

From Ramanujan to calculus co-creator Gottfried Leibniz, many of the world's best and brightest mathematical minds have belonged to autodidacts. And, thanks to the Internet, it's easier than ever to follow in their footsteps (or just study for that next big test). With this installment from Internet pedagogical superstar Salman Khan's series of free math tutorials, you'll learn how to create a simple histogram chart.

From Ramanujan to calculus co-creator Gottfried Leibniz, many of the world's best and brightest mathematical minds have belonged to autodidacts. And, thanks to the Internet, it's easier than ever to follow in their footsteps. With this installment from Internet pedagogical superstar Salman Khan's series of free math tutorials, you'll learn how to visualize statistical data with a hand-drawn stem-and-leaf chart.

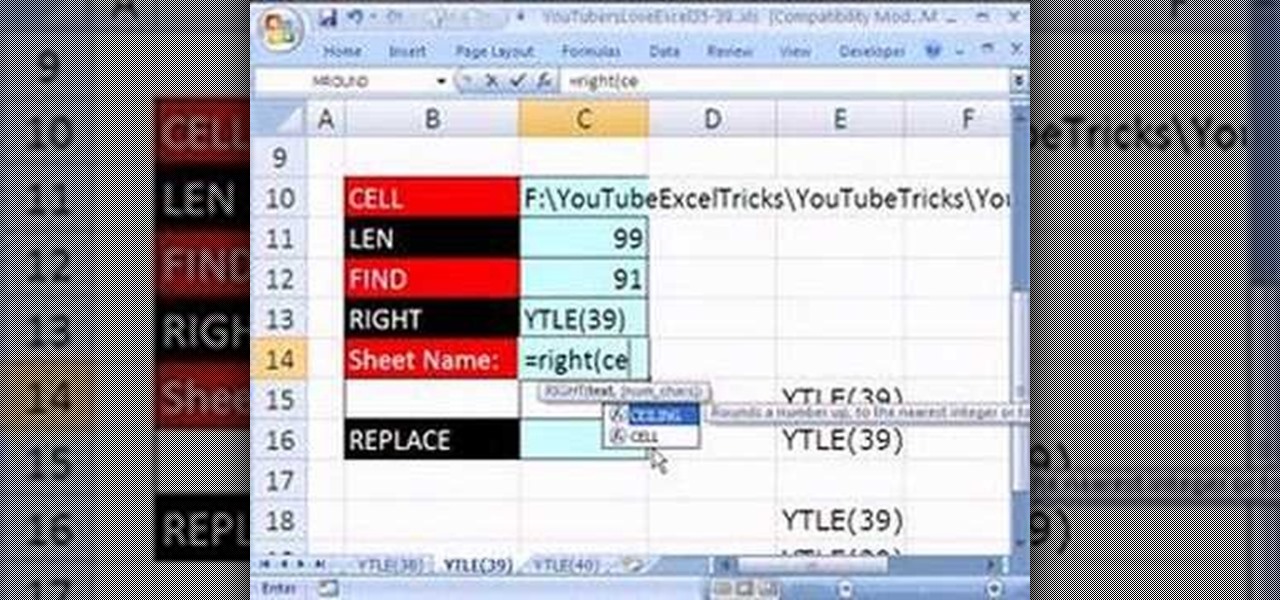
Love Microsoft Excel? This clip contains a tip that just might induce you to. With this free video tutorial from ExcelIsFun, the 39th installment of his "YouTubers Love Excel" or YTLE series of free video MS Excel lessons, you'll learn how to use the RIGHT, LEN, FIND & REPLACE functions in a formula to deliver a sheet tab name to a cell!

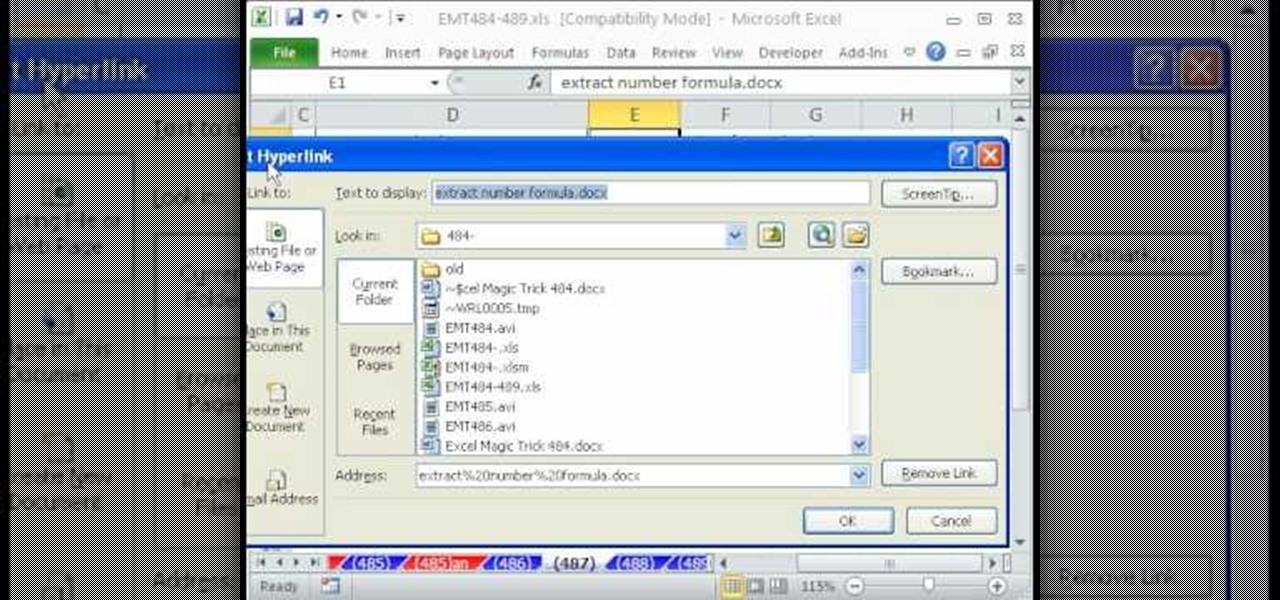
New to Microsoft Excel? Looking for a tip? How about a tip so mind-blowingly useful as to qualify as a magic trick? You're in luck. In this MS Excel tutorial from ExcelIsFun, the 487th installment in their series of digital spreadsheet magic tricks, you'll learn how to use a hyperlink to open a different workbook, file or sheet within the existing workbook.

New to Microsoft Excel? Looking for a tip? How about a tip so mind-blowingly useful as to qualify as a magic trick? You're in luck. In this MS Excel tutorial from ExcelIsFun, the 519th installment in their series of digital spreadsheet magic tricks, you'll learn how to use the FIND and REPLACE functions in Microsoft Excel.

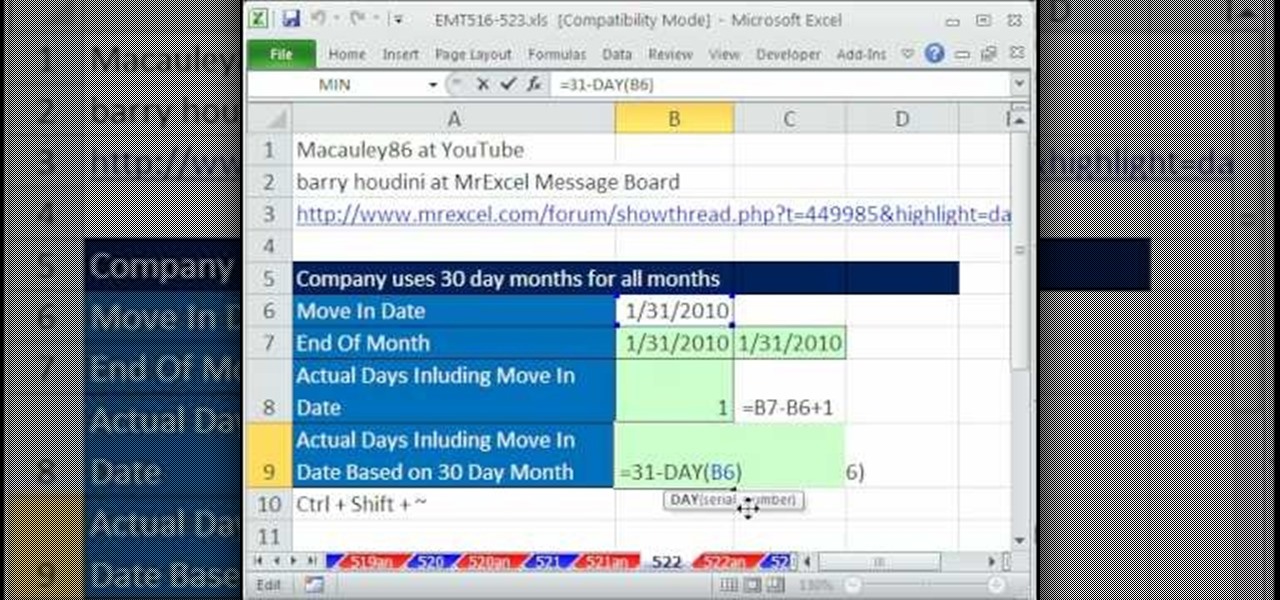
New to Microsoft Excel? Looking for a tip? How about a tip so mind-blowingly useful as to qualify as a magic trick? You're in luck. In this MS Excel tutorial from ExcelIsFun, the 522nd installment in their series of digital spreadsheet magic tricks, you'll learn how to make calculations for companies that use 30 day months.

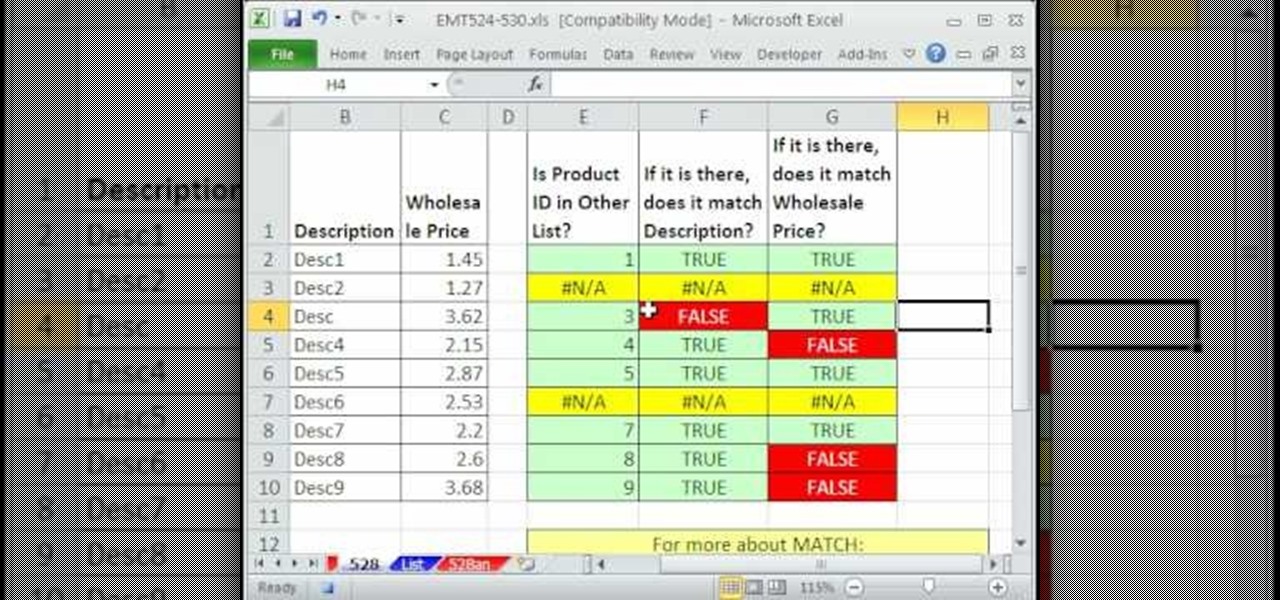
New to Microsoft Excel? Looking for a tip? How about a tip so mind-blowingly useful as to qualify as a magic trick? You're in luck. In this MS Excel tutorial from ExcelIsFun, the 528th installment in their series of digital spreadsheet magic tricks, you'll learn how to check two data sets (lists & tables) to see if there are discrepancies using the MATCH and VLOOKUP functions.

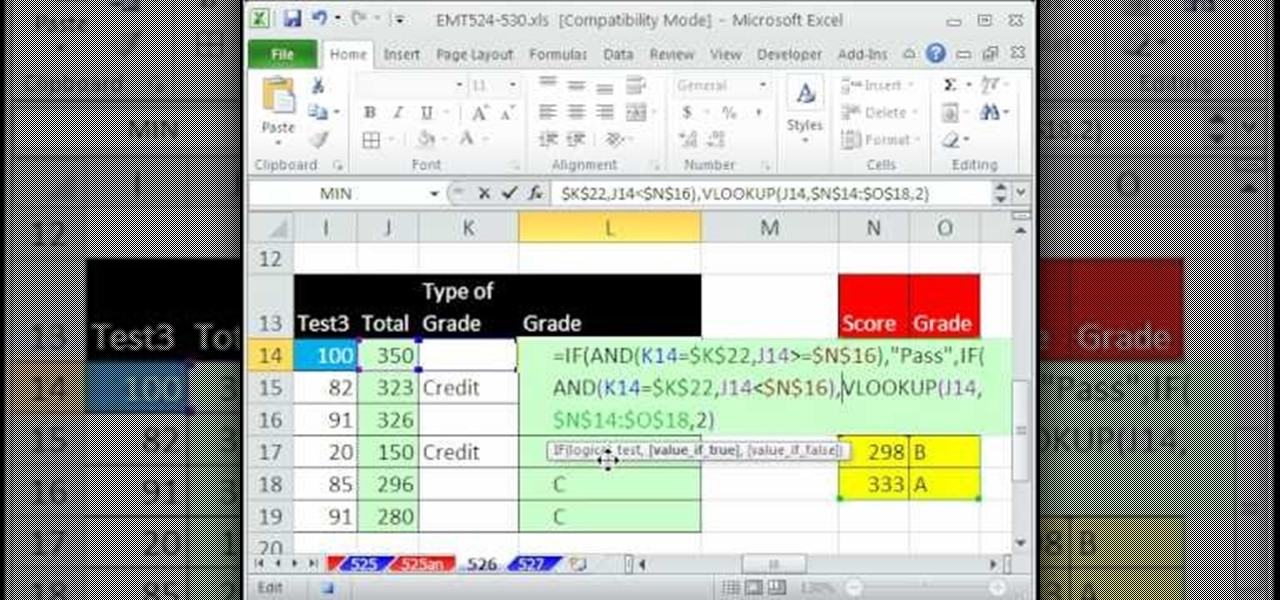
New to Microsoft Excel? Looking for a tip? How about a tip so mind-blowingly useful as to qualify as a magic trick? You're in luck. In this MS Excel tutorial from ExcelIsFun, the 529th installment in their series of digital spreadsheet magic tricks, you'll learn how to create a pass-fail grading formula using the IF and AND and VLOOKUP functions.

New to Microsoft Excel? Looking for a tip? How about a tip so mind-blowingly useful as to qualify as a magic trick? You're in luck. In this MS Excel tutorial from ExcelIsFun, the 536th installment in their series of digital spreadsheet magic tricks, you'll learn how to list all modes in a given multimodal data set using Excel 2010's MODE.MULT function.

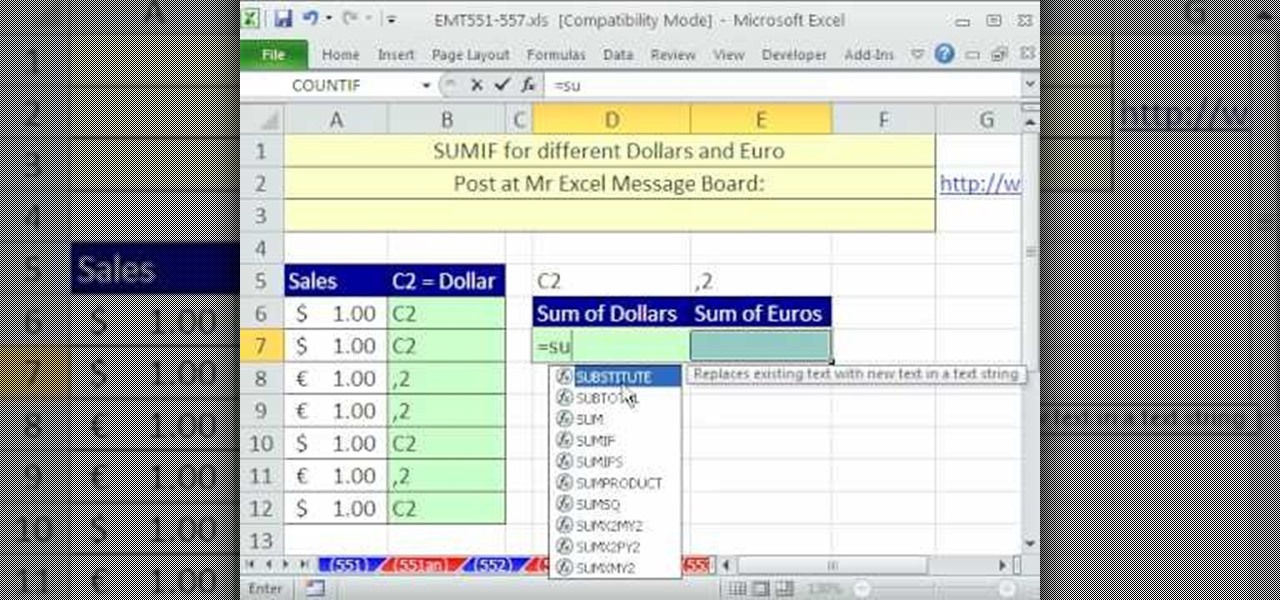
New to Microsoft Excel? Looking for a tip? How about a tip so mind-blowingly useful as to qualify as a magic trick? You're in luck. In this MS Excel tutorial from ExcelIsFun, the 553rd installment in their series of digital spreadsheet magic tricks, you'll learn how to use the CELL and SUMIF functions to sum Dollar and Euro amounts from a column.

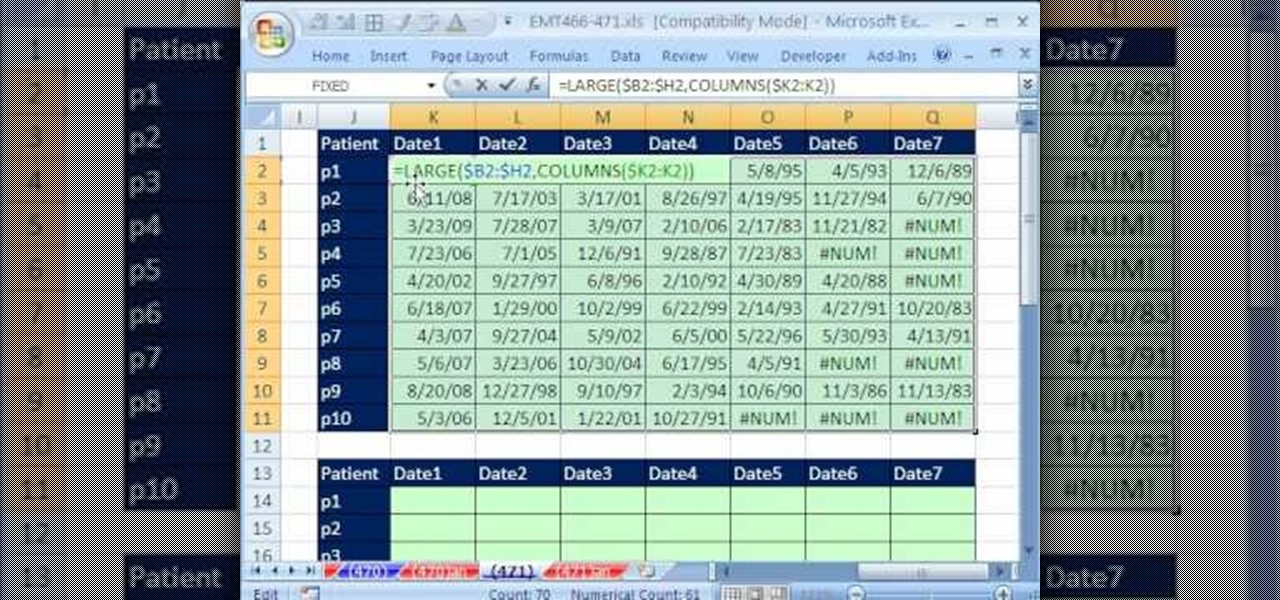
New to Microsoft Excel? Looking for a tip? How about a tip so mind-blowingly useful as to qualify as a magic trick? You're in luck. In this MS Excel tutorial from ExcelIsFun, the 471st installment in their series of digital spreadsheet magic tricks, you'll learn how to sort horizontally with 3 different formulas that use the LARGE, SMALL, COLUMNS, IFERROR and IF functions.


