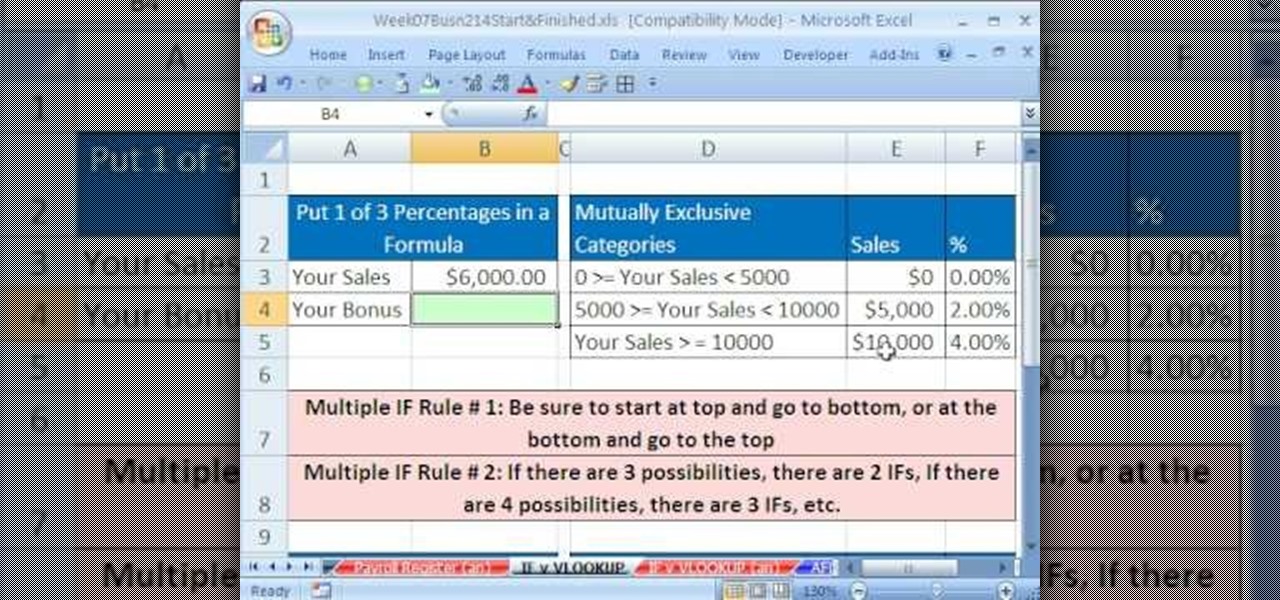
hether you're interested in learning Microsoft Excel from the bottom up or just looking to pick up a few tips and tricks, you've come to the right place. In this tutorial from everyone's favorite digital spreadsheet guru, ExcelIsFun, the 35th installment in his "Highline Excel Class" series of free video Excel lessons, you'll see an efficient IF function formula get beat by an even more efficient VLOOKUP function formula.
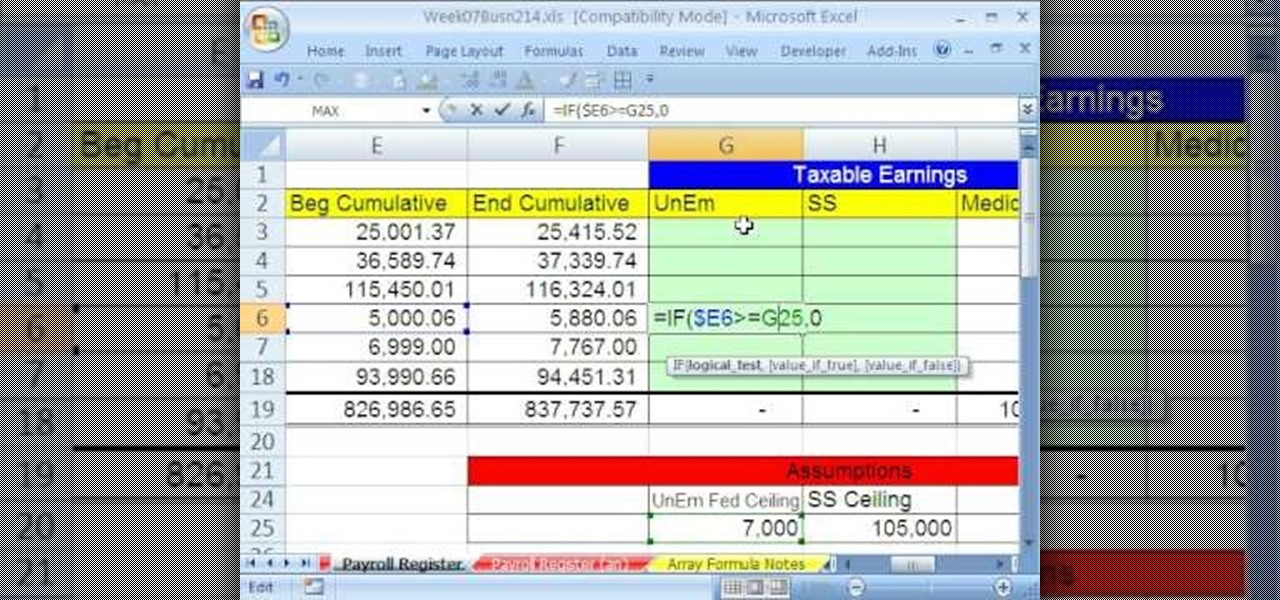
Whether you're interested in learning Microsoft Excel from the bottom up or just looking to pick up a few tips and tricks, you've come to the right place. In this tutorial from everyone's favorite digital spreadsheet guru, ExcelIsFun, the 34th installment in his "Highline Excel Class" series of free video Excel lessons, you'll learn how to create a formula that will calculate the taxable earnings for a payroll period when there are ceilings (hurdles maximum) for taxable earnings (above which ...

Whether you're interested in learning Microsoft Excel from the bottom up or just looking to pick up a few tips and tricks, you've come to the right place. In this tutorial from everyone's favorite digital spreadsheet guru, ExcelIsFun, the 9th installment in his "Highline Excel Class" series of free video Excel lessons, you'll see three examples using the SUMIF function to do conditional summing.
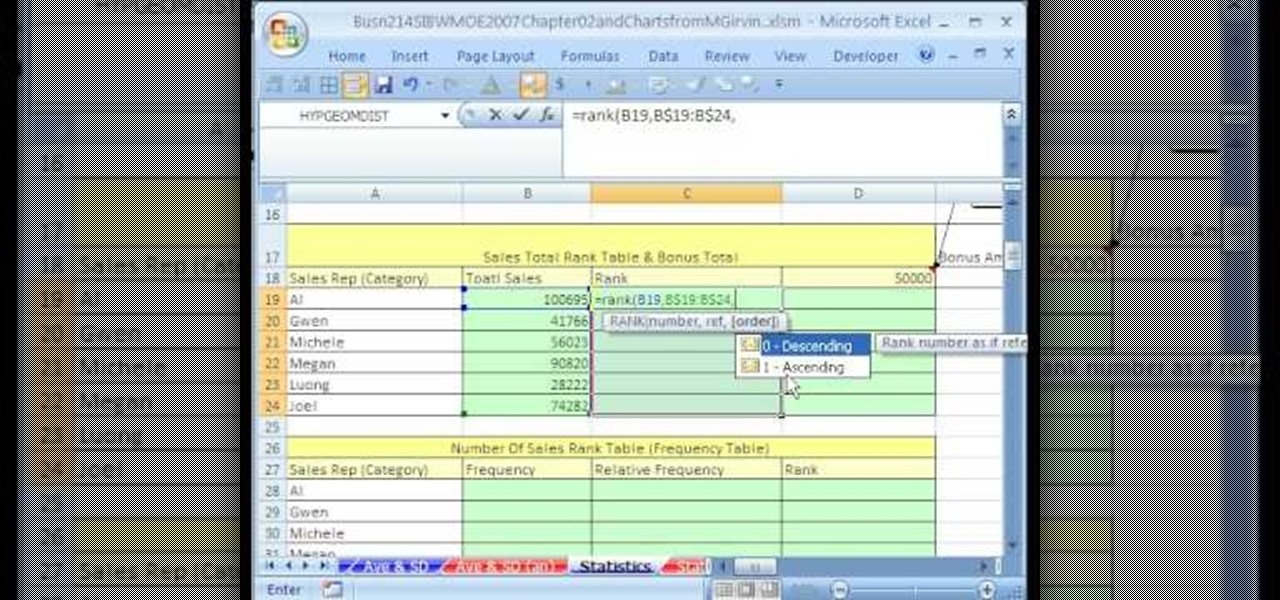
Whether you're interested in learning Microsoft Excel from the bottom up or just looking to pick up a few tips and tricks, you've come to the right place. In this tutorial from everyone's favorite digital spreadsheet guru, ExcelIsFun, the 30th installment in his "Highline Excel Class" series of free video Excel lessons, you'll learn how to use the SUMIF function to add with one criteria, the RANK function to rank highest values to lowest values (one to five) and the IF function to assign a bo...
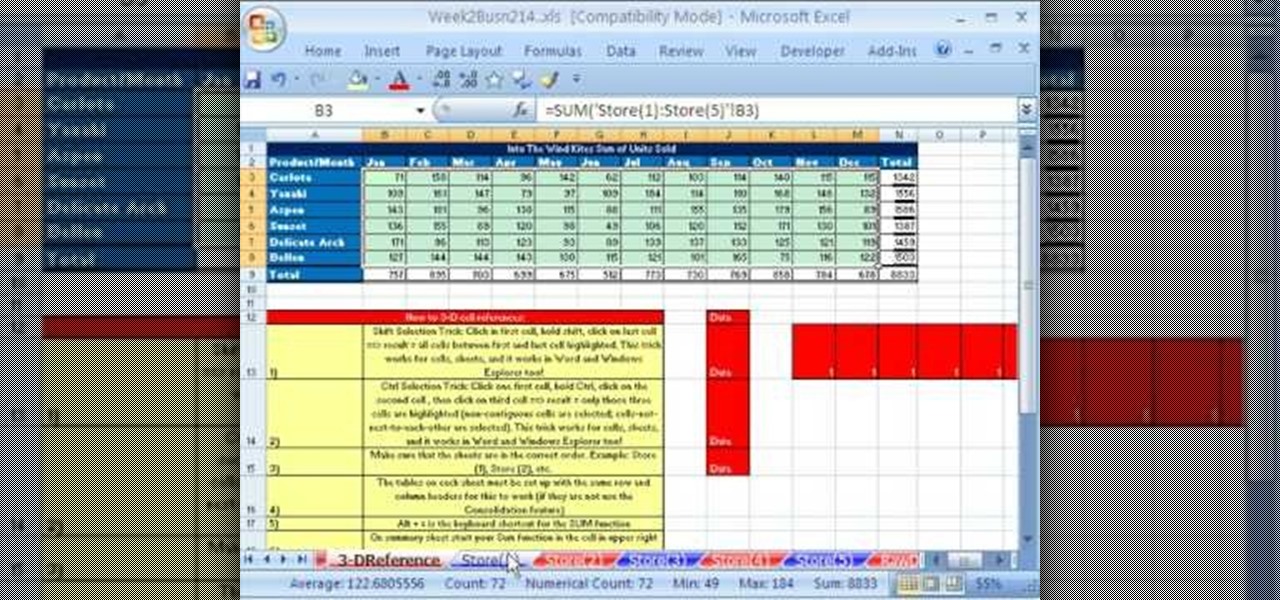
Whether you're interested in learning Microsoft Excel from the bottom up or just looking to pick up a few tips and tricks, you're in the right place. In this tutorial from everyone's favorite digital spreadsheet guru, ExcelIsFun, the 8th installment in his "Highline Excel Class" series of free video Excel lessons, you'll learn how to add across sheets using 3-D cell References and the SUM function.
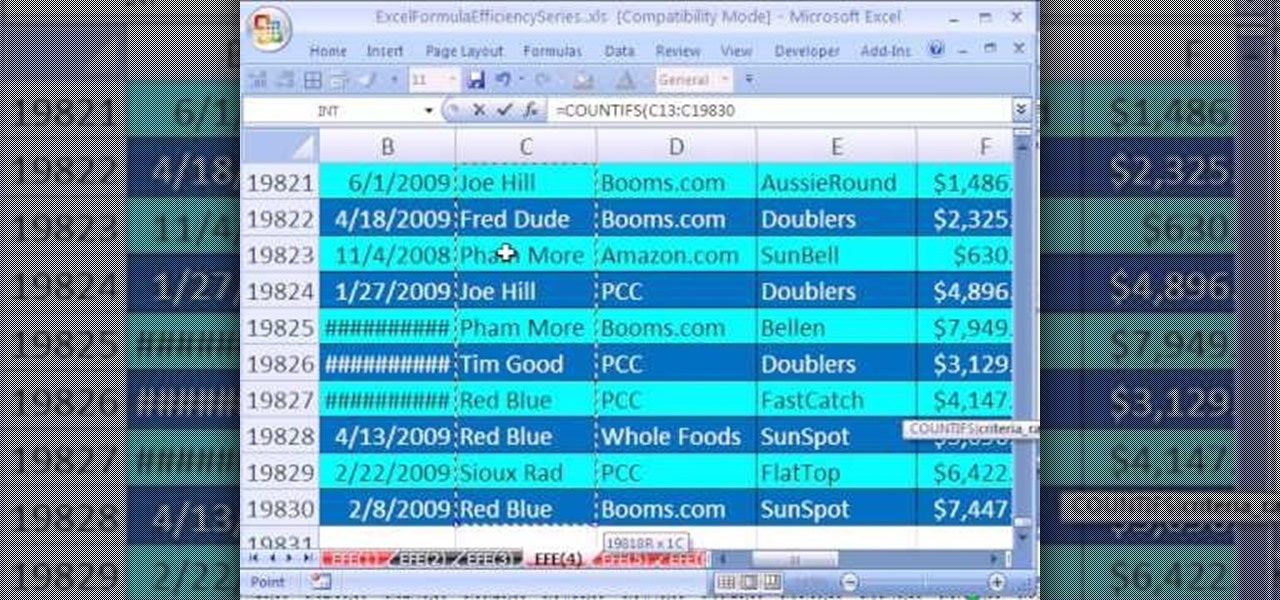
Are you looking for a way to make your Microsoft Excel formulas simpler, faster and more efficient? If so, you're in the right place. With this free video lesson from everyone's favorite digital spreadsheet guru, YouTube's ExcelsFun, the 7th installment in his "Excel Formula Efficiency" series, you'll learn about the SUMIFS function and how it blows SUMPRODUCT away when it comes to calculation speed.

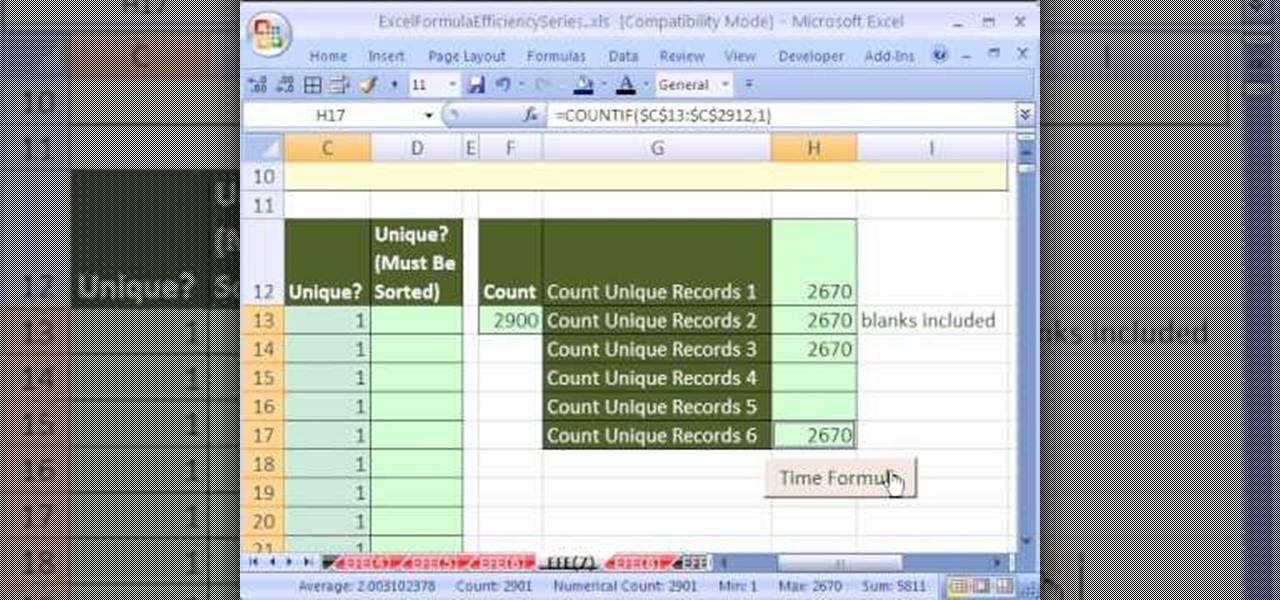
Are you looking for a way to make your Microsoft Excel formulas simpler, faster and more efficient? If so, you're in the right place. With this free video lesson from everyone's favorite digital spreadsheet guru, YouTube's ExcelsFun, the 7th installment in his "Excel Formula Efficiency" series, you'll learn how to count unique records with a formula with a helper column to speed up calculations.

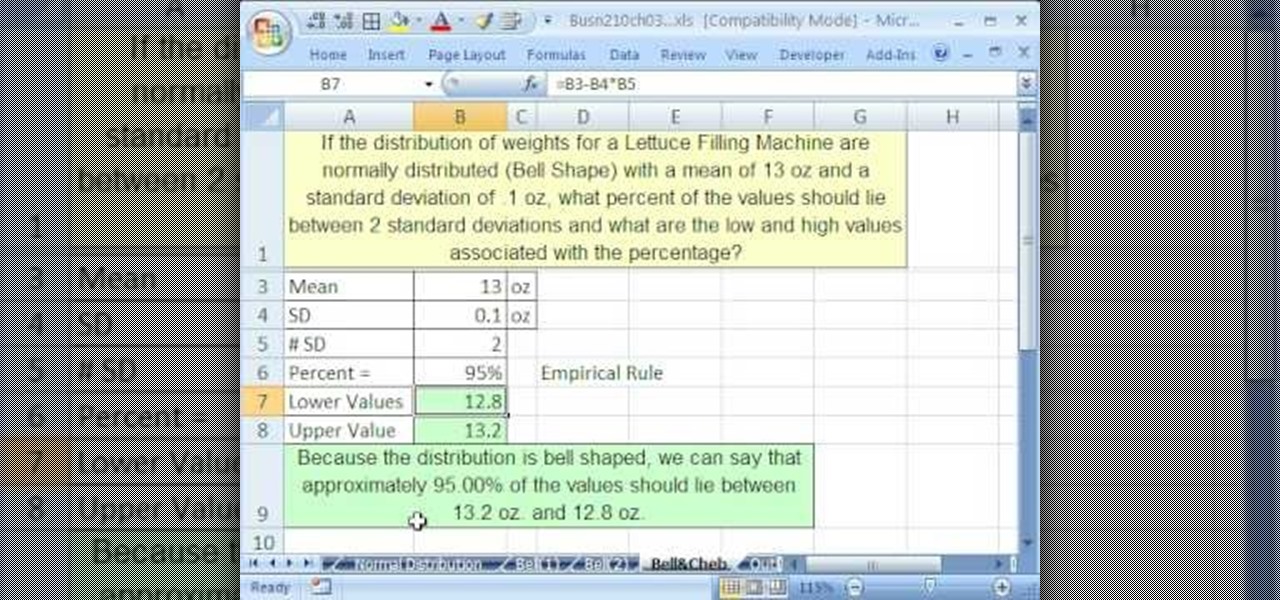
If you use Microsoft Excel on a regular basis, odds are you work with numbers. Put those numbers to work. Statistical analysis allows you to find patterns, trends and probabilities within your data. In this MS Excel tutorial from everyone's favorite Excel guru, YouTube's ExcelsFun, the 48th installment in his "Excel Statistics" series of free video lessons, you'll see comparison of Chebyshev's Theorem and the Empirical Rule (bell curve) and learn when to apply which.

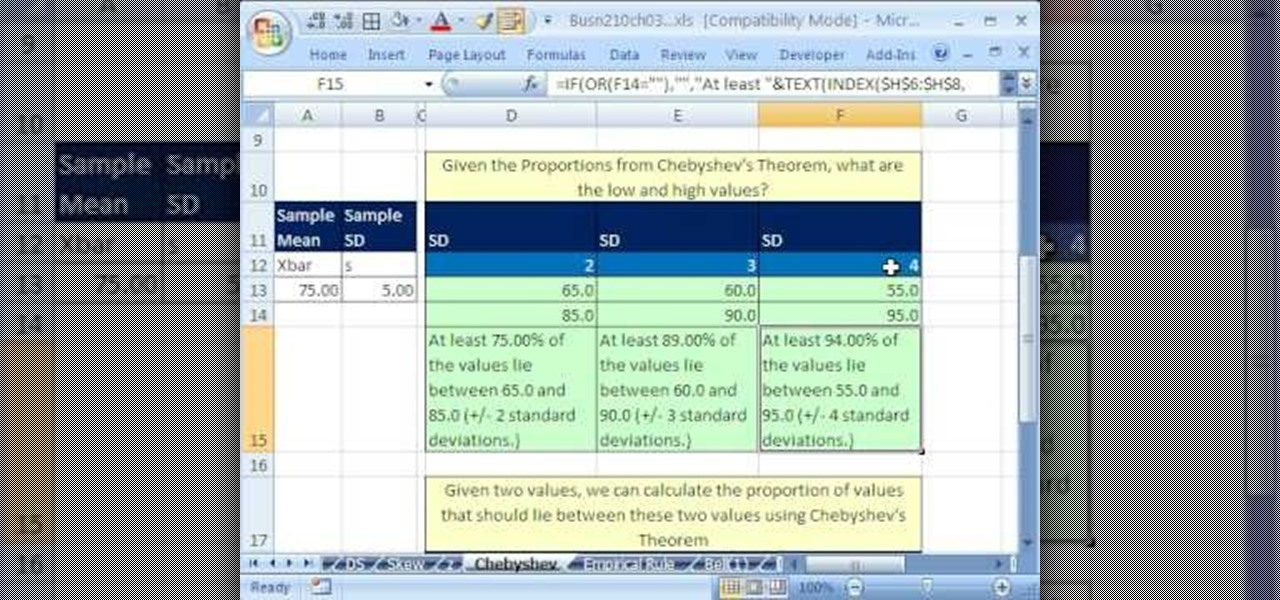
If you use Microsoft Excel on a regular basis, odds are you work with numbers. Put those numbers to work. Statistical analysis allows you to find patterns, trends and probabilities within your data. In this MS Excel tutorial from everyone's favorite Excel guru, YouTube's ExcelsFun, the 46th installment in his "Excel Statistics" series of free video lessons, you'll learn about Chebyshev's Theorem and how to apply it in three different ways.

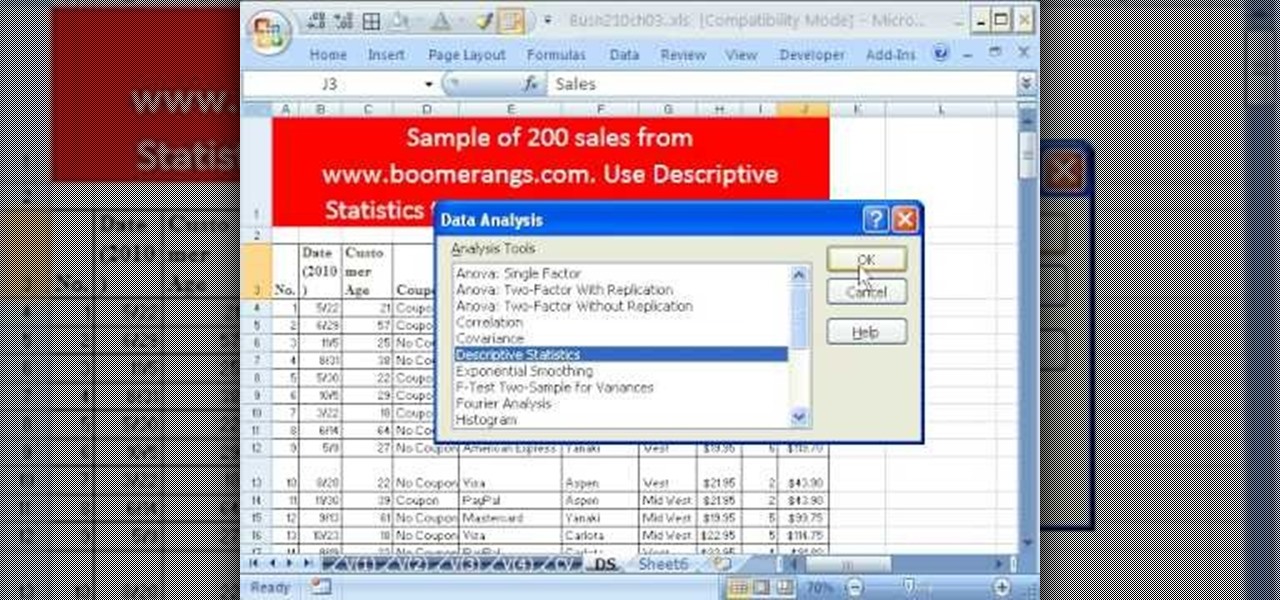
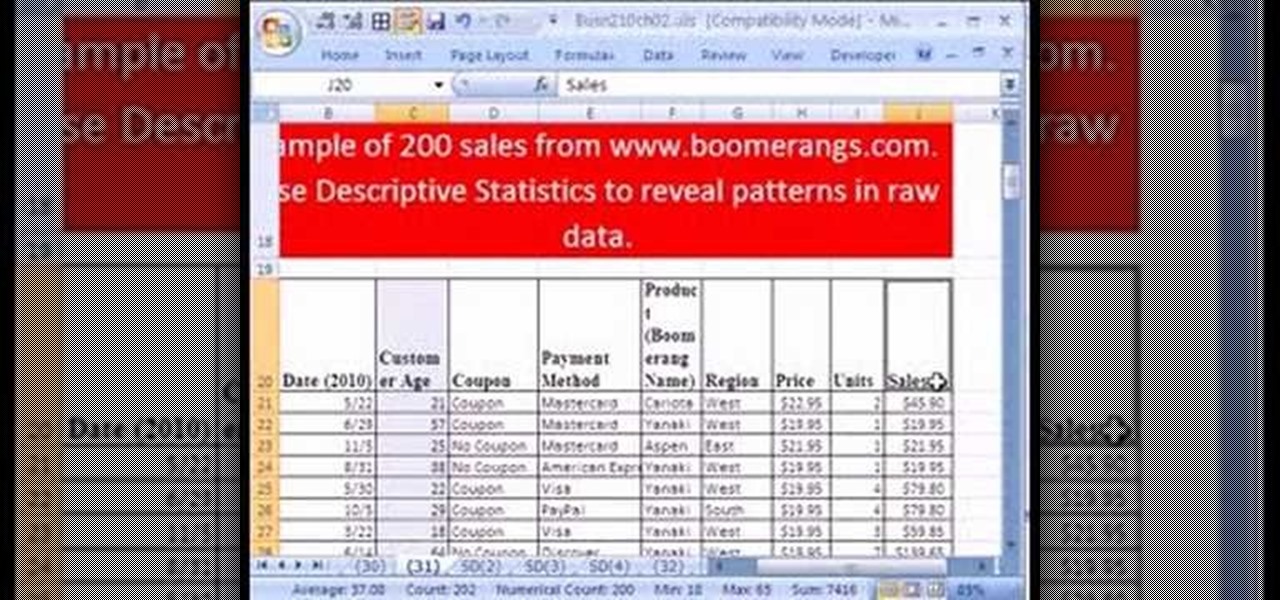
If you use Microsoft Excel on a regular basis, odds are you work with numbers. Put those numbers to work. Statistical analysis allows you to find patterns, trends and probabilities within your data. In this MS Excel tutorial from everyone's favorite Excel guru, YouTube's ExcelsFun, the 43rd installment in his "Excel Statistics" series of free video lessons, you'll learn how to use the Excel Data Analysis add-in descriptive statistics tool.

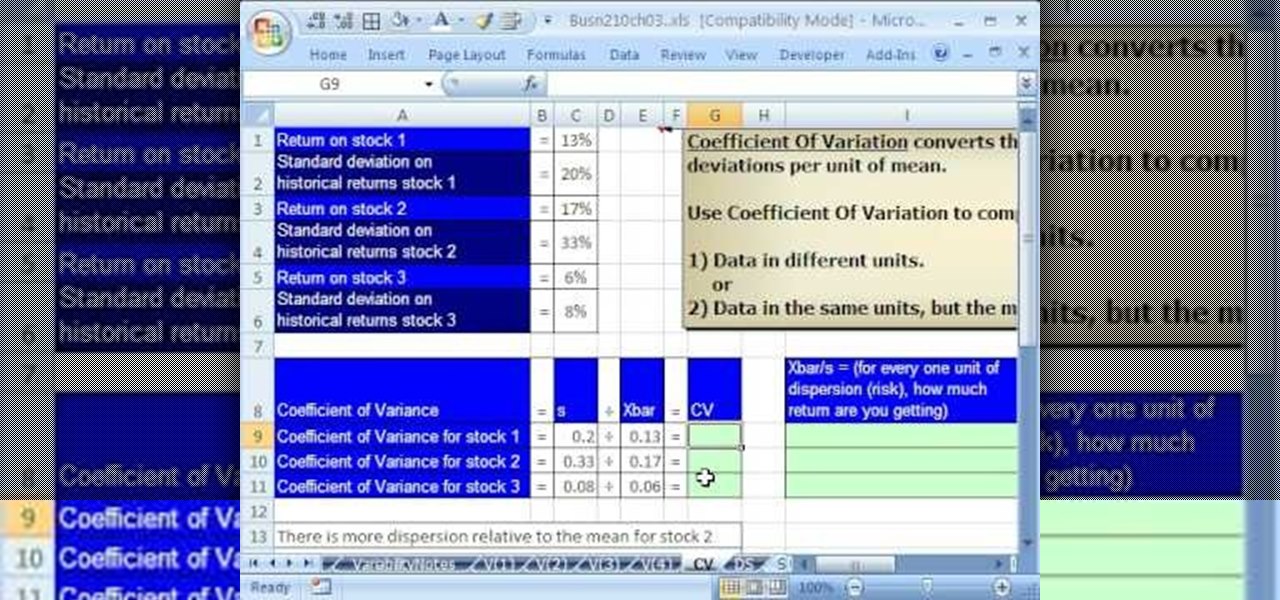
If you use Microsoft Excel on a regular basis, odds are you work with numbers. Put those numbers to work. Statistical analysis allows you to find patterns, trends and probabilities within your data. In this MS Excel tutorial from everyone's favorite Excel guru, YouTube's ExcelsFun, the 42nd installment in his "Excel Statistics" series of free video lessons, you'll learn how to calculate the coefficient of variation.

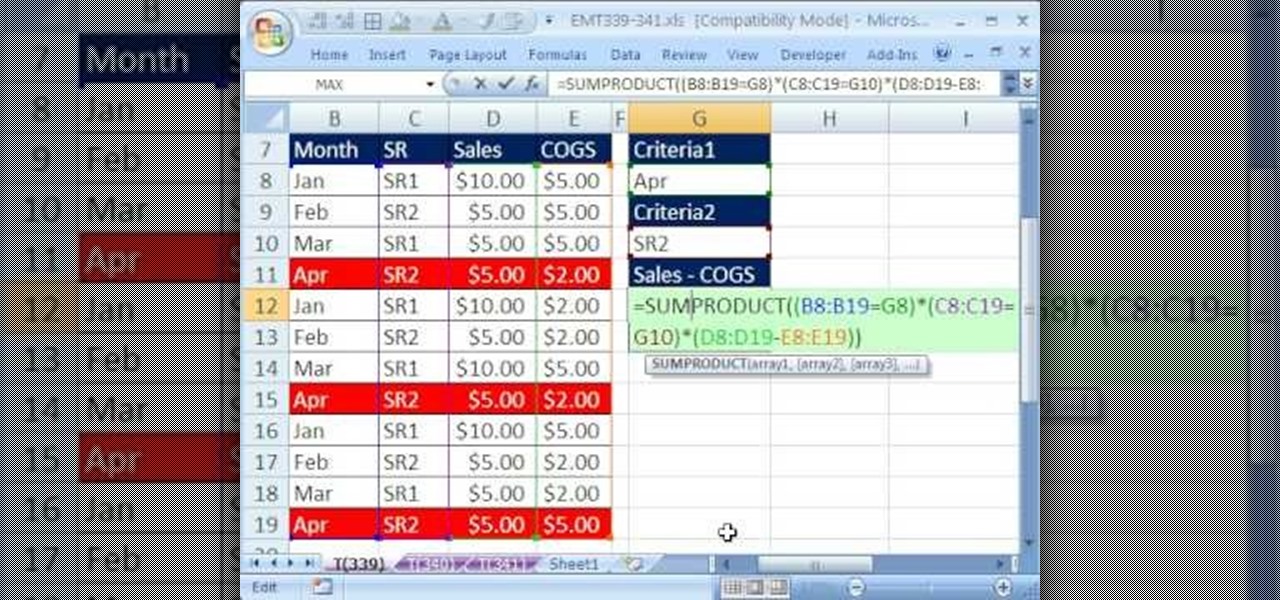
New to Microsoft Excel? Looking for a tip? How about a tip so mind-blowingly useful as to qualify as a magic trick? You're in luck. In this MS Excel tutorial from ExcelIsFun, the 339th installment in their series of digital spreadsheet magic tricks, you'll learn how to use the SUMPRODUCT function to add the difference between two columns of numbers based on two criteria.

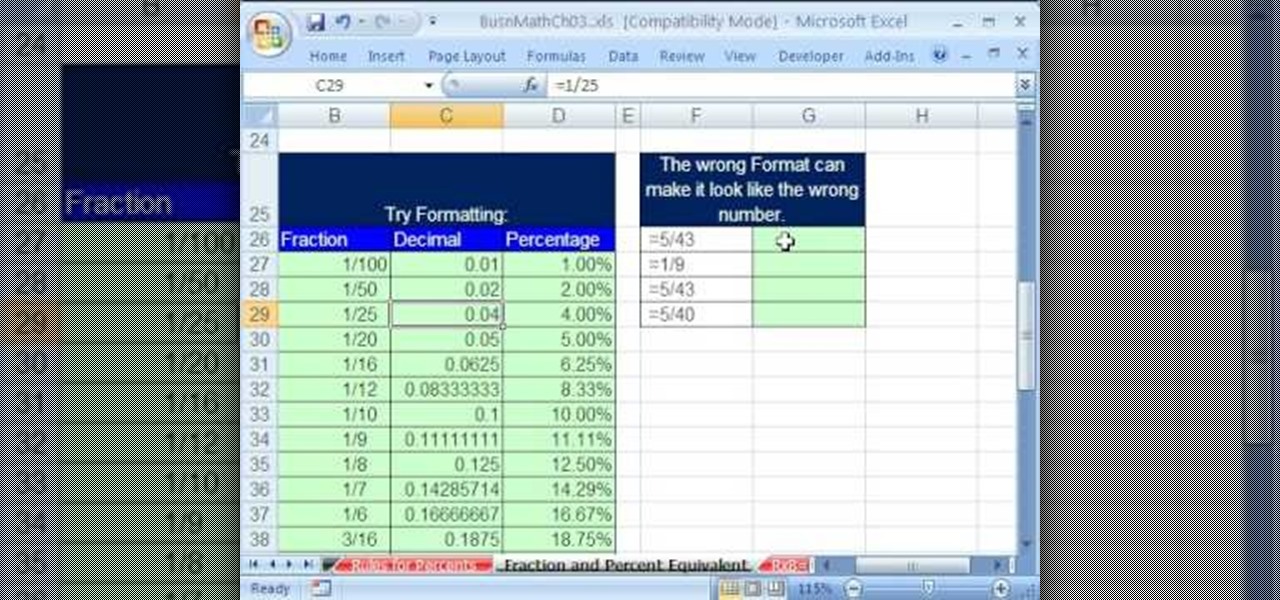
As you might guess, one of the domains in which Microsoft Excel really excels is business math. Brush up on the stuff for your next or current job with this how-to. In this tutorial from everyone's favorite digital spreadsheet guru, YouTube's ExcelIsFun, the 24th installment in his "Excel Business Math" series of free video lessons, you'll learn how to build a table of decimal, fraction and percent equivalents. See how fractional formatting can be misleading.

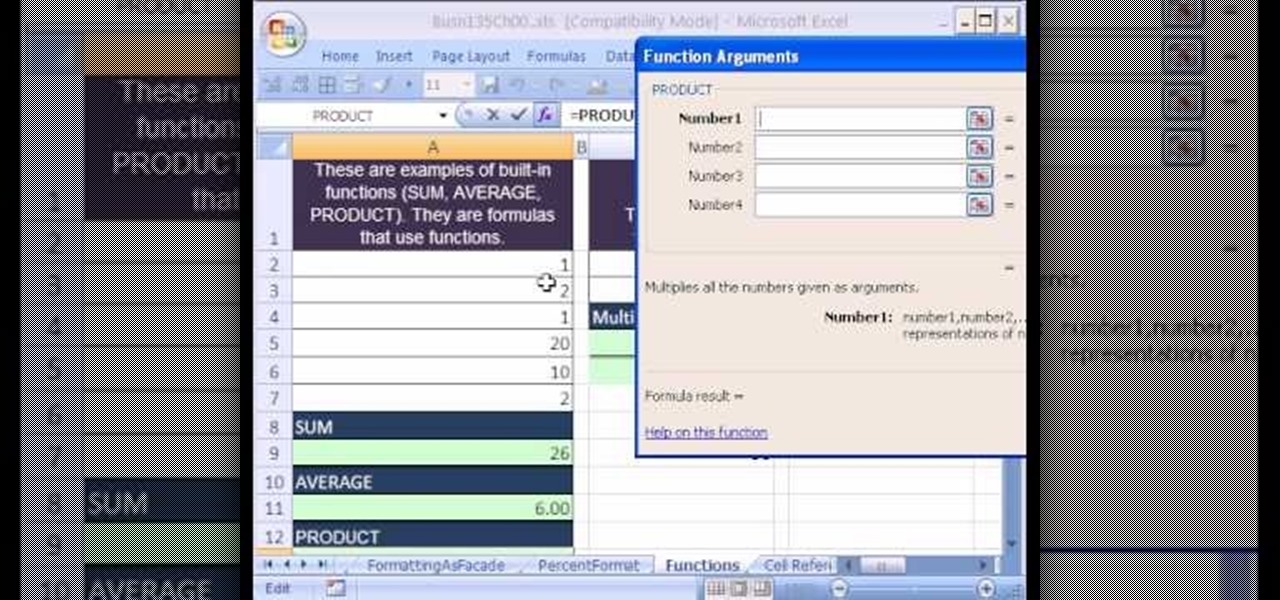
As you might guess, one of the domains in which Microsoft Excel really excels is business math. Brush up on the stuff for your next or current job with this how-to. In this tutorial from everyone's favorite digital spreadsheet guru, YouTube's ExcelIsFun, the 5th installment in his "Excel Business Math" series of free video lessons, you'll learn how to use Excel's built-in SUM, AVERAGE, PRODUCT, LCM, QUOTIENT and MOD functions.

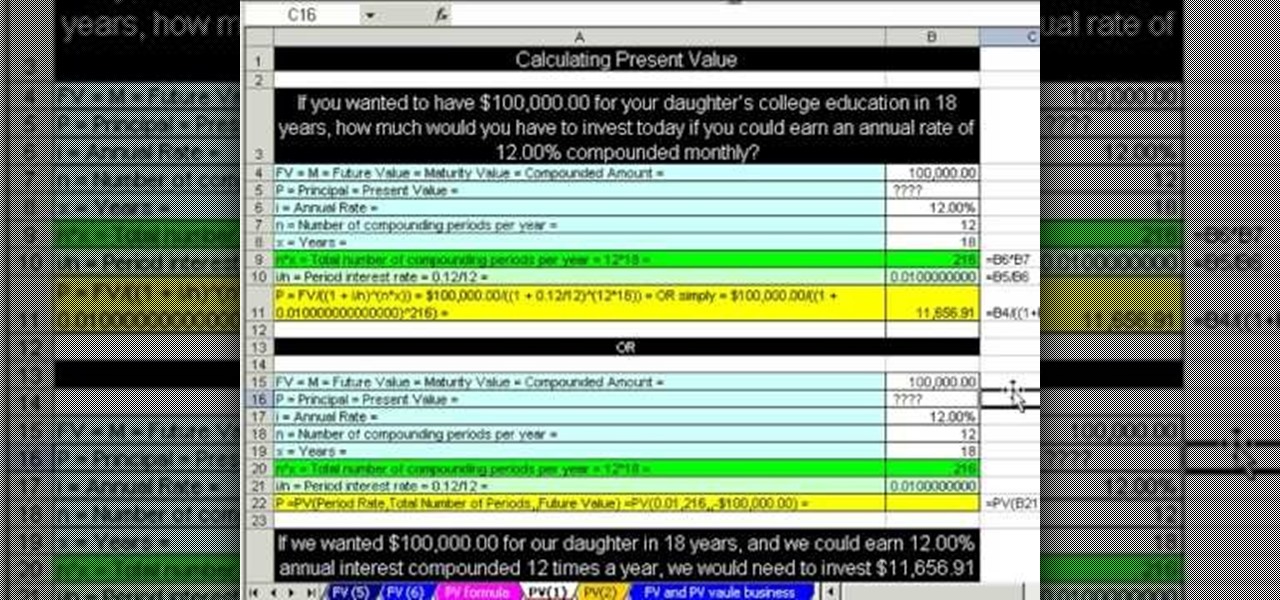
As you might guess, one of the domains in which Microsoft Excel really excels is business math. Brush up on the stuff for your next or current job with this how-to. In this tutorial from everyone's favorite digital spreadsheet guru, YouTube's ExcelIsFun, the 58th installment in his "Excel Business Math" series of free video lessons, you'll learn how to make simple value calculations for the present.

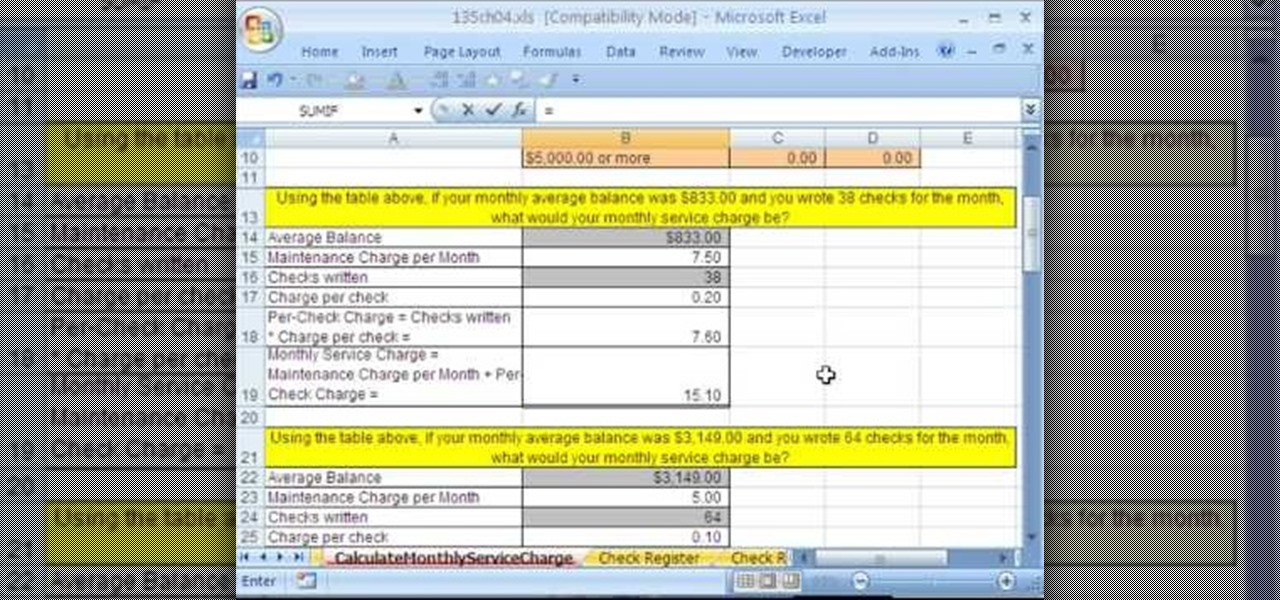
As you might guess, one of the domains in which Microsoft Excel really excels is business math. Brush up on the stuff for your next or current job with this how-to. In this tutorial from everyone's favorite digital spreadsheet guru, YouTube's ExcelIsFun, the 35th installment in his "Excel Business Math" series of free video lessons, you'll learn how to calculate the service charge for a checking account and see how to create a formula for the balance in a checkbook or checking register.

As you might guess, one of the domains in which Microsoft Excel really excels is business math. Brush up on the stuff for your next or current job with this how-to. In this tutorial from everyone's favorite digital spreadsheet guru, YouTube's ExcelIsFun, the 34th installment in his "Excel Business Math" series of free video lessons, you'll learn how to work with the various elements of bank checks in Microsoft Excel.

Looking for a primer on how to create and work with array formulas in Microsoft Office Excel? You've come to the right place. In this free video tutorial from everyone's favorite MS Excel guru, YouTube's ExcelIsFun, the 15th installment in his series of Excel array formula series, you'll learn how to set up, solve and write conclusions for larger-sized mathematical word problems.

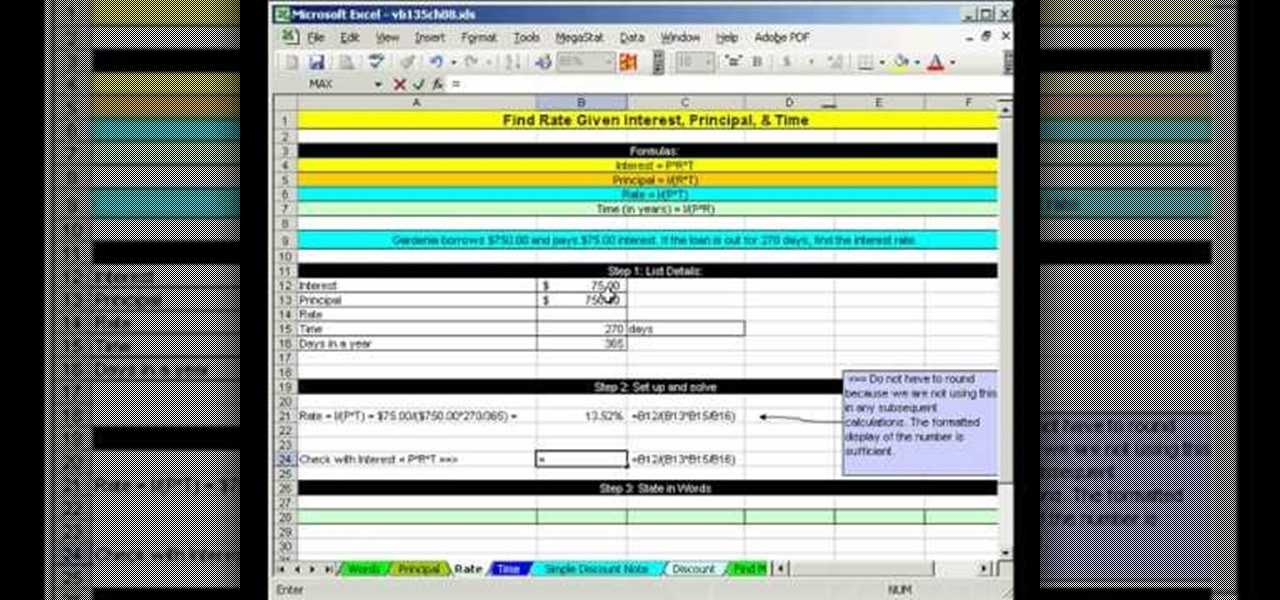
As you might guess, one of the domains in which Microsoft Excel really excels is business math. Brush up on the stuff for your next or current job with this how-to. In this tutorial from everyone's favorite digital spreadsheet guru, YouTube's ExcelIsFun, the 54th installment in his "Business Math" series of free video lessons, you'll learn how to solve a simple interest loan problem for part, base, or rate.

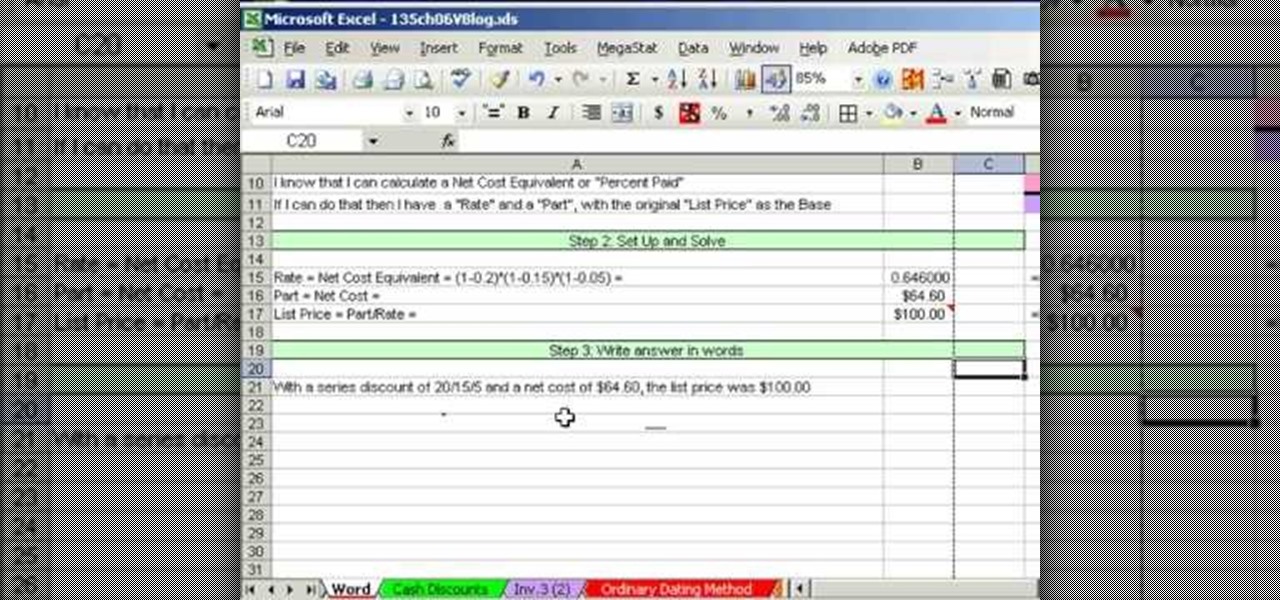
As you might guess, one of the domains in which Microsoft Excel really excels is business math. Brush up on the stuff for your next or current job with this how-to. In this tutorial from everyone's favorite digital spreadsheet guru, YouTube's ExcelIsFun, the 45th installment in his "Business Math" series of free video lessons, you'll learn when to solve a trade discount word problem with Excel.

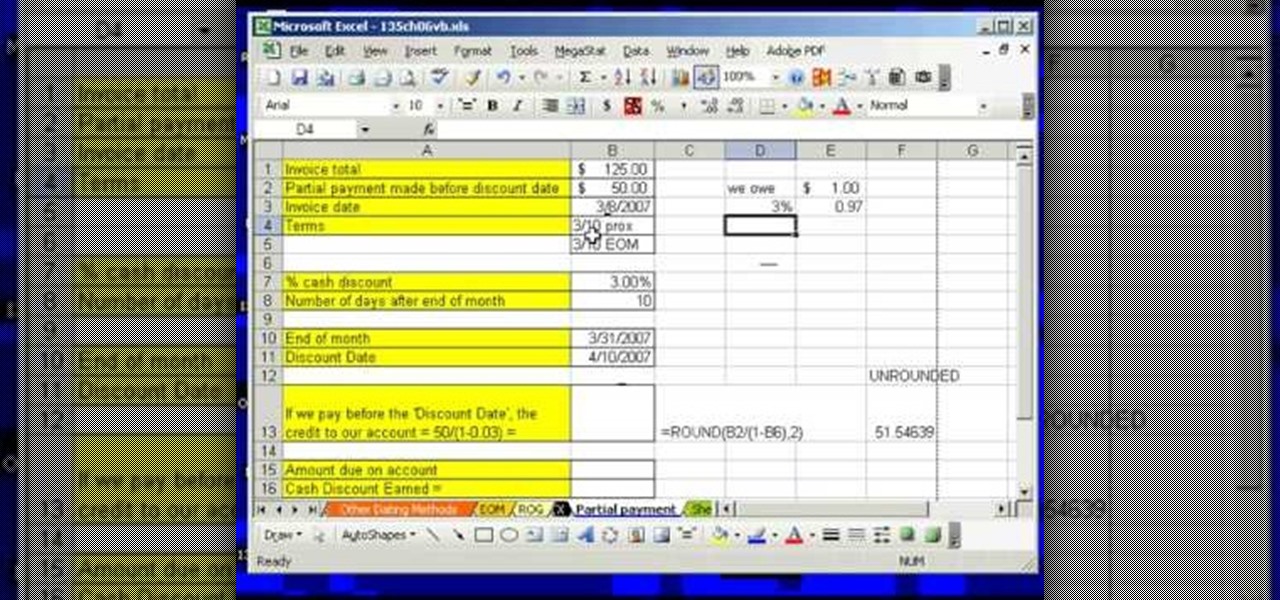
As you might guess, one of the domains in which Microsoft Excel really excels is business math. Brush up on the stuff for your next or current job with this how-to. In this tutorial from everyone's favorite digital spreadsheet guru, YouTube's ExcelIsFun, the 47th installment in his "Business Math" series of free video lessons, you'll learn how to determine credit given for partial payment of an invoice.

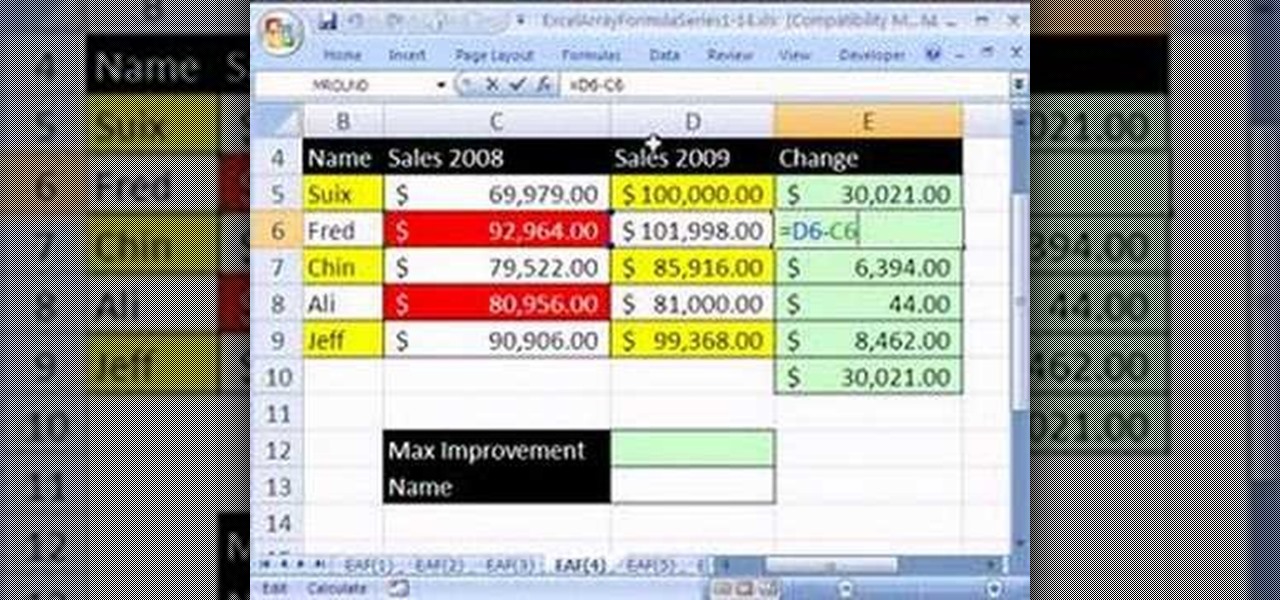
Looking for a primer on how to create and work with arrays in Microsoft Office Excel? You've come to the right place. In this free video tutorial from everyone's favorite MS Excel guru, YouTube's ExcelIsFun, the 12th installment in his series of Excel array formula series, you'll learn how to create array formulas for finding the largest improvement in sales from one year to the next.

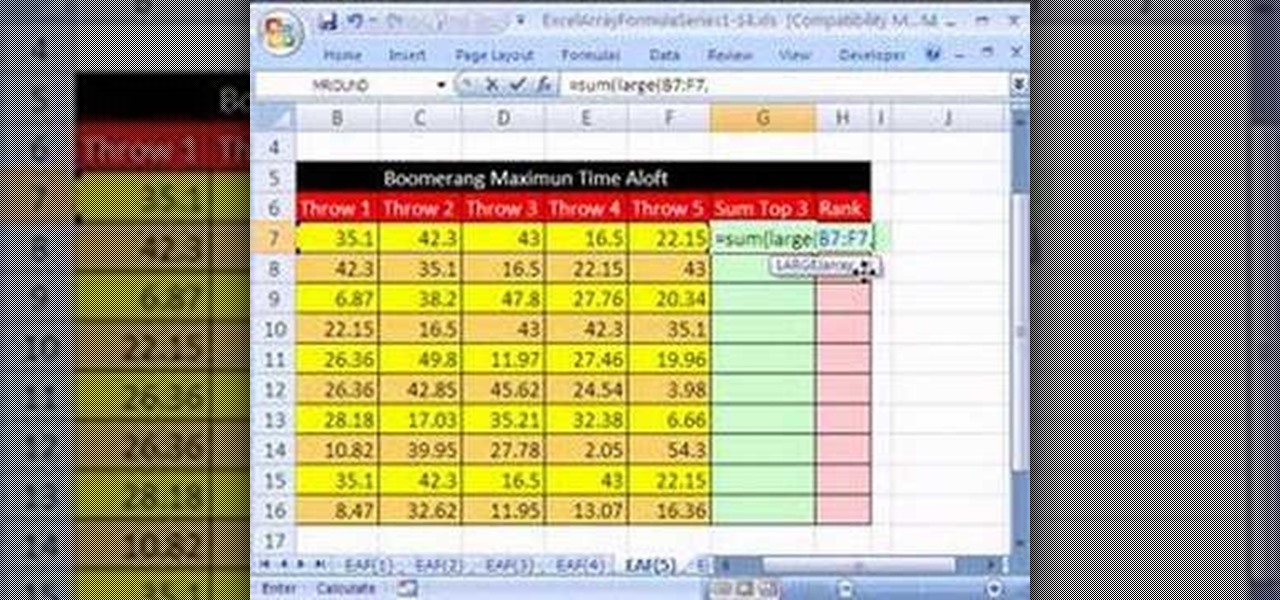
Looking for a primer on how to create and work with array formulas in Microsoft Office Excel? You've come to the right place. In this free video tutorial from everyone's favorite MS Excel guru, YouTube's ExcelIsFun, the 5th installment in his series of Excel array formula series, you'll learn how to create array formula for adding the 3 largest or smallest values in a data set.

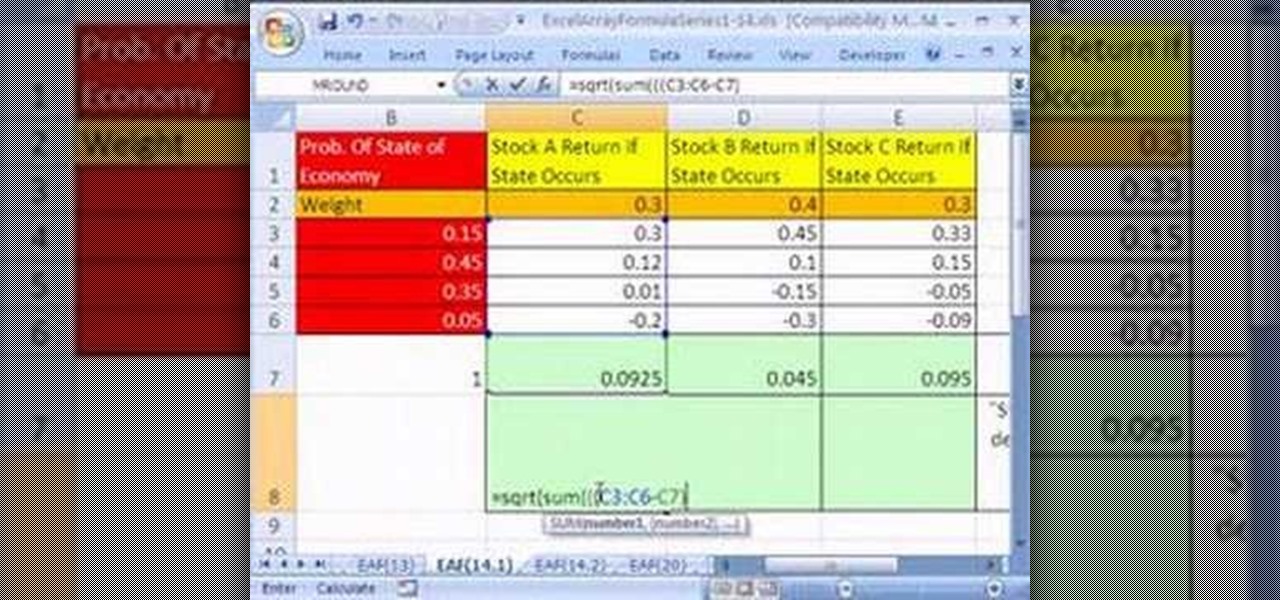
Looking for a primer on how to create and work with array formulas in Microsoft Office Excel? You've come to the right place. In this free video tutorial from everyone's favorite MS Excel guru, YouTube's ExcelIsFun, the 14th installment in his series of Excel array formula series, you'll learn how to create array formulas for individual stock return and standard deviation given different assumed states of the future economy.

Looking for a primer on how to create and work with array formulas in Microsoft Office Excel? You've come to the right place. In this free video tutorial from everyone's favorite MS Excel guru, YouTube's ExcelIsFun, the 12th installment in his series of Excel array formula series, you'll learn how to create array formulas for stock portfolio return & standard deviation.

If you use Microsoft Excel on a regular basis, odds are you work with numbers. Put those numbers to work. Statistical analysis allows you to find patterns, trends and probabilities within your data. In this MS Excel tutorial from everyone's favorite Excel guru, YouTube's ExcelsFun, the 30th installment in his "Excel Statistics" series of free video lessons, you'll learn how to create a scatter diagram for 2 quantitative variables.

Looking for a primer on how to create and work with names in Microsoft Office Excel? You've come to the right place. In this free video tutorial from everyone's favorite MS Excel guru, YouTube's ExcelIsFun, the 12th installment in his series of Excel name tricks, you'll learn apply names to formulas using Excel's built-in Apply Name Feature.

Looking for a primer on how to create and work with names in Microsoft Office Excel? You've come to the right place. In this free video tutorial from everyone's favorite MS Excel guru, YouTube's ExcelIsFun, the 4th installment in his series of Excel name tricks, you'll learn to use short Excel names to expedite the formula creation process. For detailed instructions, watch this free video Excel lesson.

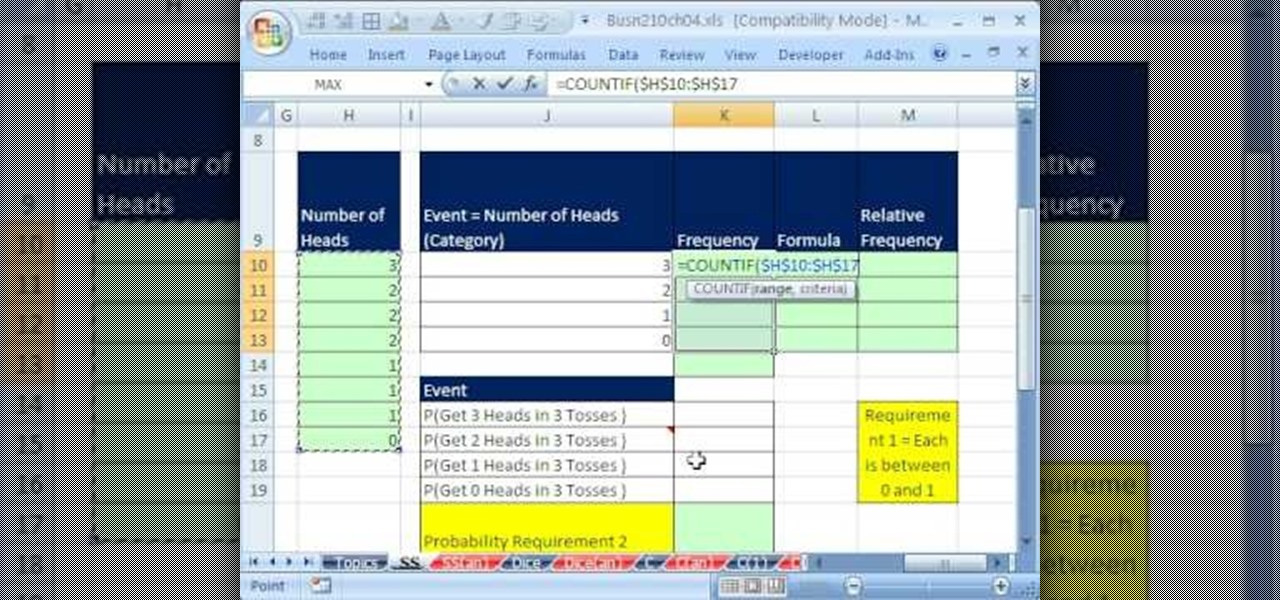
If you use Microsoft Excel on a regular basis, odds are you work with numbers. Put those numbers to work. Statistical analysis allows you to find patterns, trends and probabilities within your data. In this MS Excel tutorial from everyone's favorite Excel guru, YouTube's ExcelsFun, the 51st installment in his "Excel Statistics" series of free video lessons, you'll learn how to understand, work with and find simple probabilities in Microsoft Office Excel.

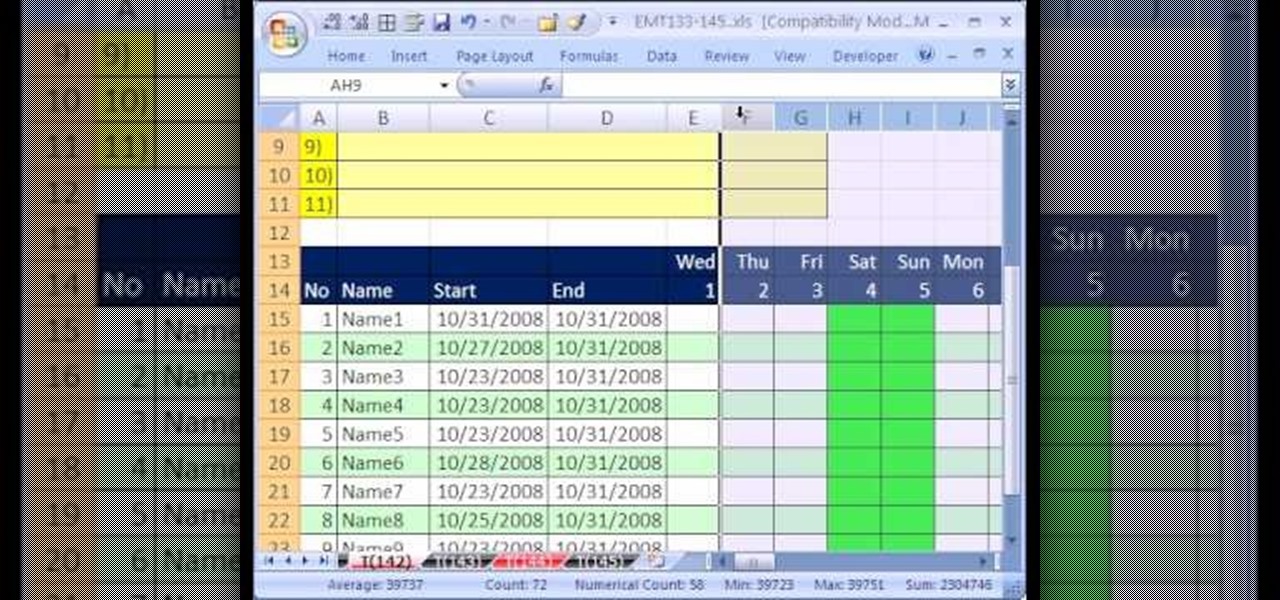
New to Microsoft Excel? Looking for a tip? How about a tip so mind-blowingly useful as to qualify as a magic trick? You're in luck. In this MS Excel tutorial from ExcelIsFun, the 142nd installment in their series of digital spreadsheet magic tricks, you'll learn how to create a complex array formula that counts weekends between two dates with the SUM, IF WEEKDAY, ROW and INDIRECT functions.

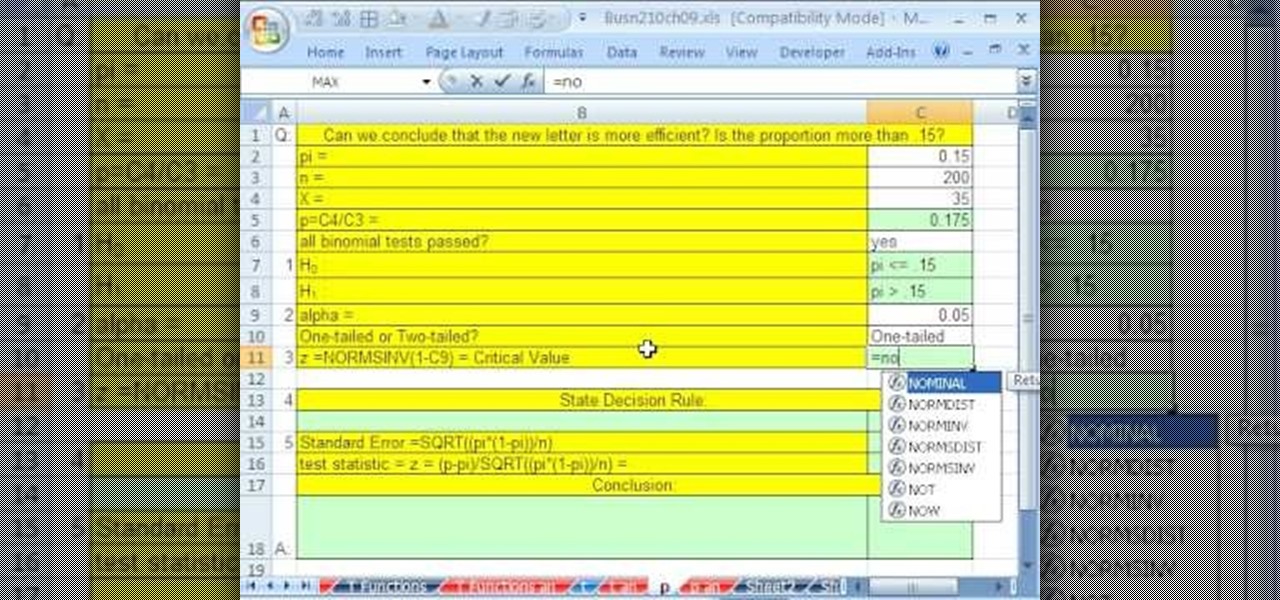
If you use Microsoft Excel on a regular basis, odds are you work with numbers. Put those numbers to work. Statistical analysis allows you to find patterns, trends and probabilities within your data. In this MS Excel tutorial from everyone's favorite Excel guru, YouTube's ExcelsFun, the 93rd installment in his "Excel Statistics" series of free video lessons, you'll learn how to use the NORMSINV and NORMSDIST functions to complete a hypothesis test about a population proportion.

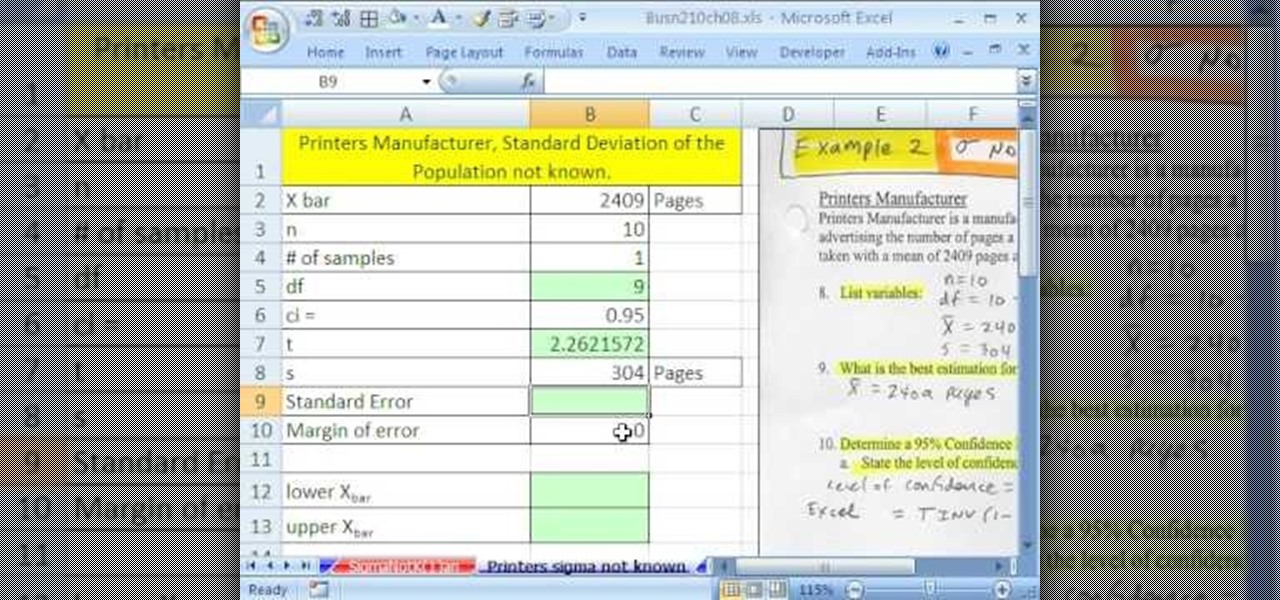
If you use Microsoft Excel on a regular basis, odds are you work with numbers. Put those numbers to work. Statistical analysis allows you to find patterns, trends and probabilities within your data. In this MS Excel tutorial from everyone's favorite Excel guru, YouTube's ExcelsFun, the 83rd installment in his "Excel Statistics" series of free video lessons, you'll learn how to construct confidence intervals when the sigma (population standard deviation) in NOT known using the TINV function.

If you use Microsoft Excel on a regular basis, odds are you work with numbers. Put those numbers to work. Statistical analysis allows you to find patterns, trends and probabilities within your data. In this MS Excel tutorial from everyone's favorite Excel guru, YouTube's ExcelsFun, the 29th installment in his "Excel Statistics" series of free video lessons, you'll learn how to create quantitative data cross tabulation using a pivot table (PivotTable).

If you use Microsoft Excel on a regular basis, odds are you work with numbers. Put those numbers to work. Statistical analysis allows you to find patterns, trends and probabilities within your data. In this MS Excel tutorial from everyone's favorite Excel guru, YouTube's ExcelsFun, the 11th installment in his "Excel Statistics" series of free video lessons, you'll learn how to work with, and create charts for, cross-sectional and time-series data.

If you use Microsoft Excel on a regular basis, odds are you work with numbers. Put those numbers to work. Statistical analysis allows you to find patterns, trends and probabilities within your data. In this MS Excel tutorial from everyone's favorite Excel guru, YouTube's ExcelsFun, the 13th installment in his "Excel Statistics" series of free video lessons, you'll learn how to install the Excel 2007 Data Analysis add-in.

New to Microsoft Excel? Looking for a tip? How about a tip so mind-blowingly useful as to qualify as a magic trick? You're in luck. In this MS Excel tutorial from ExcelIsFun, the 90th installment in their series of digital spreadsheet magic tricks, you'll learn how to create a dynamic, two-way IF function lookup formula for pulling data from a different Workbook.

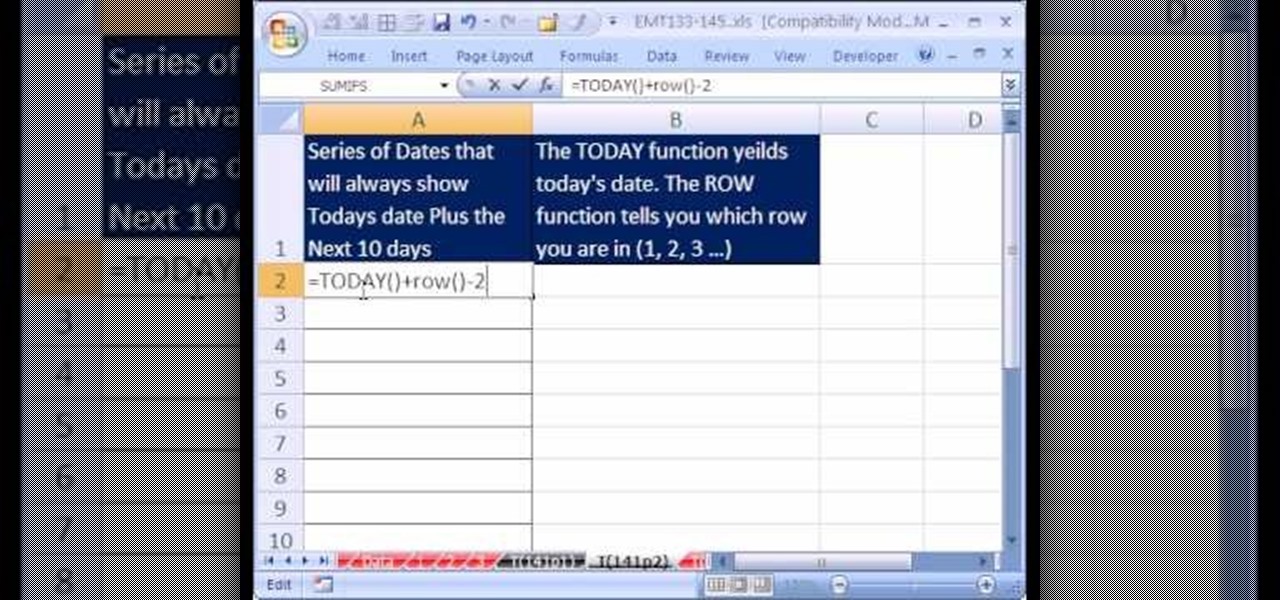
Love Microsoft Excel? This clip contains a tip that just might induce you to. With this free video tutorial from ExcelIsFun, the 141st installment of his "YouTubers Love Excel" or YTLE series of free video MS Excel lessons, you'll learn how to generate a series of dates with the TODAY and ROW function that will always show today plus the next 10 days.

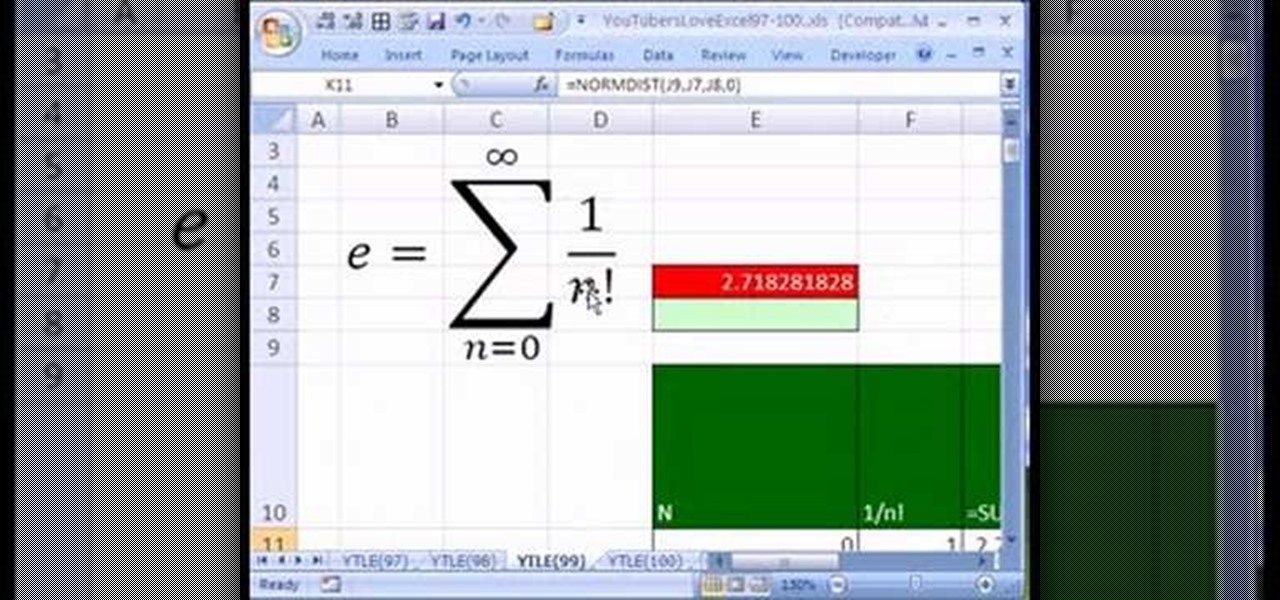
Love Microsoft Excel? This clip contains a tip that just might induce you to. With this free video tutorial from ExcelIsFun, the 99th installment of his "YouTubers Love Excel" or YTLE series of free video MS Excel lessons, you'll learn how to create and use the mathematical constant e in Excel. Also learn about the EXP function.

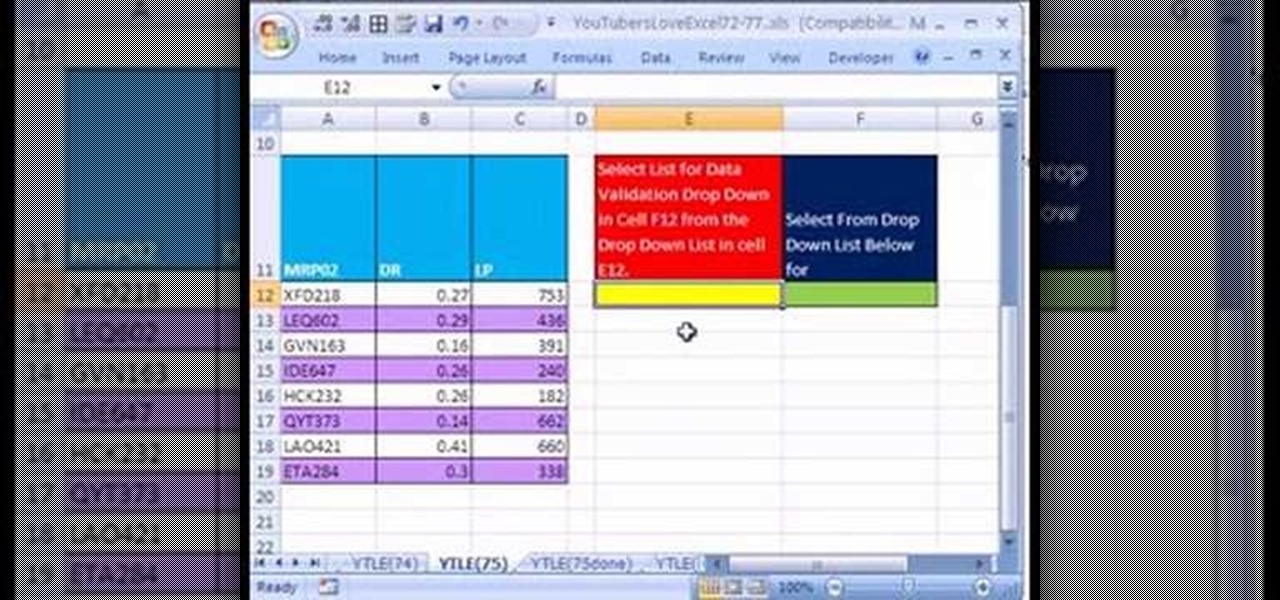
Love Microsoft Excel? This clip contains a tip that just might induce you to. With this free video tutorial from ExcelIsFun, the 75th installment of his "YouTubers Love Excel" or YTLE series of free video MS Excel lessons, you'll learn how to use name, the INDIRECT function and data validation drop-down lists to create DV lists based on DV lists.

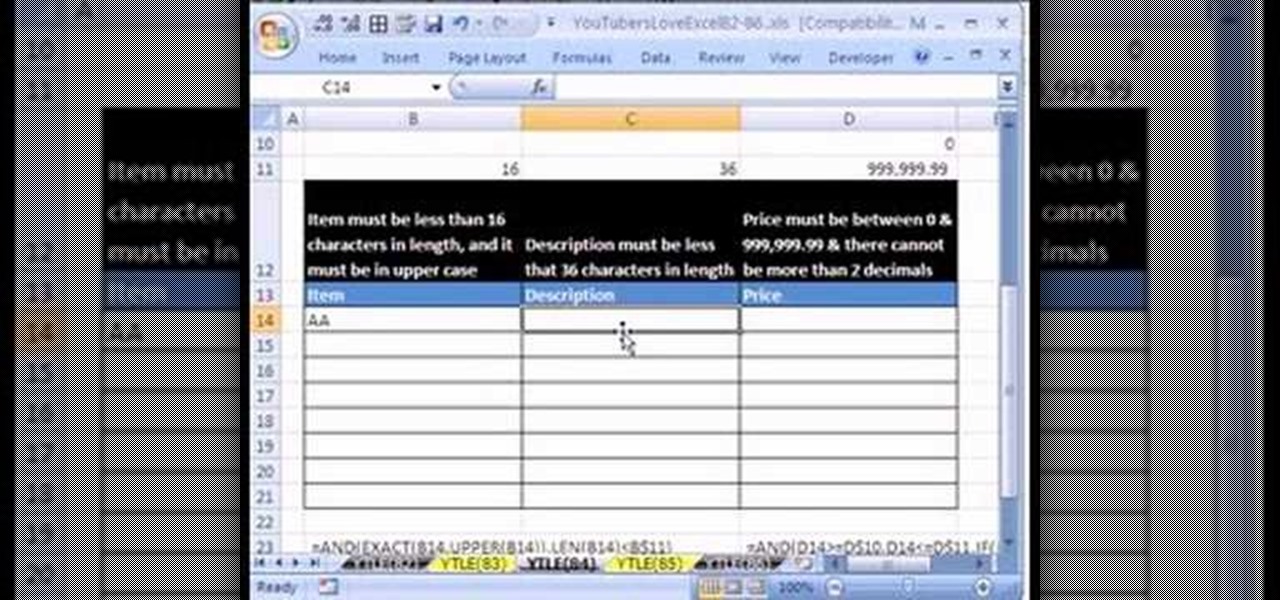
Love Microsoft Excel? This clip contains a tip that just might induce you to. With this free video tutorial from ExcelIsFun, the 84th installment of his "YouTubers Love Excel" or YTLE series of free video MS Excel lessons, you'll learn how to use custom true/false formulas for data validation and also see how to add an error message.


