
How To: Make a Japanese girl bookmark
Craft this cute bookmark of a little Japanese girl in a kimono.


Craft this cute bookmark of a little Japanese girl in a kimono.

Japanese style wrapping - or Furoshiki - let's you stop using paper, tapes and plastic when you wrap! Use reusable fabric instead. This method works for cylindrical objects and bottles.

Japanese style wrapping - or Furoshiki - let's you stop using paper, tapes and plastic when you wrap! Use reusable fabric instead.

Western toilets are now common in Japan. However, as with everything they've cribbed from the western world, the Japanese have taken it and done it one better - or weirder. If you're new to fully automatic toilets, watch this primer and learn how to use a bidet.

These are step-by-step instructions on how to fold a Japanese paper ball (Kusudama). These are very cool origami decorations and can be hung all around the house, and these paper balls are also an excellent decorations or Christmas tree ornaments. This modular origami model requires 34 - 46 units.
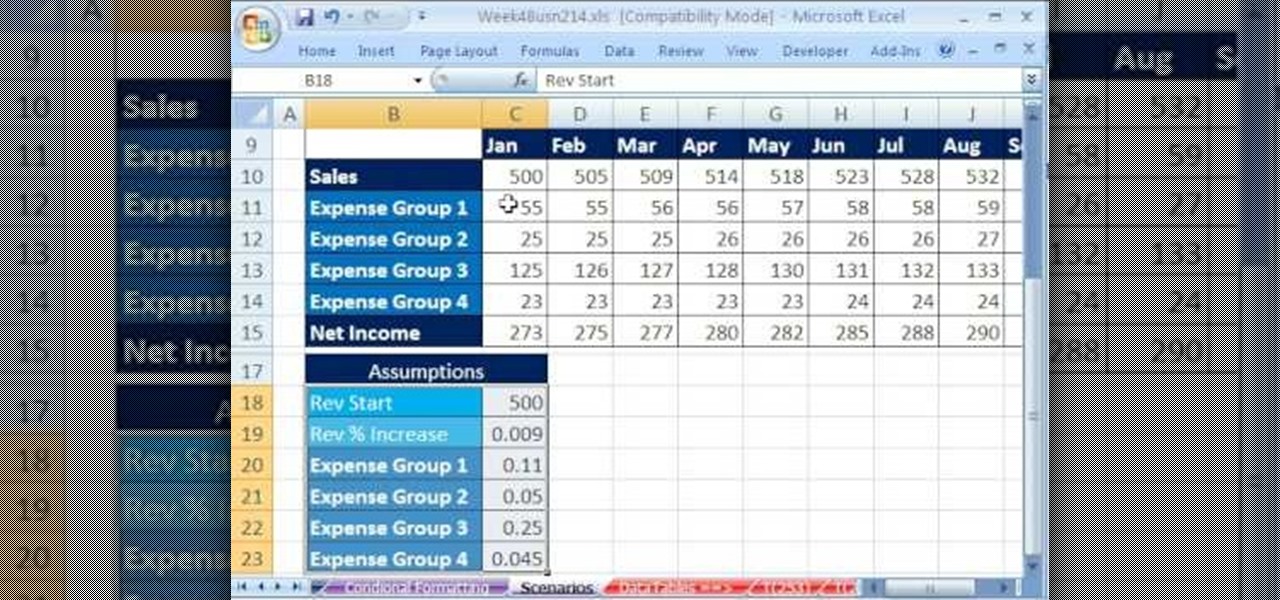
Whether you're interested in learning Microsoft Excel from the bottom up or just looking to pick up a few tips and tricks, you're in the right place. In this tutorial from everyone's favorite digital spreadsheet guru, ExcelIsFun, the 22nd installment in his "Highline Excel Class" series of free video Excel lessons, you'll learn how to create a budget with formula inputs in an assumption area and formulas. Then do what-if analysis by saving and showing scenarios. Also see how to save variables...
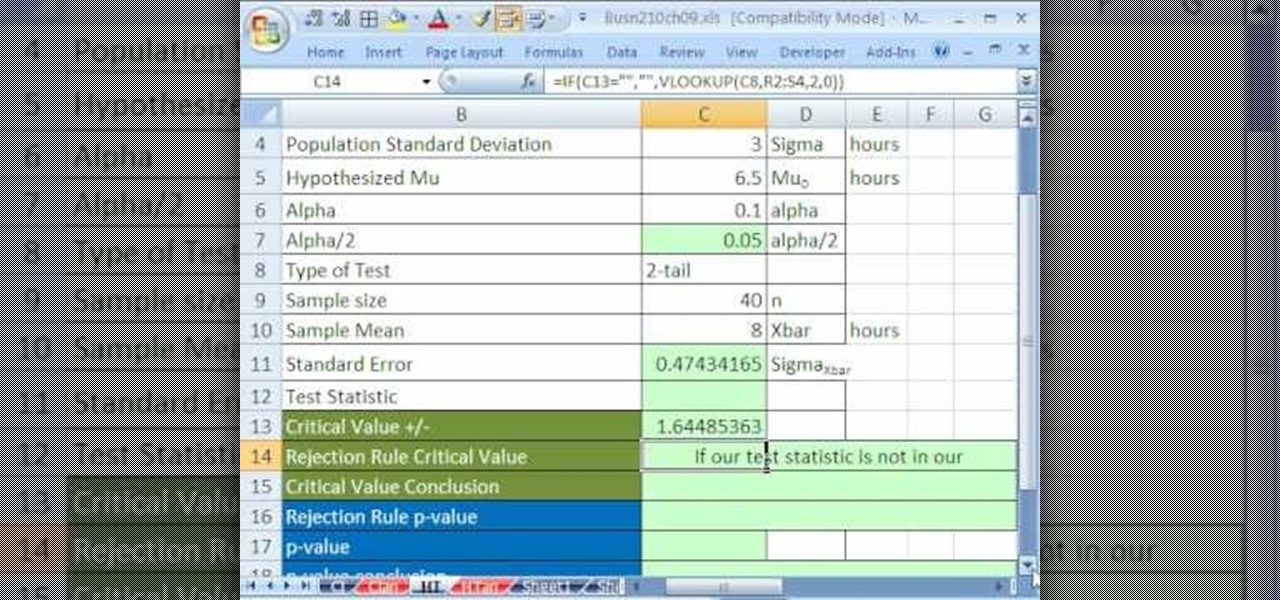
If you use Microsoft Excel on a regular basis, odds are you work with numbers. Put those numbers to work. Statistical analysis allows you to find patterns, trends and probabilities within your data. In this MS Excel tutorial from everyone's favorite Excel guru, YouTube's ExcelsFun, the 47th installment in his "Excel Statistics" series of free video lessons, you'll learn how to use the NORMSINV function for critical values and the NORSDIST function for p-values. Compare building confidence int...
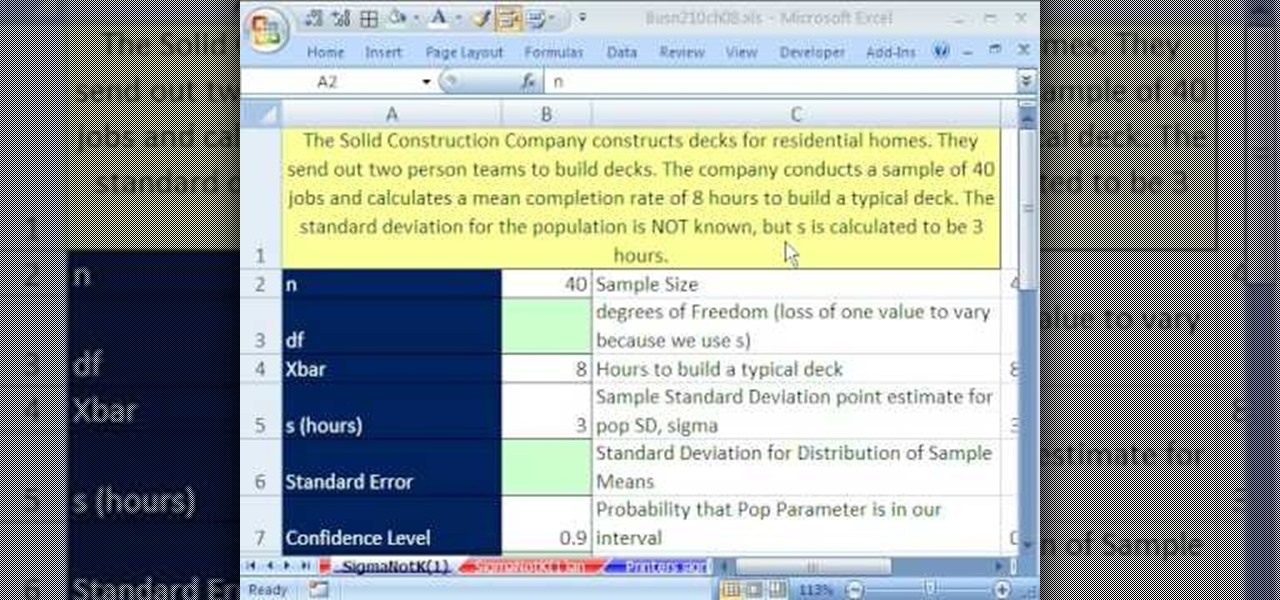
If you use Microsoft Excel on a regular basis, odds are you work with numbers. Put those numbers to work. Statistical analysis allows you to find patterns, trends and probabilities within your data. In this MS Excel tutorial from everyone's favorite Excel guru, YouTube's ExcelsFun, the 82nd installment in his "Excel Statistics" series of free video lessons, you'll learn how to construct confidence intervals when the sigma value (the population's standard deviation) in NOT Known using the TINV...
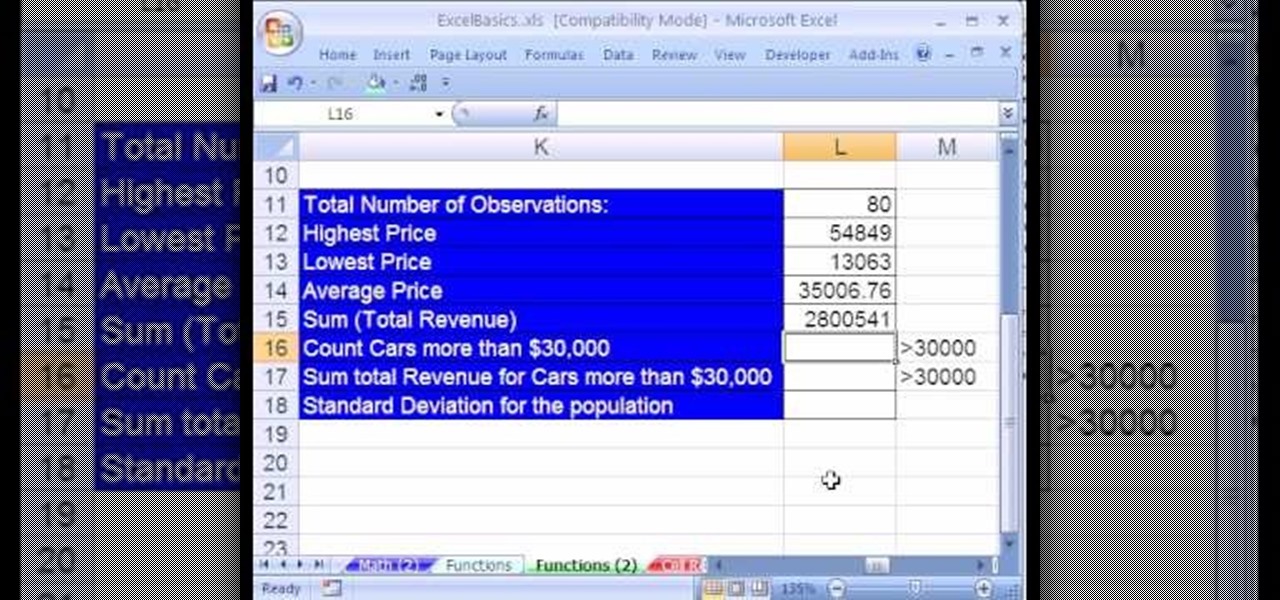
Create a table with sales data with this video.

Welcome to a tennis lesson from FuzzyYellowBalls, the the best place to learn how to play tennis online. Our free video tennis lessons teach you how to play the game in a new way that combines technical analysis, visual learning, and step-by-step progressions.

Ingredients for Yakitori (serves 2)

Ingredients for Yaki Gyoza (25 pieces)

Ingredients for Taiyaki (5 pieces)

Ingredients for Green Tea Ice Cream (400ml/1.69 u.s. cup)

Stay tuned for the always enjoyable Cooking With Dog. This cooking show is hosted by a DOG named Francis! The show currently focuses on how to make popular Japanese dishes. This video demonstrates how to make vegetable tofu nimono (vegetable tofu stew).

Stay tuned for the always enjoyable Cooking With Dog. This cooking show is hosted by a DOG named Francis! The show currently focuses on how to make popular Japanese dishes. This video demonstrates how to make kakiage soba (mixed tempura soba noodles).

This tutorial video will teach you to make Japanese plum syrup and plum wine, also known as Umeshu and Ume Syrup.

This tutorial cooking video will teach you to make Japanese Kaisendon, a Japanese Sashimi rice bowl.

This tutorial video will teach you how to make Bukkake Udon, also known as Japanese cold udon noodles.

Learn what to say before, during, and after meals in Japan. This video teaches expressions such as, "Looks delicious!" and, "Let's eat!"

I think it was 1986 when I first discovered my love for making computers say stupid things out loud. My older brother got a Commodore 64 for his birthday, which came bundled with software that would speak out any term you typed in—and boy, that computer sure made a fool of itself after my five-year-old imagination got a hold of the keyboard.

YouTube and the National Football League have announced a partnership that should greatly improve the online experience for gridiron fans. In a posting on their official blog, YouTube outlines a deal that will bring NFL video clips to their immensely popular site while bumping official NFL pages up to the top of relevant Google search results.

Wearables were everywhere at CES 2015... you literally couldn't walk 10 feet without seeing some new and innovative device. Among the sleep, fitness, dog, and baby wearables, we came across one with a different, more important purpose—the Linx IAS injury prevention headband.

Welcome back, my hacker apprentices! I recently began a new series on digital forensics to show aspiring hackers what the forensic investigator can do and see while investigating a cyber attack. This is the second installment in that series and will focus upon network forensics. In other words, what can a network forensic investigator learn about the attacker during an investigation and how.

This video is an extensive and in depth analysis of how you can best play a four-person team on a multiplayer match in Call of Duty: Black Ops, especially on the Kino Der Toten maps. Always know where to look out for campers!
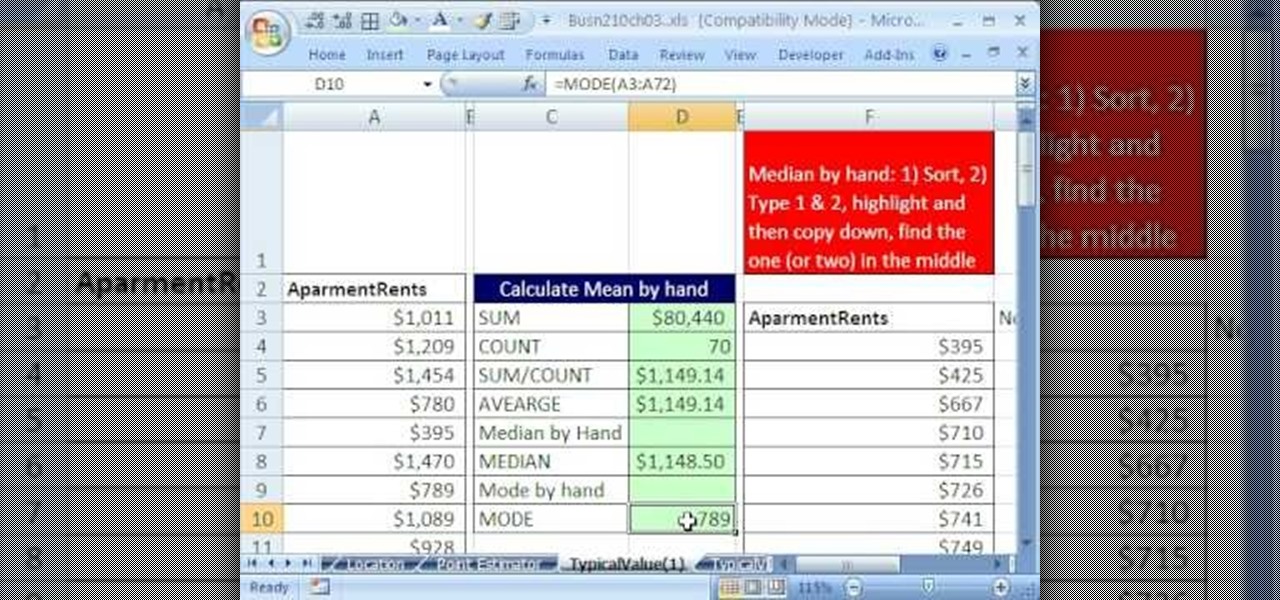
If you use Microsoft Excel on a regular basis, odds are you work with numbers. Put those numbers to work. Statistical analysis allows you to find patterns, trends and probabilities within your data. In this MS Excel tutorial from everyone's favorite Excel guru, YouTube's ExcelsFun, the 34th installment in his "Excel Statistics" series of free video lessons, you'll learn how to use MEAN, MEDIAN, MODE. These measures give us a typical value, a measure of central tendency one value that can repr...
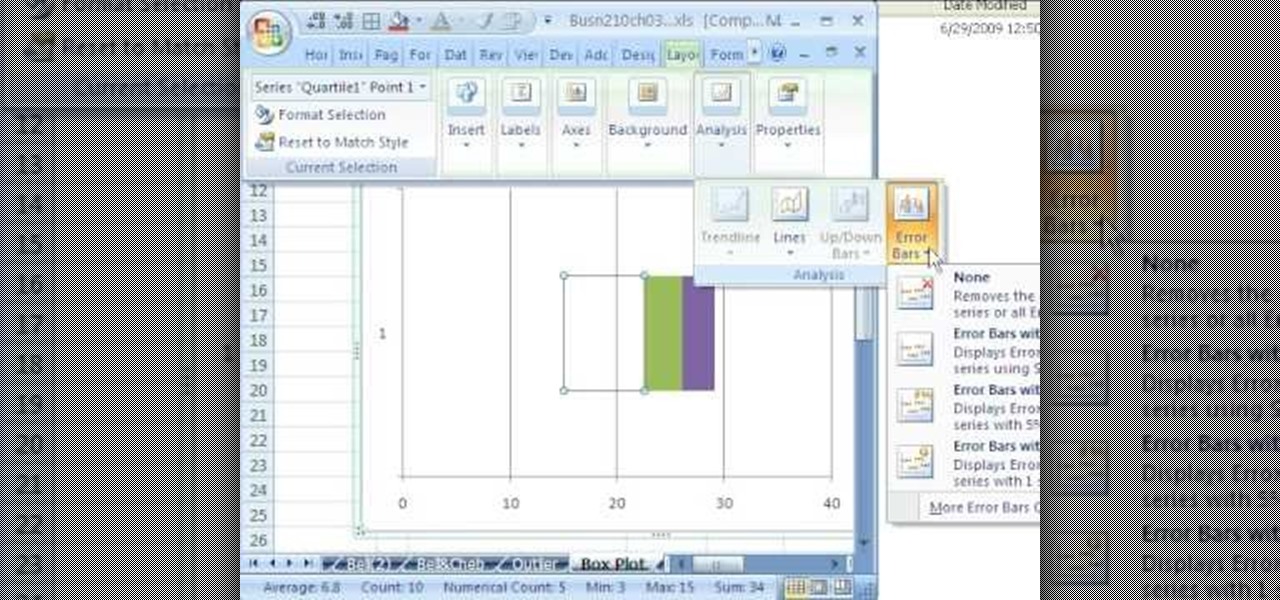
If you use Microsoft Excel on a regular basis, odds are you work with numbers. Put those numbers to work. Statistical analysis allows you to find patterns, trends and probabilities within your data. In this MS Excel tutorial from everyone's favorite Excel guru, YouTube's ExcelsFun, the 49th installment in his "Excel Statistics" series of free video lessons, you'll learn how to find outliers with the +/- 3 Z-score rule and the ABS function. See how to do a box plot by hand and in Excel. For th...

Whether you're interested in learning Microsoft Excel from the bottom up or just looking to pick up a few tips and tricks, you've come to the right place. In this tutorial from everyone's favorite digital spreadsheet guru, ExcelIsFun, the 45th installment in his "Highline Excel Class" series of free video Excel lessons, you'll learn how to perform debt analysis with the following input variables: % Down Payment, APR, Years, Points, Extra Fee. See how to calculate Amount to Borrow, Monthly Pay...

If you're a novice looking to learn how to use Microsoft Excel, a video series from digital spreadsheet guru ExcelIsFun is a great place to start. But which of his many series should you choose? The one titled "Excel Basics," that's which! This free video MS Excel lesson, the very installment in said tutorial series, covers the following topics:

If you use Microsoft Excel on a regular basis, odds are you work with numbers. Put those numbers to work. Statistical analysis allows you to find patterns, trends and probabilities within your data. In this MS Excel tutorial from everyone's favorite Excel guru, YouTube's ExcelsFun, the 20th installment in his "Excel Statistics" series of free video lessons, you'll learn how to take raw quantitative (numerical) data and figure out how to group it into classes so that you can have categories an...
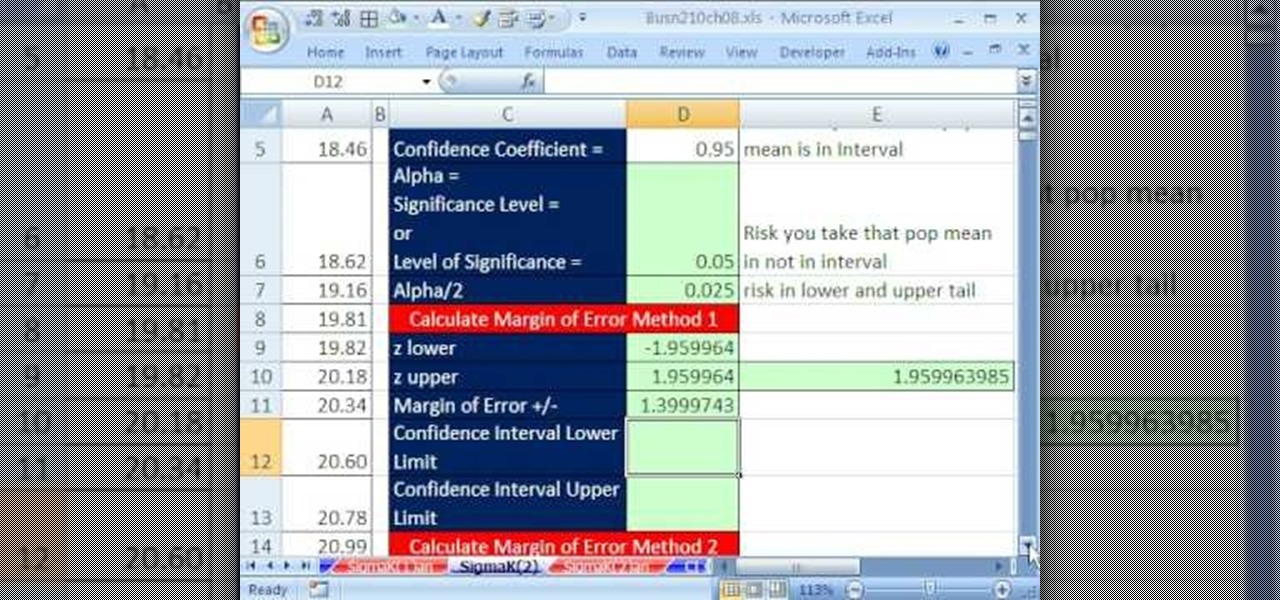
If you use Microsoft Excel on a regular basis, odds are you work with numbers. Put those numbers to work. Statistical analysis allows you to find patterns, trends and probabilities within your data. In this MS Excel tutorial from everyone's favorite Excel guru, YouTube's ExcelsFun, the 81st installment in his "Excel Statistics" series of free video lessons, you'll learn how to construct confidence intervals when the sigma (population standard deviation) is known. See how the CONFIDENCE and NO...
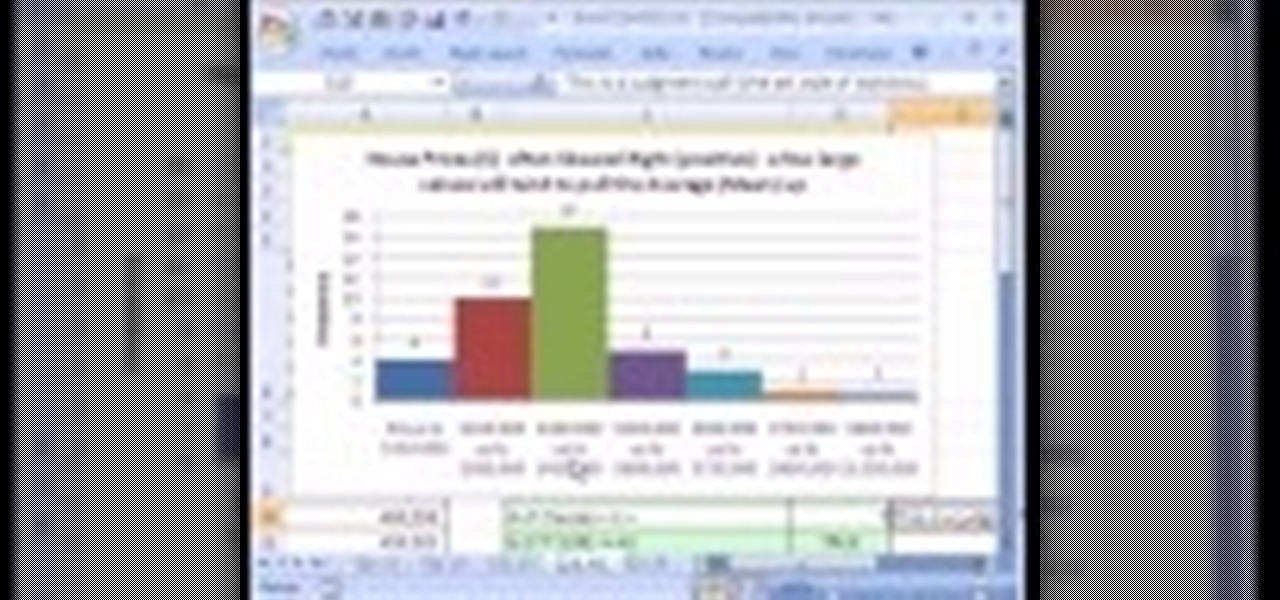
If you use Microsoft Excel on a regular basis, odds are you work with numbers. Put those numbers to work. Statistical analysis allows you to find patterns, trends and probabilities within your data. In this MS Excel tutorial from everyone's favorite Excel guru, YouTube's ExcelsFun, the 23rd installment in his "Excel Statistics" series of free video lessons, you'll learn how to work with skew in histograms for quantitative Data. Learn how to skew left (negative) and skew right (positive) with ...
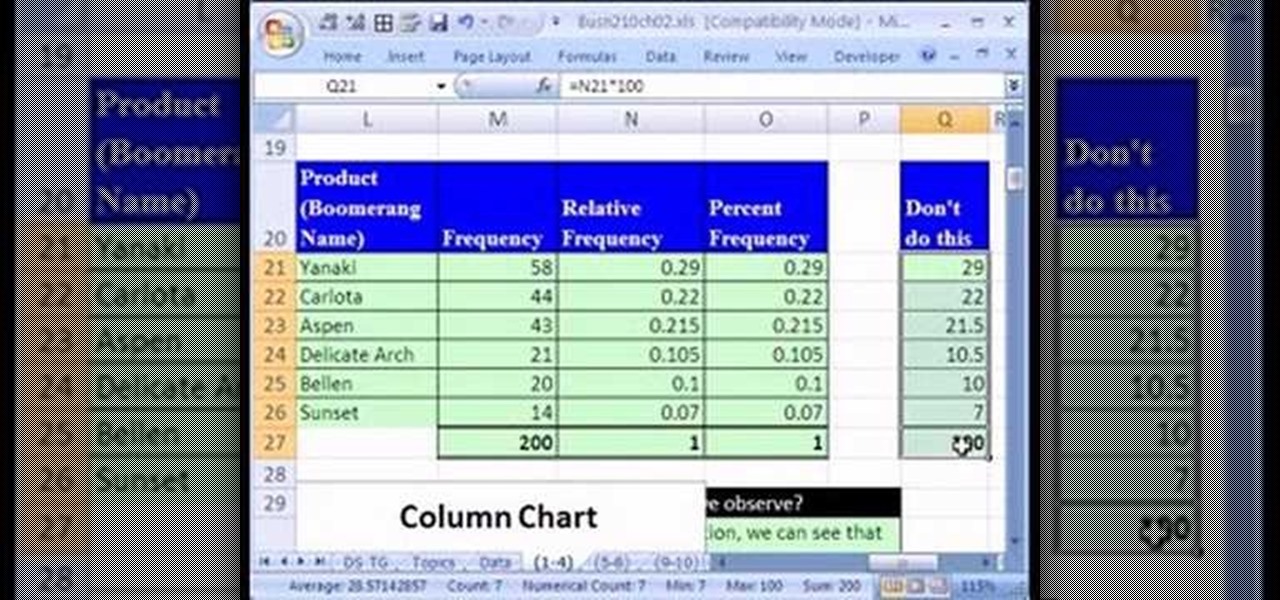
If you use Microsoft Excel on a regular basis, odds are you work with numbers. Put those numbers to work. Statistical analysis allows you to find patterns, trends and probabilities within your data. In this MS Excel tutorial from everyone's favorite Excel guru, YouTube's ExcelsFun, the 14th installment in his "Excel Statistics" series of free video lessons, you'll learn how to create relative & percent & frequency distributions with formulas for categorical data. See, too, how to create a per...
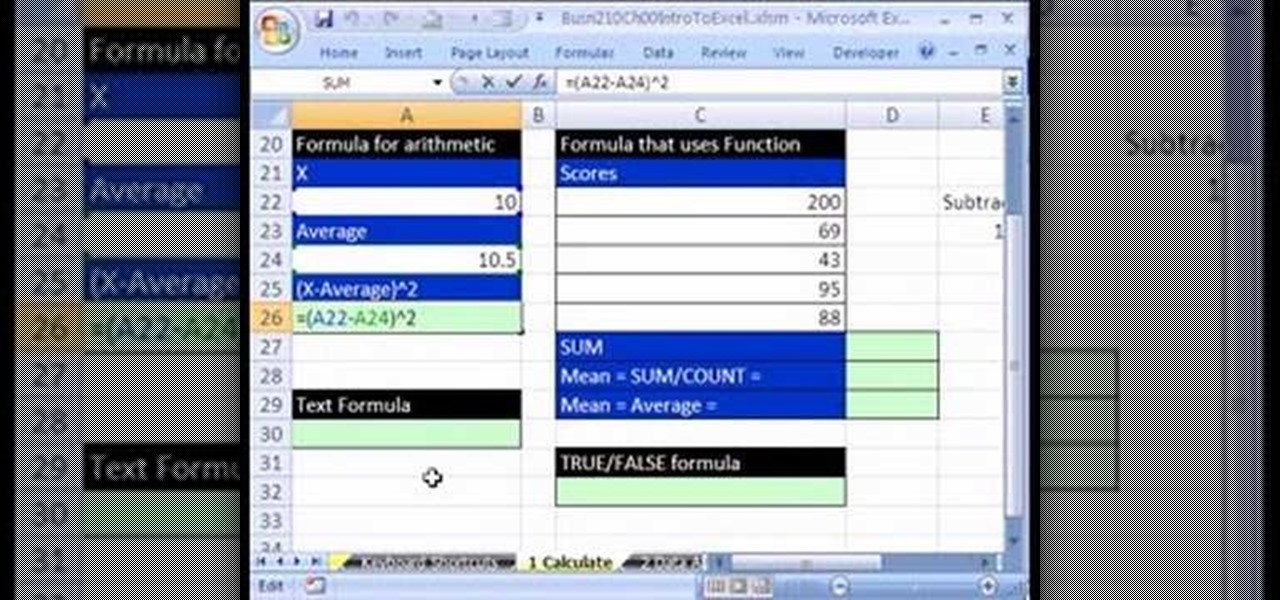
If you use Microsoft Excel on a regular basis, odds are you work with numbers. Put those numbers to work. Statistical analysis allows you to find patterns, trends and probabilities within your data. In this MS Excel tutorial from everyone's favorite Excel guru, YouTube's ExcelsFun, the 2nd installment in his "Excel Statistics" series of free video lessons, you'll learn how to make calculations in Excel using formulas and cell references. Learn about the different Excel Math operators and func...

This video describes the art of writing argumentative essays. In other words it narrates how to improve arguments of an essay. It starts with an analysis of classic examples. The speaker begins by criticizing the style of paragraph and how to improve the suggestions. He explains how to omit errors and form your arguments in commanding manner. Finally, he says how to come a conclusion by adding solid evidence. At the end of course he will show you how to transfer a old matter into a classic ex...
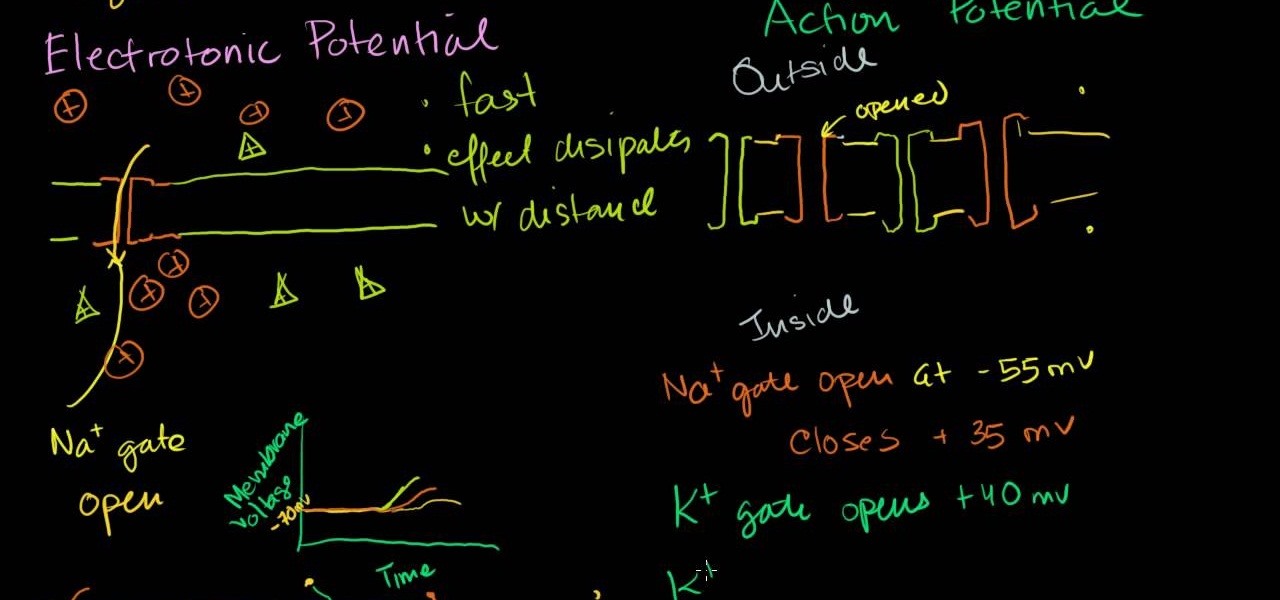
Maybe you learn best by seeing things worked out in front of you and what you just saw in class today about Electronic action potential of neurons didn't quite sink in. Not to mention the test that you have coming up this week is going to be an in-depth analysis of your knowledge on this material. Let Khanacademy be your guide! For less than half the time it takes to sit through the Professors class, he explains the function of Neurons, how action potential works and sends you on your way to ...

Grandmaster Alexandra Kosteniuk gives you one hell of a chess lesson in this video tutorial for the determined. This chess game will show you how to perform a tricky checkmate in one move with a useful moral, presented by guest star Almira Skripchenko.
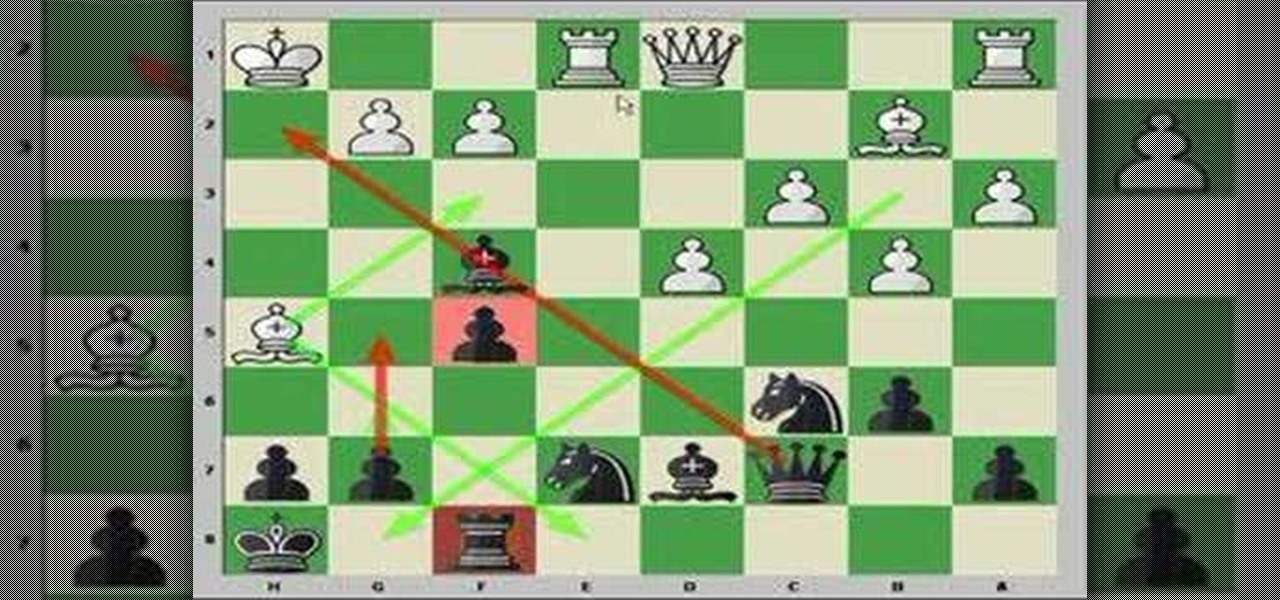
These two videos focus on analyzing chess positions, and generating candidate move orders from the position without moving the pieces or using computer analysis. The goal is to improve the ability to generate lines and variations mentally during a game, and to try to come up with a move that either maintains equality on the board, or paves the way for a slight positional edge.

November 11th isn't just Veterans Day— it's Origami Day in Japan, where they celebrate the traditional art of paper folding. November 11th is also the last day of World Origami Days, a 2-1/2 week celebration held internationally.

Learn how to make Bento with YouTube's beloved Cooking With Dog. Ingredients for Bento