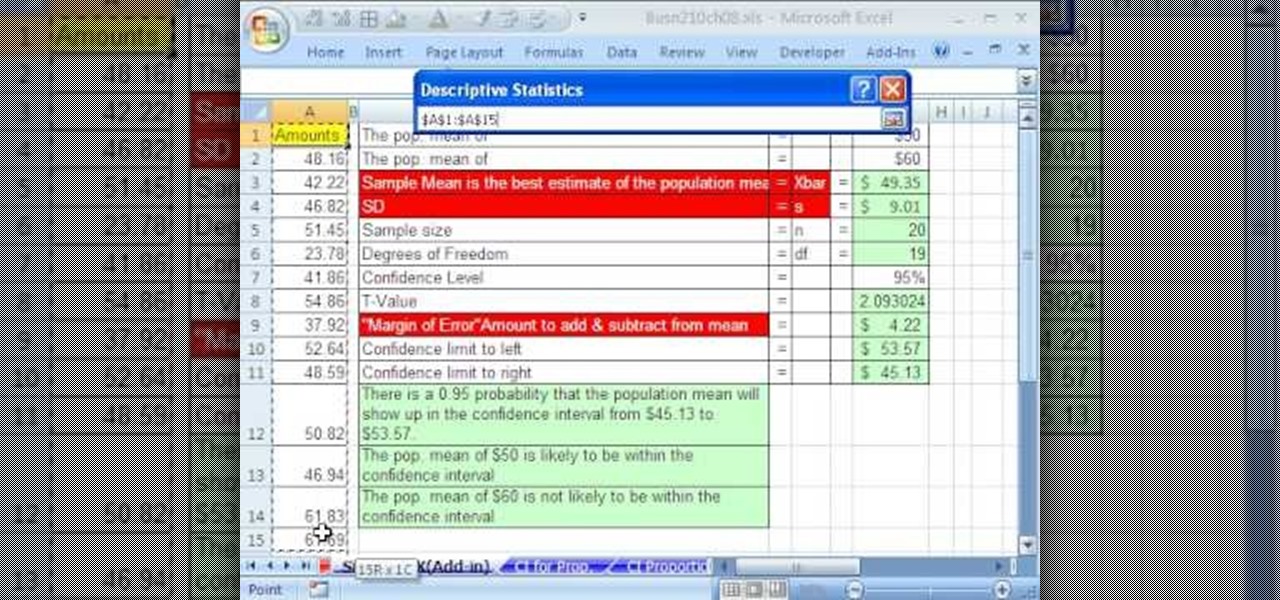
If you use Microsoft Excel on a regular basis, odds are you work with numbers. Put those numbers to work. Statistical analysis allows you to find patterns, trends and probabilities within your data. In this MS Excel tutorial from everyone's favorite Excel guru, YouTube's ExcelsFun, the 84th installment in his "Excel Statistics" series of free video lessons, you'll learn how to construct confidence intervals when the sigma is NOT known using the Descriptive Statistics data analysis add-in.
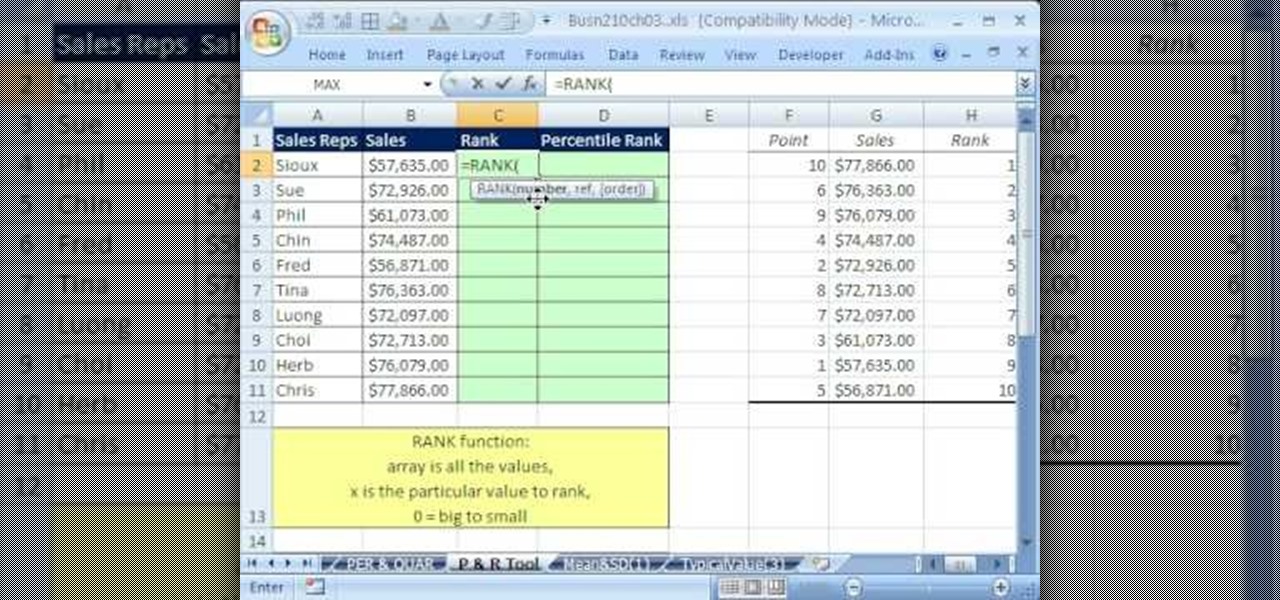
If you use Microsoft Excel on a regular basis, odds are you work with numbers. Put those numbers to work. Statistical analysis allows you to find patterns, trends and probabilities within your data. In this MS Excel tutorial from everyone's favorite Excel guru, YouTube's ExcelsFun, the 38th installment in his "Excel Statistics" series of free video lessons, you'll learn how to use the RANK and PERCENTRANK functions as well as the Data Analysis add-in's Rank & Percentile tools.

"I was wondering if you could take the triad Harmonic Analysis lesson you had done a step further and cover the concept of Transposing chord progressions into other keys?" Before you begin you do have to know some background information about your key signatures, knowing major, minor and diminished steps in triad analysis, and seventh chord harmony. The idea of transposing is that your take a set of notes and change they key it is originally played in. Andrew will walk you through all the ste...

This video is based on a chemistry experiment. This video is going to explain to us how to use gravimetric analysis in order to analyze sulfuric acid. This experiment should not be done for those who do not have a fundamental knowledge of chemical compounds, reactions and chemical safety. He explains first what he is about to do before he does it. Sulfuric acid is acidic and can be toxic if ingested or in contact with the eyes. Take extreme care with this experiment.

In this video we learn how to pronounce the Japanese "R" sound. About 90% of people learning this language have problems saying this. The "R" sound is a combination of different sounds, not just the "R" sound like it is in English. There are five different ways to say the "R" pronunciation. You will combine all of these sounds together in one sound, unlike English. To help say these more correctly, start out by making out normal English words, pushing your tongue against the top of your mouth...

It couldn't be any simpler than this. You don't need to fuss around to learn Japanese phrases. This instructional video makes it easy as possible by quickly showing you the correct way to say hello in Japanese. It only takes three seconds to pay attention and listen carefully!

Watch this video and listen to a fun hip hop track to learn Japanese Hiragana characters.

Watch this short video and learn seven super useful and common Japanese greetings.

Watch this video to learn directions in Japanese and their symbols. This video offers clever ways to remember the character for each direction.

This video tutorial is about Japanese language, and it shows us how to write the Japanese Kanji character "kuni" meaning "country". Our first step is to write a line starting from the top left and finishing in the bottom left. Remember that the order of the strokes in Japanese language are very important; there is just one possible stroke order for every character. After making the first stroke, you will need to make other two lines with only one stroke, starting from the same point than he p...

If you ever wanted to learn Japanese? This video will show you basic greeting you will need to start speaking Japanese.

If you're looking to play a samurai or other Japanese inspired character at your next boffer larp, this tutorial is for you. You're shown how to build a foam katana using duct tape, a razor blade, measuring tape, cloth athletic tape, DAP contact cement, liquid craft latex, fabric to cover your blade, rope, fiberglass core, and of course, foam!

Watch this video and learn how to pronounce the months of the year in Japanese.

Learn how simple it can be to write out numbers in Japanese using Kanji characters by watching this video.

Watch this video to learn how to say the names of common animals such as dogs, cats, fish, birds, and Godzilla in Japanese. The video offers special methods of remembering the name of each animal.

Learn how to say and recognize the basic sounds and their Hiragana symbols in Japanese.

Stay tuned for the always enjoyable Cooking With Dog. This cooking show is hosted by a DOG named Francis! The show demonstrates how to make popular Japanese dishes.

Stay tuned for the always enjoyable Cooking With Dog. This cooking show is hosted by a DOG named Francis! The show currently focuses on how to make popular Japanese dishes. Learn how to prepare Japanese Ichigo Daifuku, aka strawberry Daifuku. This is a Japanese dessert.

Learning a new language can be a hard and trying task. It takes time and patience to fully understand and use a language. Something else that can be difficult is confessing your love to someone. So in this tutorial, you'll find out how to confess your love for someone in Japanese. So good luck and enjoy!

This video language lesson explains how to hold polite dinner conversation in Japanese, focusing on traditional Japanese table etiquette. At the beginning of a meal, a typical thing to hear is "itadakimasu". Translated literally, it means, "I will partake." When finished with a meal, everyone says, "gochiso-sama", which is a way of expressing respect for the meal. The names of the utensils used in a Japanese meal are "hashi" (chopsticks), spoon (same as in English) and "foh-ku" (fork), "coppu...

This chess tutorial from Grandmaster Alexandra Kosteniuk is a perfect example of Retrograde Analysis.

This video is for entry level Japanese language students to help them practice basic conversation. Watch, listen, and repeat.

This video is shows you how to conjugate Japanese verbs into the te-form. The te-form is useful for connecting sentences, watch and learn.

Watch this video and learn three useful phrases when the meaning is unclear during a Japanese conversation.

For those who have mastered Hiragana, this video shows some simple Japanese phrases you can use to introduce yourself and ask how someone is doing.

Watch this video sequence and learn how to ask someone if they dislike or like something and also how to respond to such a question.

This video teaches you how to use a particular Japanese word, "teki," to make nouns into adjectives.

You might know how to count from 1 to 10, but in this lesson, you will learn how to count from 10 to 10,000 in Japanese.

Takanori Tomita teaches you the difference between masu and mashita.

Takanori Tomita teaches you some useful phrases that can be used at a Japanese beauty salon to converse with the stylists.

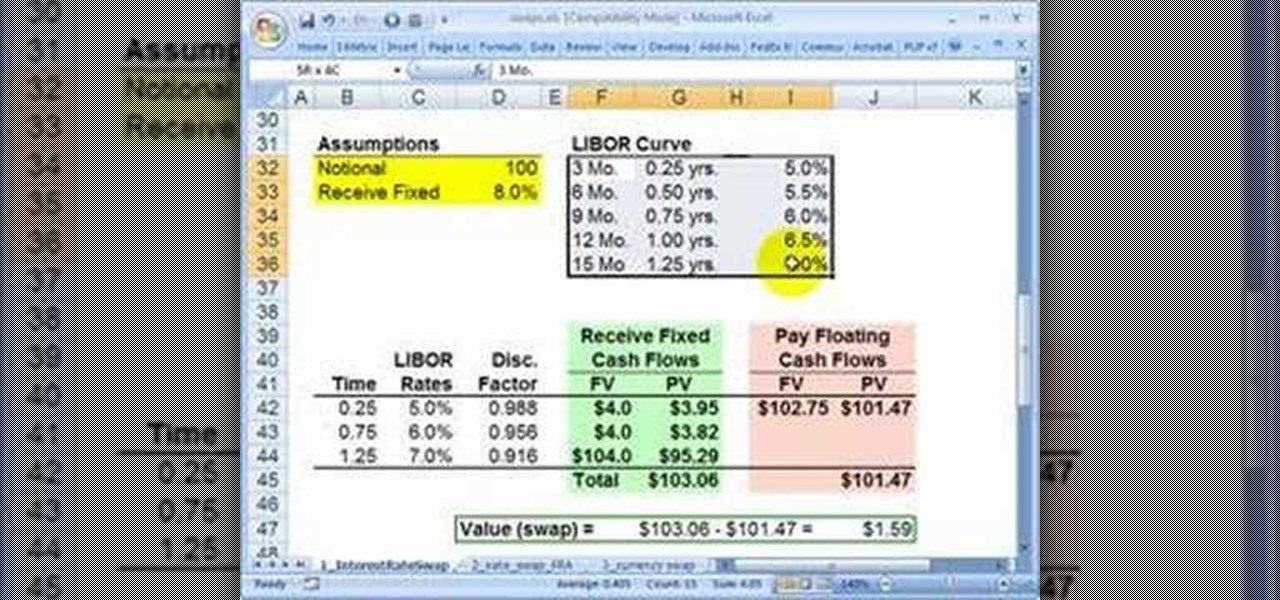
High finance and statistical analysis are too complex for most people once they forget what they learned in high school. If you are an investor or small business owner, you can't afford to forget this stuff. This video will teach you how to value an interest rate swap, good info for financial professionals and students.

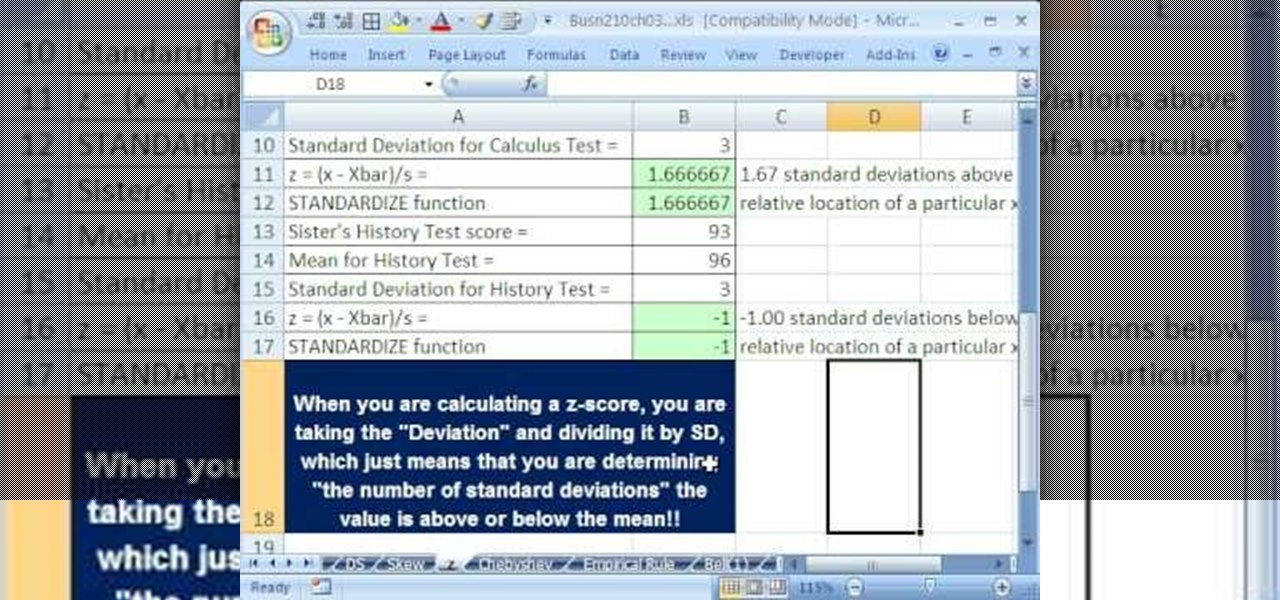
If you use Microsoft Excel on a regular basis, odds are you work with numbers. Put those numbers to work. Statistical analysis allows you to find patterns, trends and probabilities within your data. In this MS Excel tutorial from everyone's favorite Excel guru, YouTube's ExcelsFun, the 45th installment in his "Excel Statistics" series of free video lessons, you'll learn how to see how to calculate a z-score.

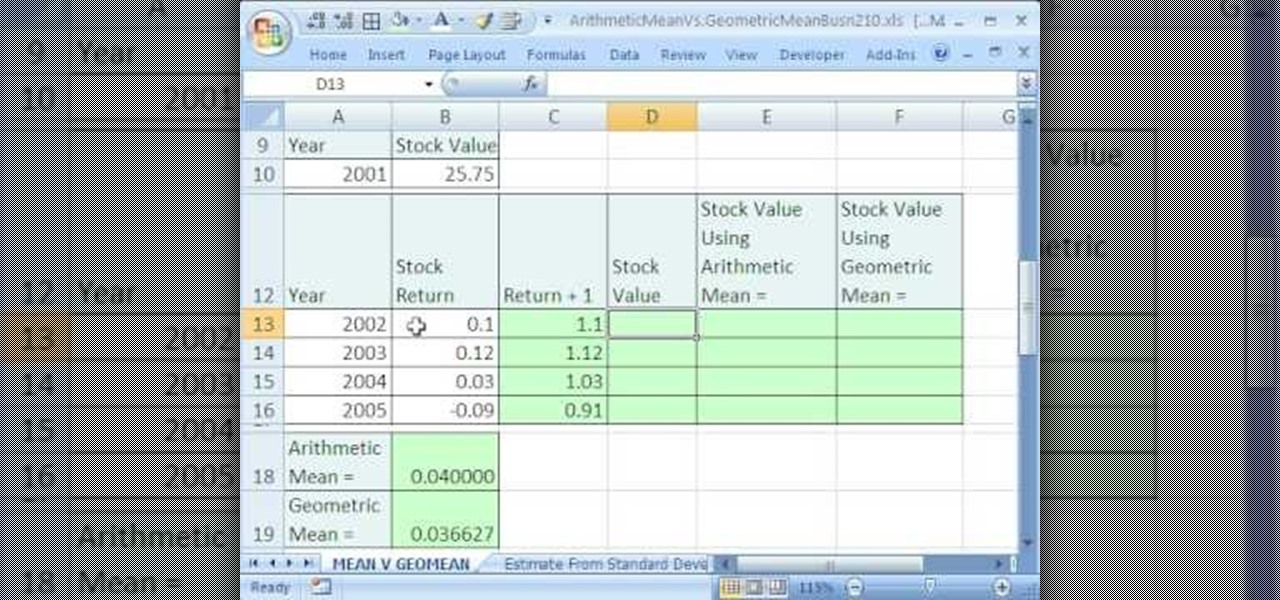
If you use Microsoft Excel on a regular basis, odds are you work with numbers. Put those numbers to work. Statistical analysis allows you to find patterns, trends and probabilities within your data. In this MS Excel tutorial from everyone's favorite Excel guru, YouTube's ExcelsFun, the 35.2nd installment in his "Excel Statistics" series of free video lessons, you'll learn how to use Excel's GEOMEAN function to find geometric mean.

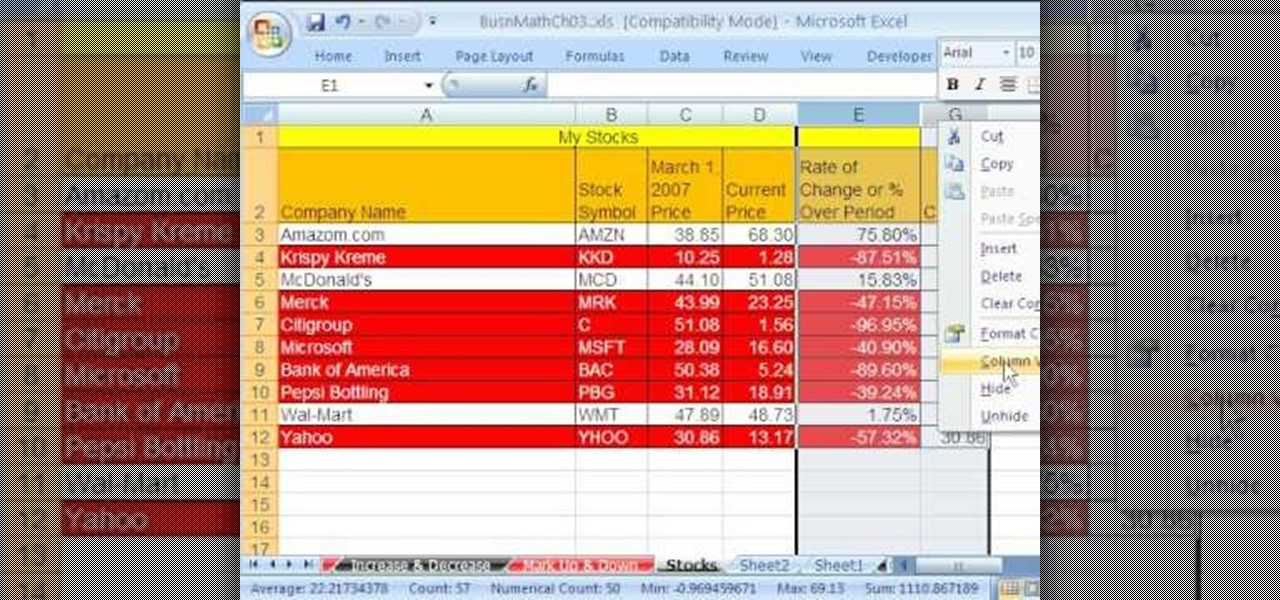
As you might guess, one of the domains in which Microsoft Excel really excels is business math. Brush up on the stuff for your next or current job with this how-to. In this tutorial from everyone's favorite digital spreadsheet guru, YouTube's ExcelIsFun, the 33rd installment in his "Excel Business Math" series of free video lessons, you'll learn how to add current stock prices to a stock analysis table in Excel using a web query.

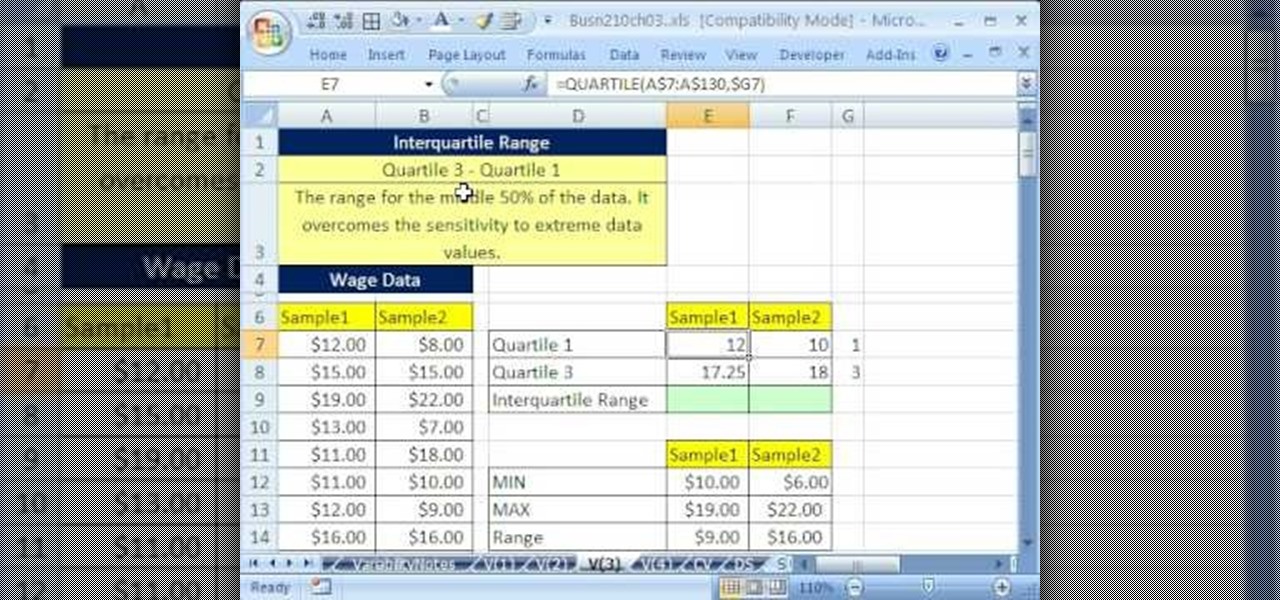
If you use Microsoft Excel on a regular basis, odds are you work with numbers. Put those numbers to work. Statistical analysis allows you to find patterns, trends and probabilities within your data. In this MS Excel tutorial from everyone's favorite Excel guru, YouTube's ExcelsFun, the 40th installment in his "Excel Statistics" series of free video lessons, you'll learn how to calculate range & interquartile range for variability using the MAX, MIN, QUARTILE functions.

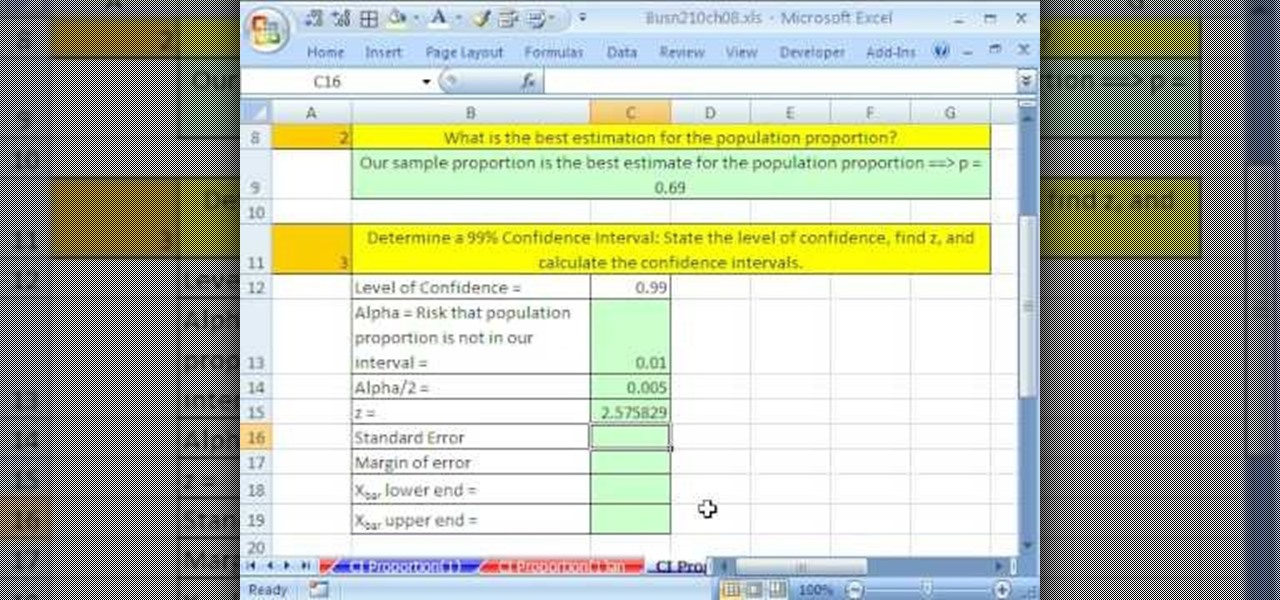
If you use Microsoft Excel on a regular basis, odds are you work with numbers. Put those numbers to work. Statistical analysis allows you to find patterns, trends and probabilities within your data. In this MS Excel tutorial from everyone's favorite Excel guru, YouTube's ExcelsFun, the 86th installment in his "Excel Statistics" series of free video lessons, you'll learn how to construct confidence intervals for proportions using NORMSINV function and other formulas.

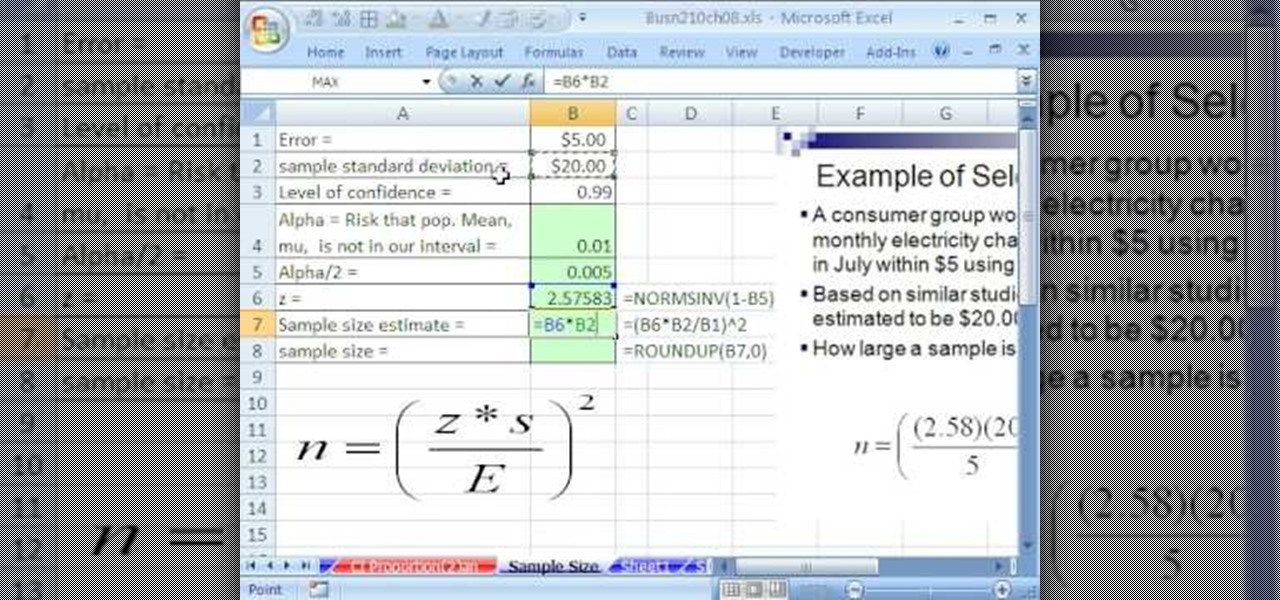
If you use Microsoft Excel on a regular basis, odds are you work with numbers. Put those numbers to work. Statistical analysis allows you to find patterns, trends and probabilities within your data. In this MS Excel tutorial from everyone's favorite Excel guru, YouTube's ExcelsFun, the 87th installment in his "Excel Statistics" series of free video lessons, you'll learn how to calculate sample size (n) for confidence intervals.

If you use Microsoft Excel on a regular basis, odds are you work with numbers. Put those numbers to work. Statistical analysis allows you to find patterns, trends and probabilities within your data. In this MS Excel tutorial from everyone's favorite Excel guru, YouTube's ExcelsFun, the 27th installment in his "Excel Statistics" series of free video lessons, you'll learn how to create a quantitative data dot plot chart using the REPT and COUNTIF functions.

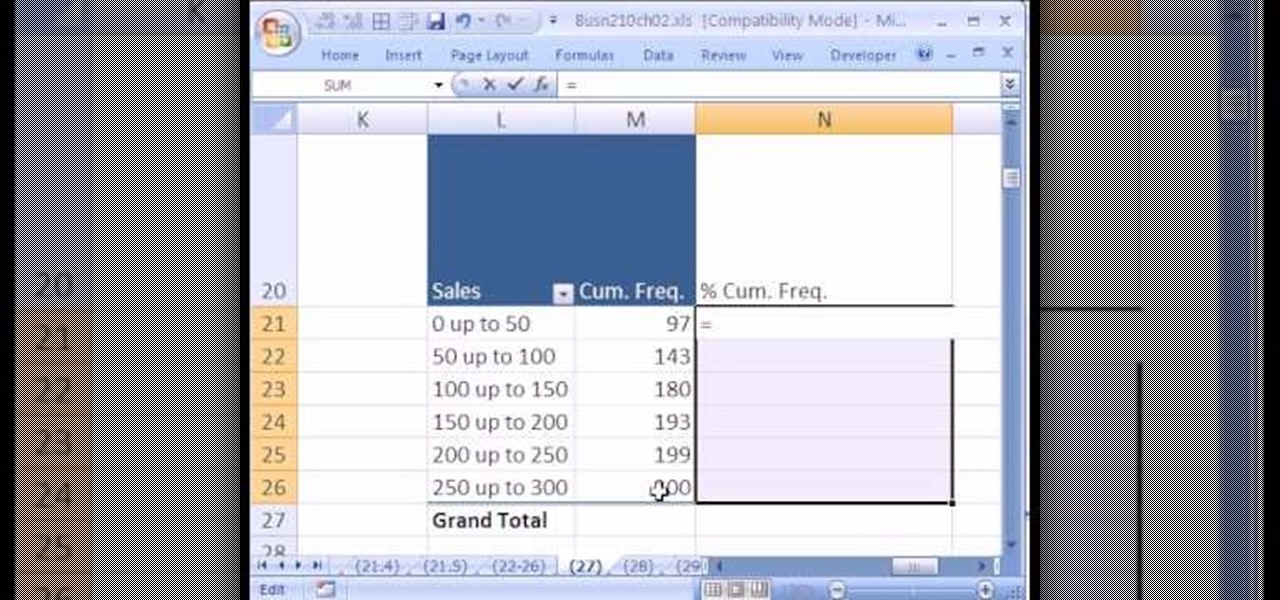
If you use Microsoft Excel on a regular basis, odds are you work with numbers. Put those numbers to work. Statistical analysis allows you to find patterns, trends and probabilities within your data. In this MS Excel tutorial from everyone's favorite Excel guru, YouTube's ExcelsFun, the 26th installment in his "Excel Statistics" series of free video lessons, you'll learn how to create quantitative data cumulative frequency distributions with pivot tables.

If you use Microsoft Excel on a regular basis, odds are you work with numbers. Put those numbers to work. Statistical analysis allows you to find patterns, trends and probabilities within your data. In this MS Excel tutorial from everyone's favorite Excel guru, YouTube's ExcelsFun, the 16th installment in his "Excel Statistics" series of free video lessons, you'll learn how to cross tabulate & do percentage cross tabulation for categorical data using a pivot table (PivotTable).


