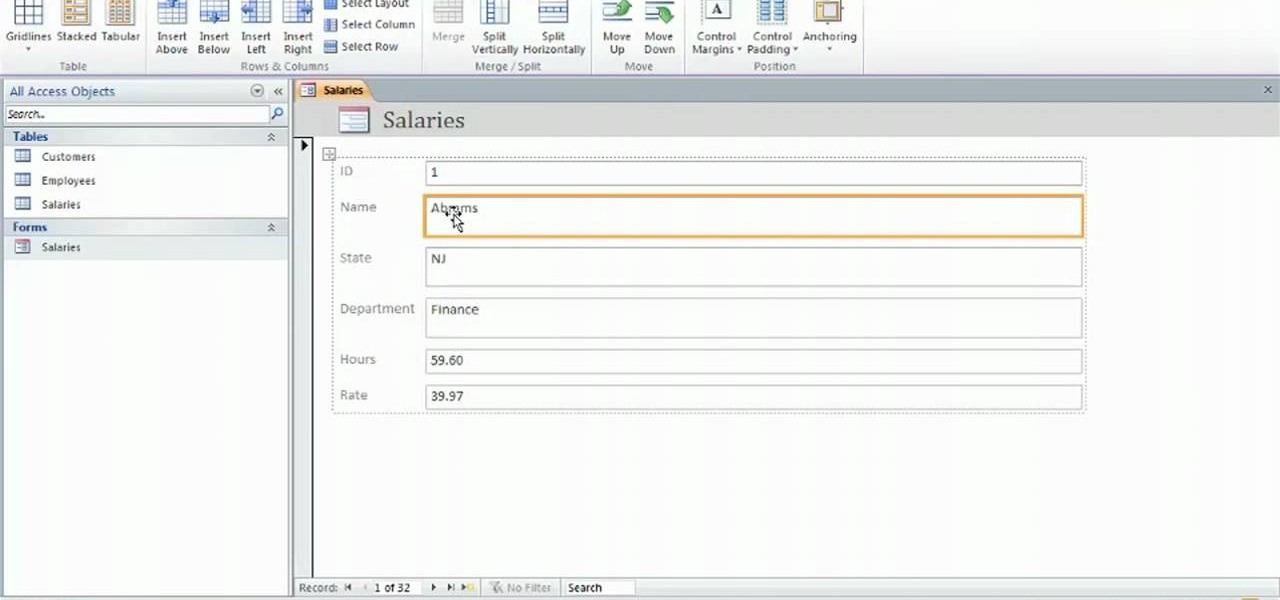
Learn how to use the Layout view when working in Microsoft Access 2010. Whether you're new to Microsoft's popular data management application or a seasoned MS Office professional just looking to better acquaint yourself with the Access 2010 workflow, you're sure to be well served by this video tutorial. For more information, and to get started using the Layout view in your own Access projects, watch this free video guide.
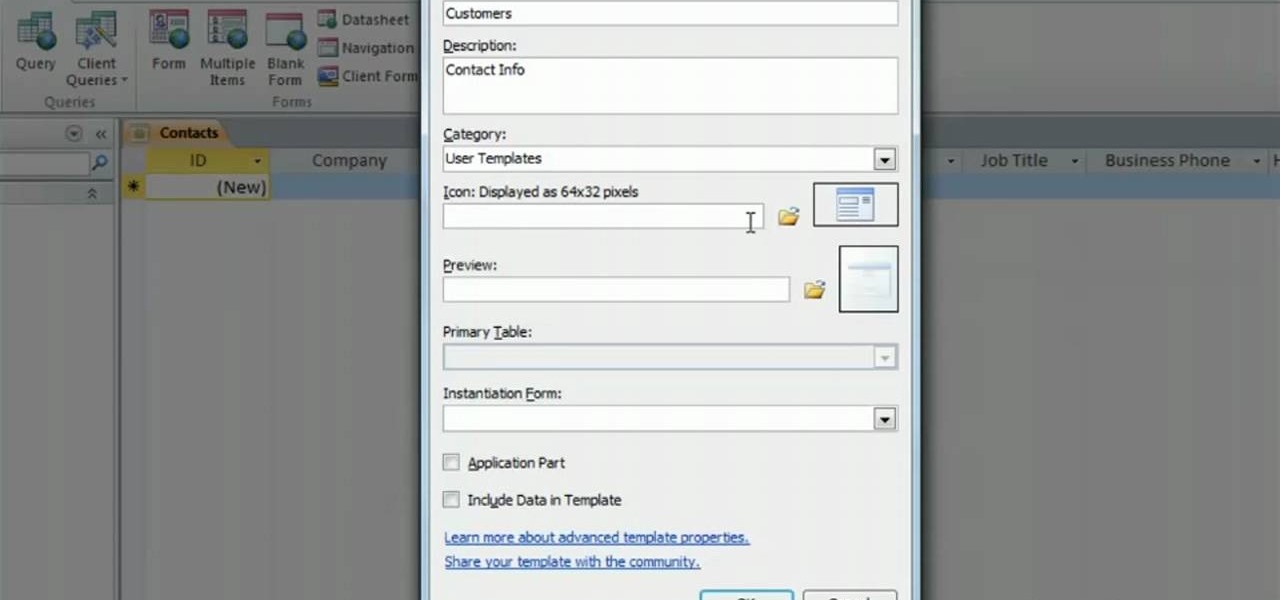
Learn how to work with Application Parts when using Microsoft Access 2010. Whether you're new to Microsoft's popular data management application or a seasoned MS Office professional just looking to better acquaint yourself with the Access 2010 workflow, you're sure to be well served by this video tutorial. For more information, and to get started working with Application Parts in your own Access projects, watch this free video guide.
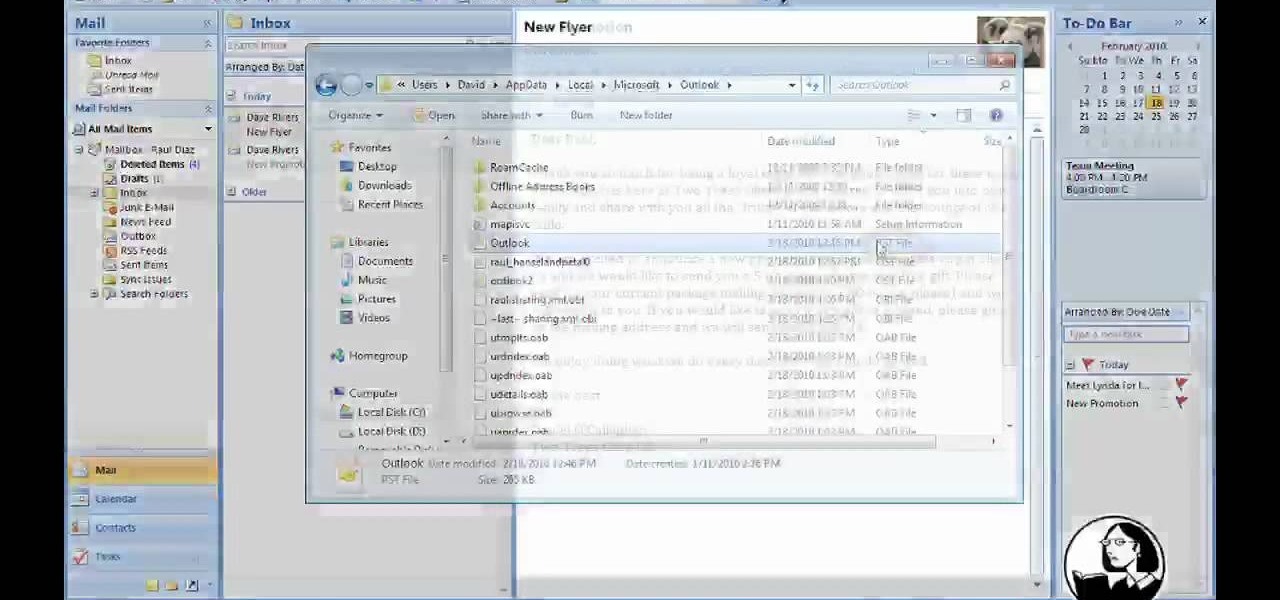
Need help making the switch from Outlook 2003 to 2007? Give this guide a gander. This free video tutorial presents an easy-to-follow overview of everything you'll need to know to migrate your data from one program to the other. For more information, and to get started using Microsoft Outlook 2007, watch this free video guide.
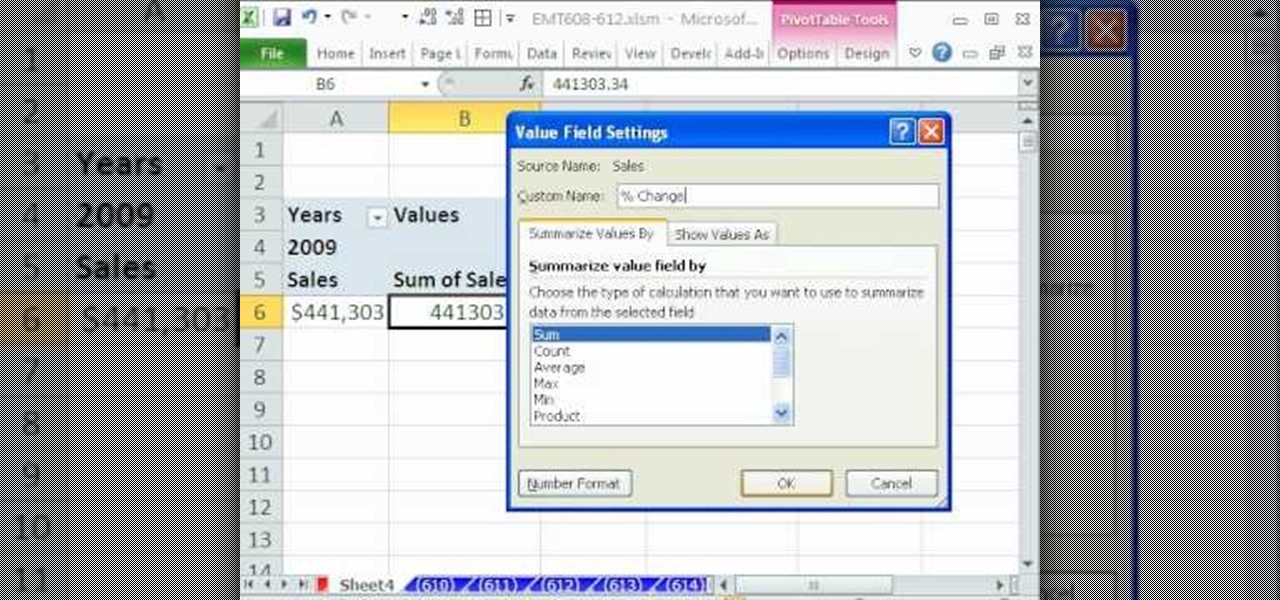
New to Microsoft Excel? Looking for a tip? How about a tip so mind-blowingly useful as to qualify as a magic trick? You're in luck. In this MS Excel tutorial from ExcelIsFun, the 609th installment in their series of digital spreadsheet magic tricks, you'll learn how to build a pivot table to calculate year over year sales showing percentage change.
Password protect your files and folders in Mac OS X. This free video tutorial from CNET TV will show you how. Thwart would-be snoopers with this home cryptography guide, which presents easy-to-follow, step-by-step instructions on how to protect your privacy by encrypting your sensitive data.

Password protect your files and folders in Microsoft Windows XP or Vista. This free video tutorial from CNET TV will show you how. Thwart would-be snoopers with this home cryptography guide, which presents easy-to-follow, step-by-step instructions on how to protect your privacy by encrypting your sensitive data.

f you use Microsoft Excel on a regular basis, odds are you work with numbers. Put those numbers to work. Statistical analysis allows you to find patterns, trends and probabilities within your data. In this MS Excel tutorial from everyone's favorite Excel guru, YouTube's ExcelsFun, the 37th installment in his "Excel Statistics" series of free video lessons, you'll learn how to use the PERCENTILE and QUARTILE functions.
If you use Microsoft Excel on a regular basis, odds are you work with numbers. Put those numbers to work. Statistical analysis allows you to find patterns, trends and probabilities within your data. In this MS Excel tutorial from everyone's favorite Excel guru, YouTube's ExcelsFun, the 47th installment in his "Excel Statistics" series of free video lessons, you'll learn about the basics of the empirical rule (the bell curve) and how to apply it in various ways.
If you use Microsoft Excel on a regular basis, odds are you work with numbers. Put those numbers to work. Statistical analysis allows you to find patterns, trends and probabilities within your data. In this MS Excel tutorial from everyone's favorite Excel guru, YouTube's ExcelsFun, the 89th installment in his "Excel Statistics" series of free video lessons, you'll learn how to use the NORMSINV function for critical values and the NORSDIST function for p-values.
If you use Microsoft Excel on a regular basis, odds are you work with numbers. Put those numbers to work. Statistical analysis allows you to find patterns, trends and probabilities within your data. In this MS Excel tutorial from everyone's favorite Excel guru, YouTube's ExcelsFun, the 91st installment in his "Excel Statistics" series of free video lessons, you'll learn how to use TINV and TDIST functions to find critical values given an unknown sigma value.
If you use Microsoft Excel on a regular basis, odds are you work with numbers. Put those numbers to work. Statistical analysis allows you to find patterns, trends and probabilities within your data. In this MS Excel tutorial from everyone's favorite Excel guru, YouTube's ExcelsFun, the 80th installment in his "Excel Statistics" series of free video lessons, you'll learn how to construct confidence intervals when the sigma is known known using the CONFIDENCE and NORMSINV functions.
If you use Microsoft Excel on a regular basis, odds are you work with numbers. Put those numbers to work. Statistical analysis allows you to find patterns, trends and probabilities within your data. In this MS Excel tutorial from everyone's favorite Excel guru, YouTube's ExcelsFun, the 21st installment in his "Excel Statistics" series of free video lessons, you'll learn how to build labels and counting formulas for a frequency distribution.
If you use Microsoft Excel on a regular basis, odds are you work with numbers. Put those numbers to work. Statistical analysis allows you to find patterns, trends and probabilities within your data. In this MS Excel tutorial from everyone's favorite Excel guru, YouTube's ExcelsFun, the 87th installment in his "Excel Statistics" series of free video lessons, you'll learn how to use NORMSINV to test a hypothesis with population standard deviation (sigma) known and proportions.
If you use Microsoft Excel on a regular basis, odds are you work with numbers. Put those numbers to work. Statistical analysis allows you to find patterns, trends and probabilities within your data. In this MS Excel tutorial from everyone's favorite Excel guru, YouTube's ExcelsFun, the 5th installment in his "Excel Statistics" series of free video lessons, you'll learn how to use relative and absolute cell references to save time when writing formulas.
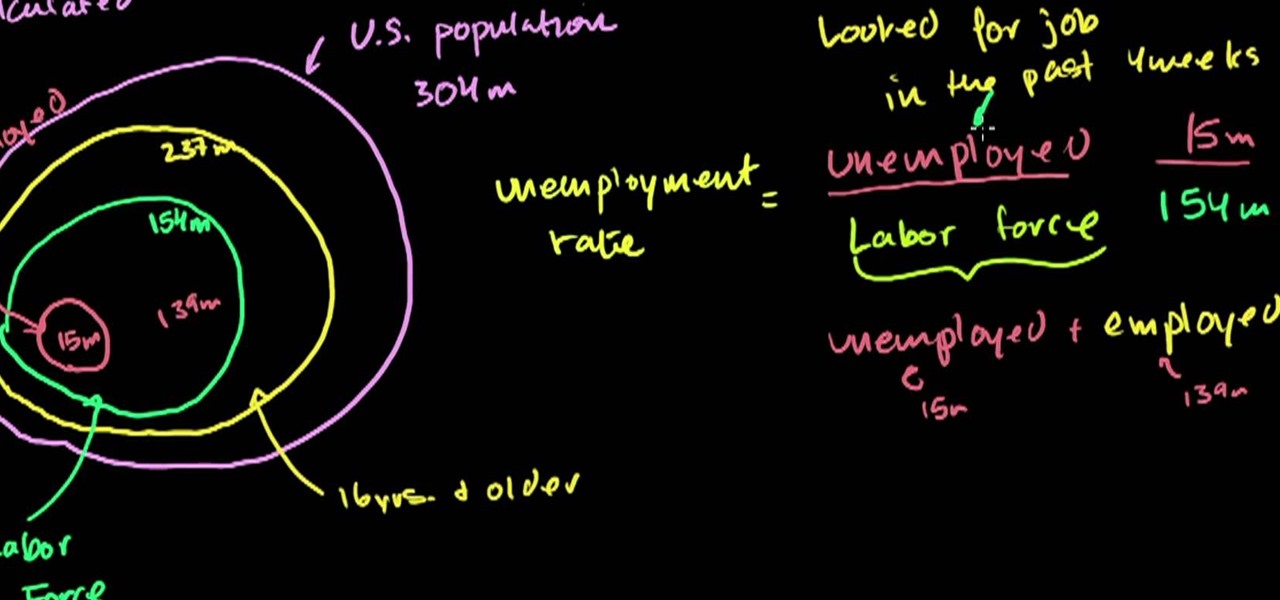
From Ramanujan to calculus co-creator Gottfried Leibniz, many of the world's best and brightest mathematical minds have belonged to autodidacts. And, thanks to the Internet, it's easier than ever to follow in their footsteps (or just study for that next big test). With this installment from Internet pedagogical superstar Salman Khan's series of free math tutorials, you'll learn how to calculate the US unemployment rate given the raw data.
From Ramanujan to calculus co-creator Gottfried Leibniz, many of the world's best and brightest mathematical minds have belonged to autodidacts. And, thanks to the Internet, it's easier than ever to follow in their footsteps (or just study for that next big test). With this installment from Internet pedagogical superstar Salman Khan's series of free math tutorials, you'll learn how to create a simple histogram chart.
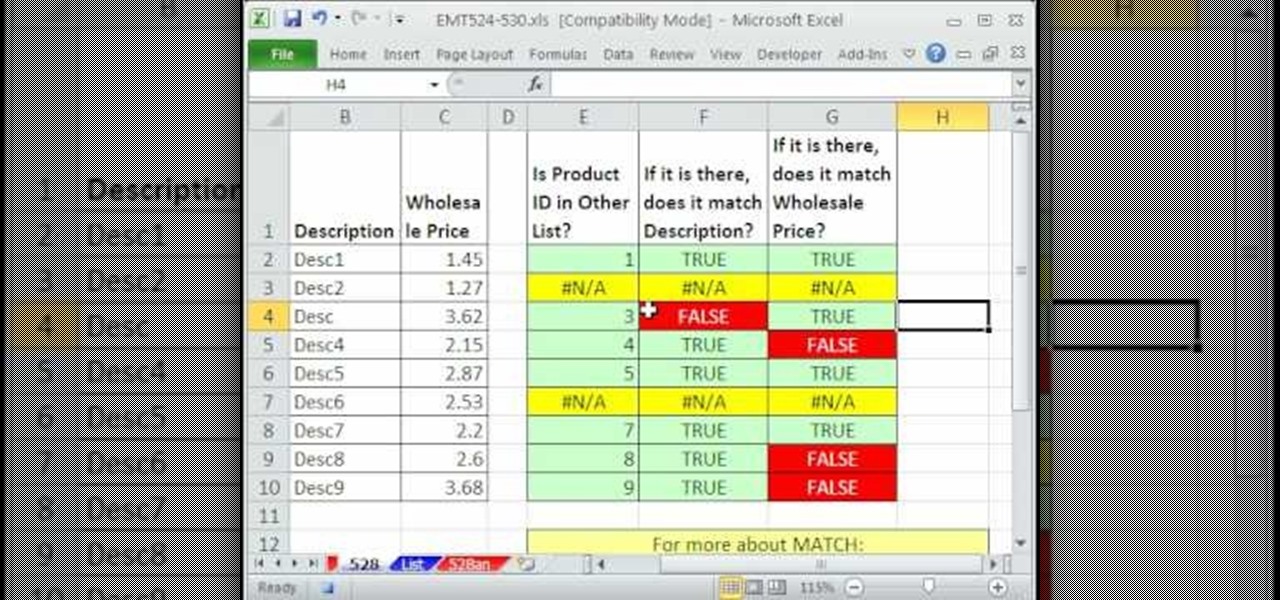
New to Microsoft Excel? Looking for a tip? How about a tip so mind-blowingly useful as to qualify as a magic trick? You're in luck. In this MS Excel tutorial from ExcelIsFun, the 528th installment in their series of digital spreadsheet magic tricks, you'll learn how to check two data sets (lists & tables) to see if there are discrepancies using the MATCH and VLOOKUP functions.
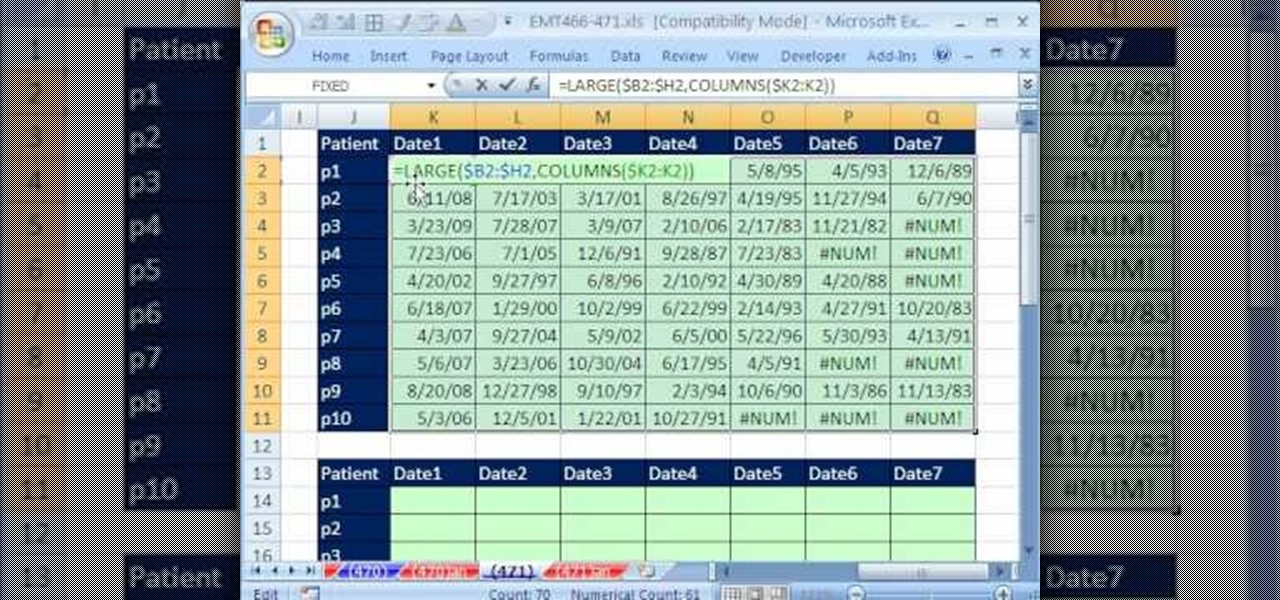
New to Microsoft Excel? Looking for a tip? How about a tip so mind-blowingly useful as to qualify as a magic trick? You're in luck. In this MS Excel tutorial from ExcelIsFun, the 471st installment in their series of digital spreadsheet magic tricks, you'll learn how to sort horizontally with 3 different formulas that use the LARGE, SMALL, COLUMNS, IFERROR and IF functions.
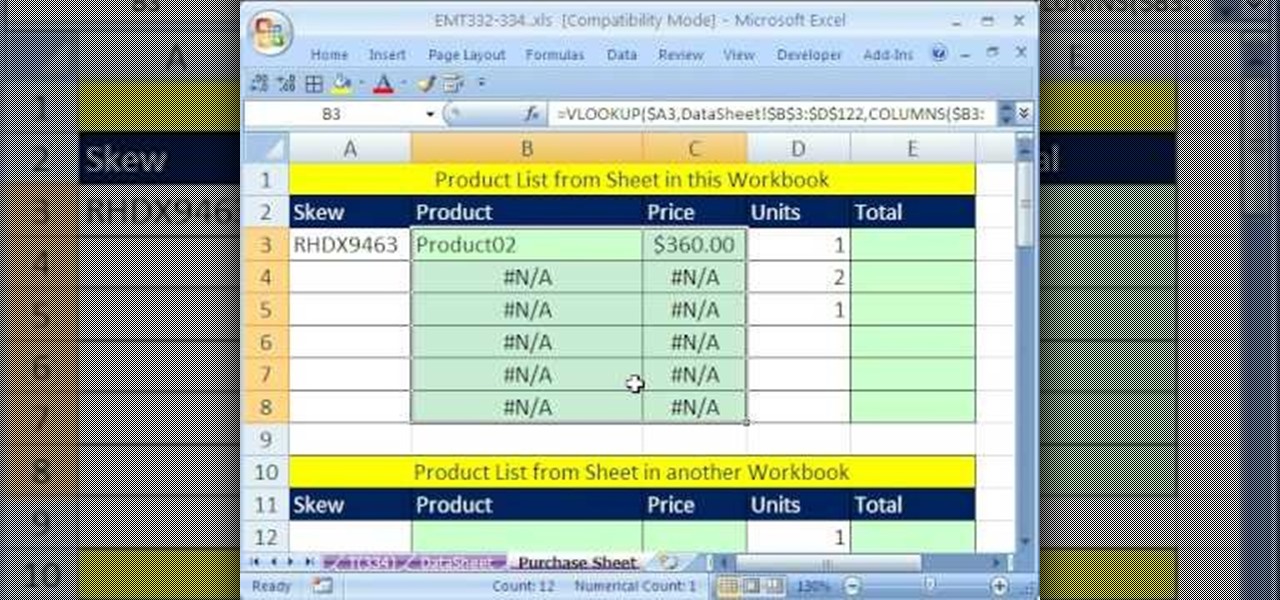
New to Excel? Looking for a tip? How about a tip so mind-blowingly useful as to qualify as a magic trick? You're in luck. In this Excel tutorial from ExcelIsFun, the 334th installment in their series of digital spreadsheet magic tricks, you'll learn how to use VLOOKUP & data validation to make an invoice when the product list is on a different sheet or different workbook.
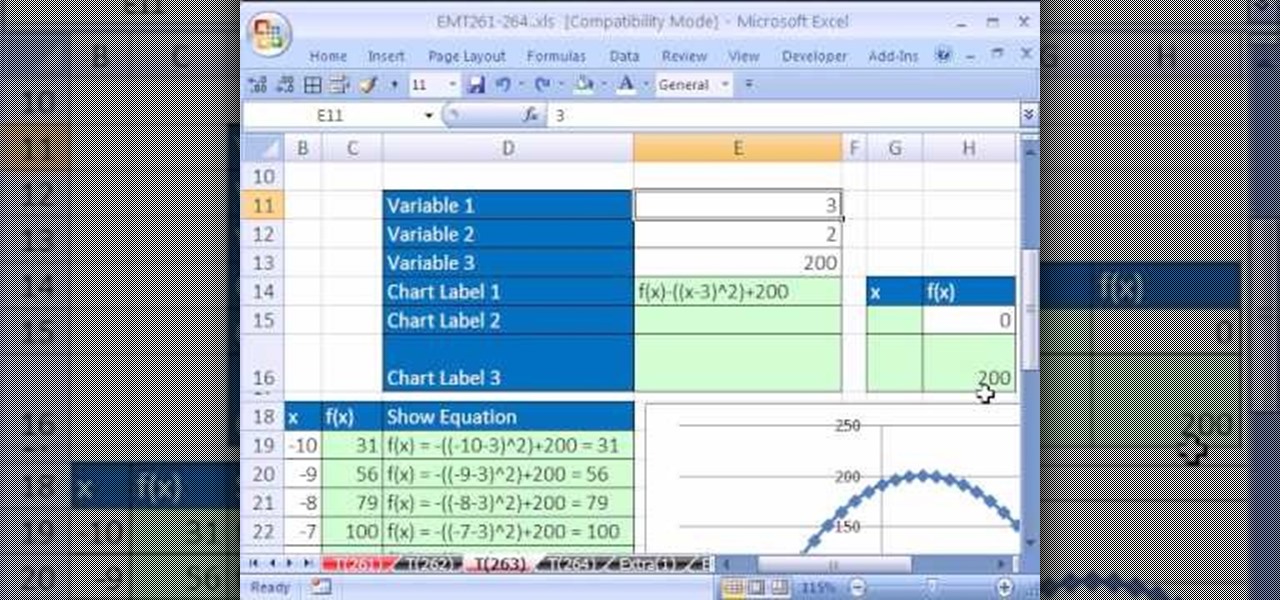
New to Microsoft Excel? Looking for a tip? How about a tip so mind-blowingly useful as to qualify as a magic trick? You're in luck. In this Excel tutorial from ExcelIsFun, the 263rd installment in their series of digital spreadsheet magic tricks, you'll learn how to create a completely dynamic math equation system (function of x) with formulas, data points, charts and chart labels.
From Ramanujan to calculus co-creator Gottfried Leibniz, many of the world's best and brightest mathematical minds have belonged to autodidacts. And, thanks to the Internet, it's easier than ever to follow in their footsteps (or just study for that next big test). With this installment from Internet pedagogical superstar Salman Khan's series of free math tutorials, you'll learn how to use statistical range, variance and standard deviation to measure dispersion in a data set.
Network mapping lets PC users organize multiple computers into a system that provides informational data access. This video tutorial shows how to set file sharing permissions and assign users designated privileges within a network. Establishing a network provides functionality within a workplace and facilitates virtual communication among users.
In this video one of the ultimate iPhone hackers, Jonathan A. Zdziarsk, demonstrates how to use a forensics toolkit to recover deleted text messages on an iPhone. But wait - there's more! Not only can you access text messages, but almost any other data on an iPhone as well. We can't be responsible for what you find though!
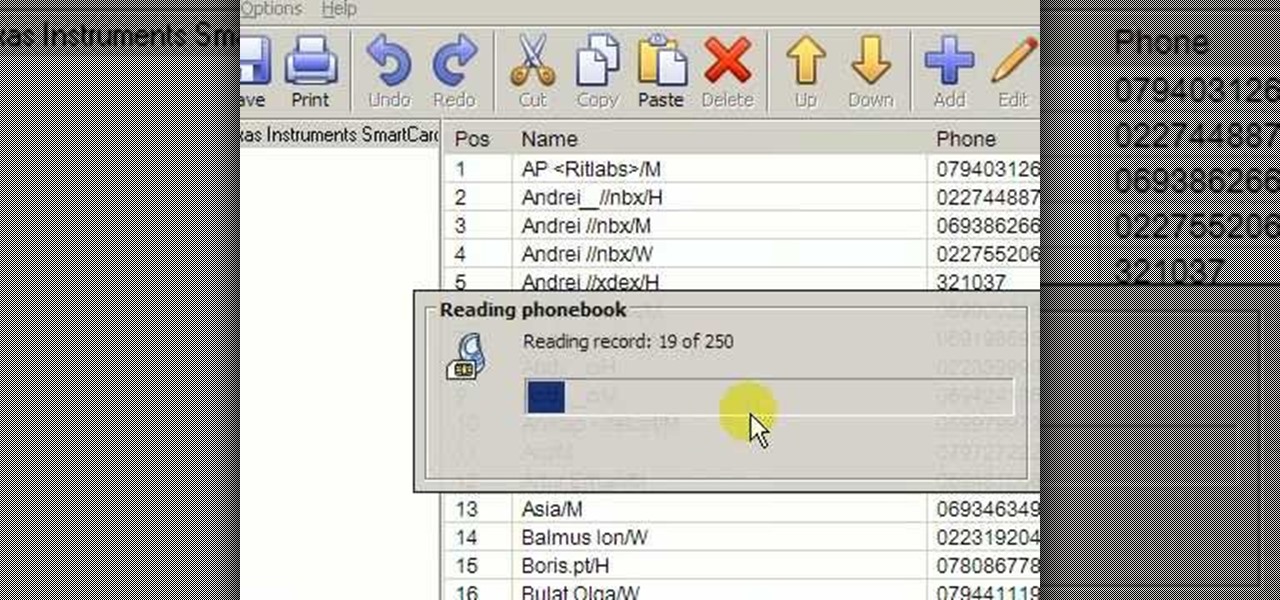
Accidentally deleted your address book? Got some sneaking suspicions you want to clear up? Got something to hide - permanently? In this video you'll learn what hardware and software you need and how to use it to recover deleted text messages, or, conversely, how to delete data permanently from your SIM card. Don't worry - we won't judge.
This shows a step by step method for using the Wii controller to output MIDI control to Apple Logic Pro and "conduct" MIDI with the Wii stick! This is a way cool Wii hack that makes the bluetooth controller work with Logic. You need to install another program to receive and control the data.
Here's a demo which shows a way to produce WAV sound files with TEXT using Photoshop or any photo editing software.
The Nessus vulnerability scanner, is the world-leader in active scanners, featuring high speed discovery, configuration auditing, asset profiling, sensitive data discovery and vulnerability analysis of your security posture. Nessus scanners can be distributed throughout an entire enterprise, inside DMZs, and across physically separate networks. In this network security video tutorial, you'll learn how to hack a network using Nessus 3.
Using morphs to pre-process UVs is a great trick for any version of modo. You can leverage the embedded morph data to massage a model in 3D prior to UV projection. If that doesn't make sense, watch the video and learn how to pre-process UVs using morphs in modo.
Learn how to use MapForce to map or transform XML data in a visual way, creating XSLT 1.0 or 2.0 transformation stylesheets, XQuery 1.0 documents, or program-code in Java or C# in this tutorial, which demonstrates a simple mapping from one XML schema to another. Take a look!
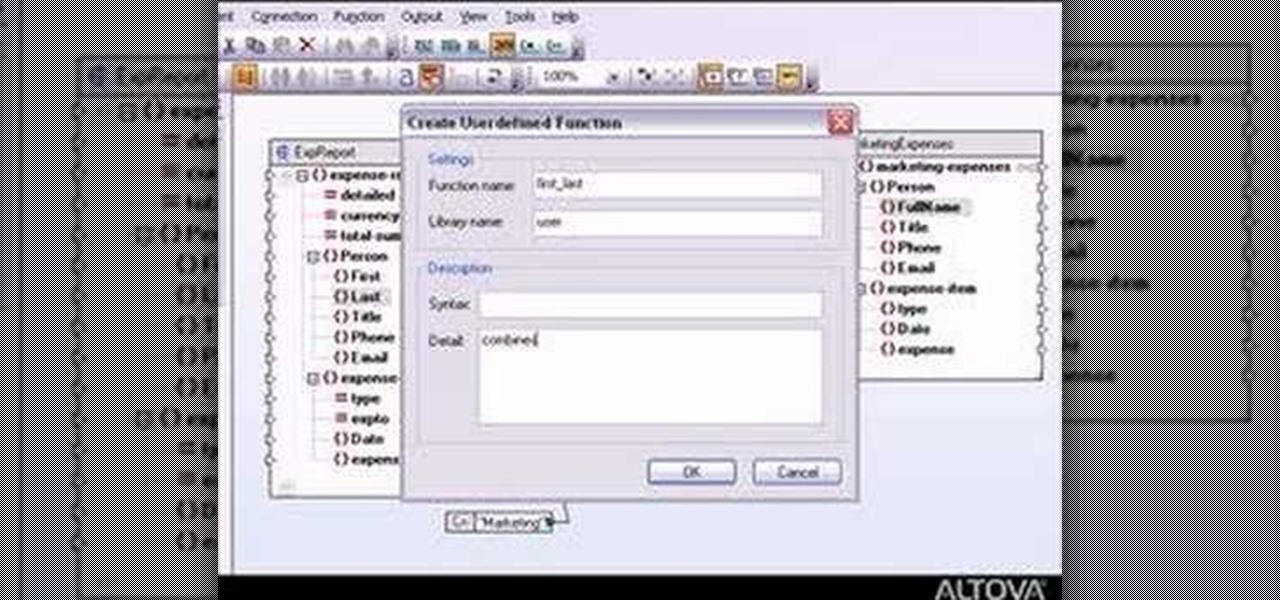
MapForce includes a powerful visual function builder that lets you create new data processing functions in a graphical way using existing functions and libraries. Learn how to combine multiple separate functions that returns a single result with this tutorial.
In this ASP.Net video lesson, you will learn how to display data in your ASP.NET 2.0 Web applications through some of the new databound controls.
How to use Microsoft Excel as a simple database and how to organize and sort data on the fly.
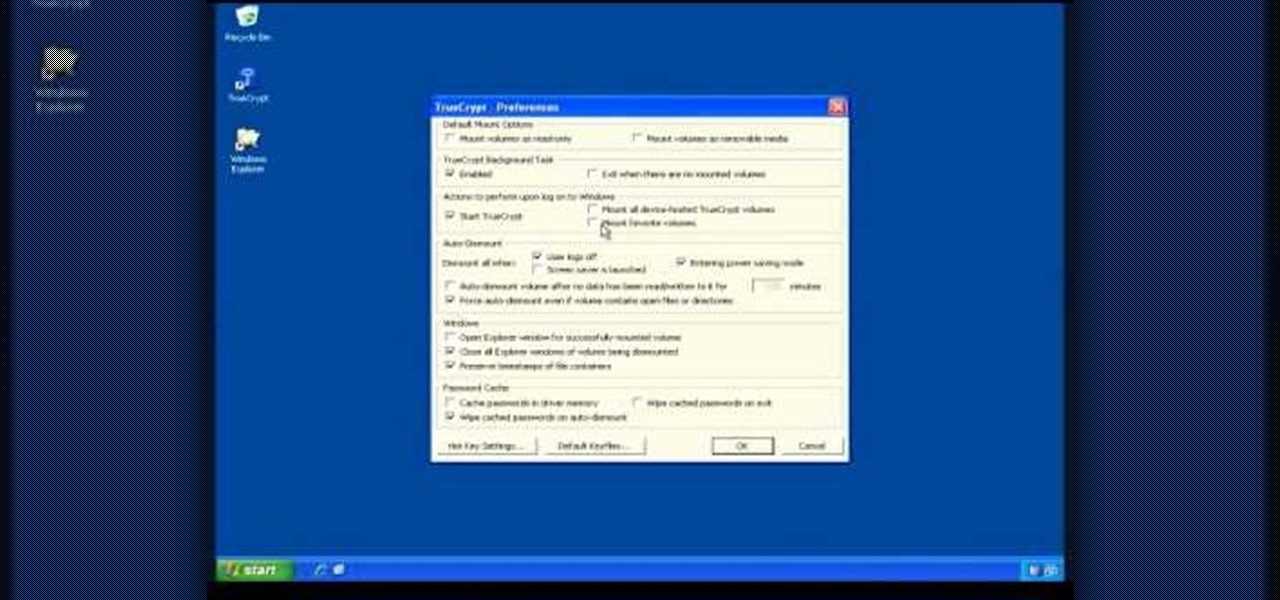
How to use or mount a TrueCrypt volume to access the data that you have encrypted with the program.
You don't need to work in the accounting department of a Fortune 500 company to use and appreciate Microsoft Excel. Although primarily associated with a wide variety of functions pertaining to accounting and finance, Excel is actually an incredibly powerful and multifaceted platform that can be found at the heart of many large-scale analytics environments.
Last week, Apple released the first iOS 13.4 beta with fun and useful new features, such as new Memoji, an upgrade Mail toolbar, and the ability to control your NFC-compatible car via CarKey. To add to that, Apple just released iOS 13.4 developer beta 2, but does the update have any more new changes to be excited about?
Apple's ARKit has built a considerable lead in terms of features over Google's ARCore, but Google's latest update to ARCore adds a capability that makes the platform a bit more competitive with ARKit.
When it comes to the athletic footwear retail game, it's just not enough to just sell shoes anymore.
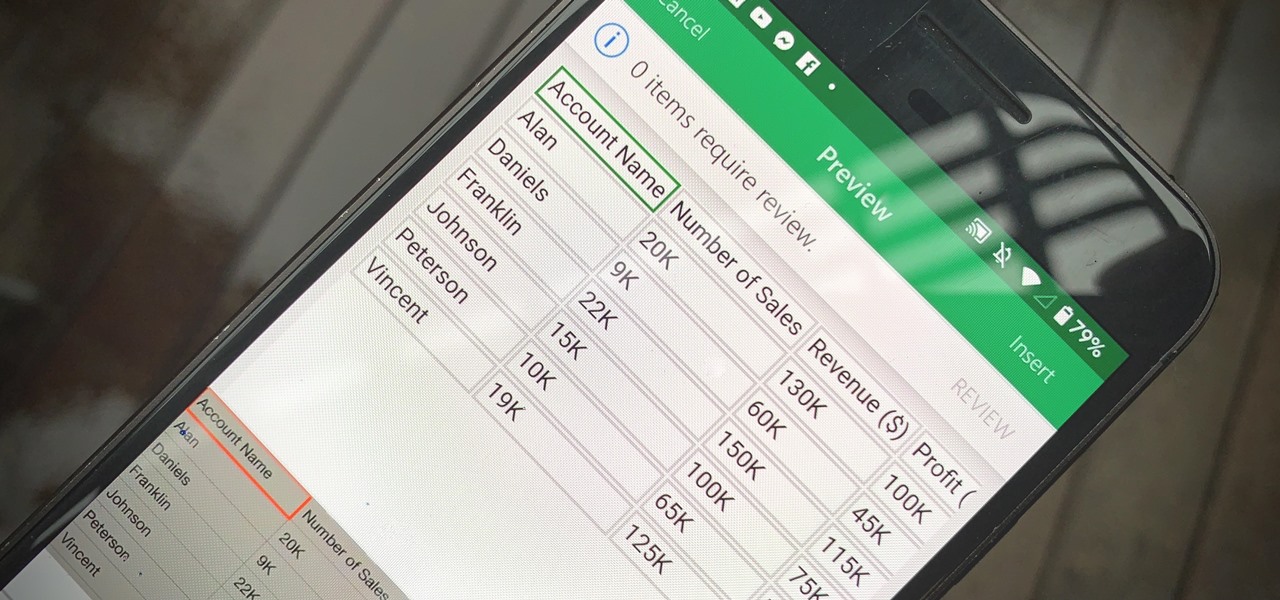
Creating a digital spreadsheet by hand can certainly be tedious, especially if you're copying a printed paper table word for word, number for number. Instead of typing information that's already there, however, use Microsoft Excel on Android or iOS to snap a photo of that printed chart and import it directly into your digital one.
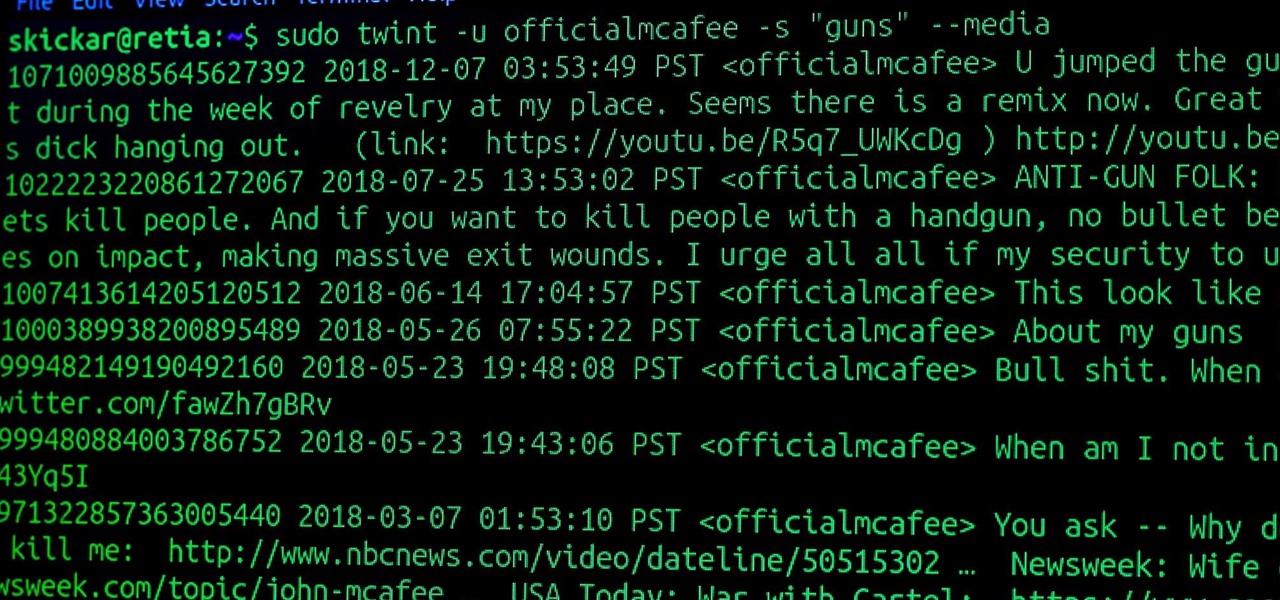
Open-source intelligence researchers and hackers alike love social media for reconnaissance. Websites like Twitter offer vast, searchable databases updated in real time by millions of users, but it can be incredibly time-consuming to sift through manually. Thankfully, tools like Twint can crawl through years of Twitter data to dig up any information with a single terminal command.
At its F8 developer's conference in 2016, Facebook went on record with a roadmap that called for augmented reality integration into Oculus within 10 years. Now, it appears as though Facebook is accelerating those plans.