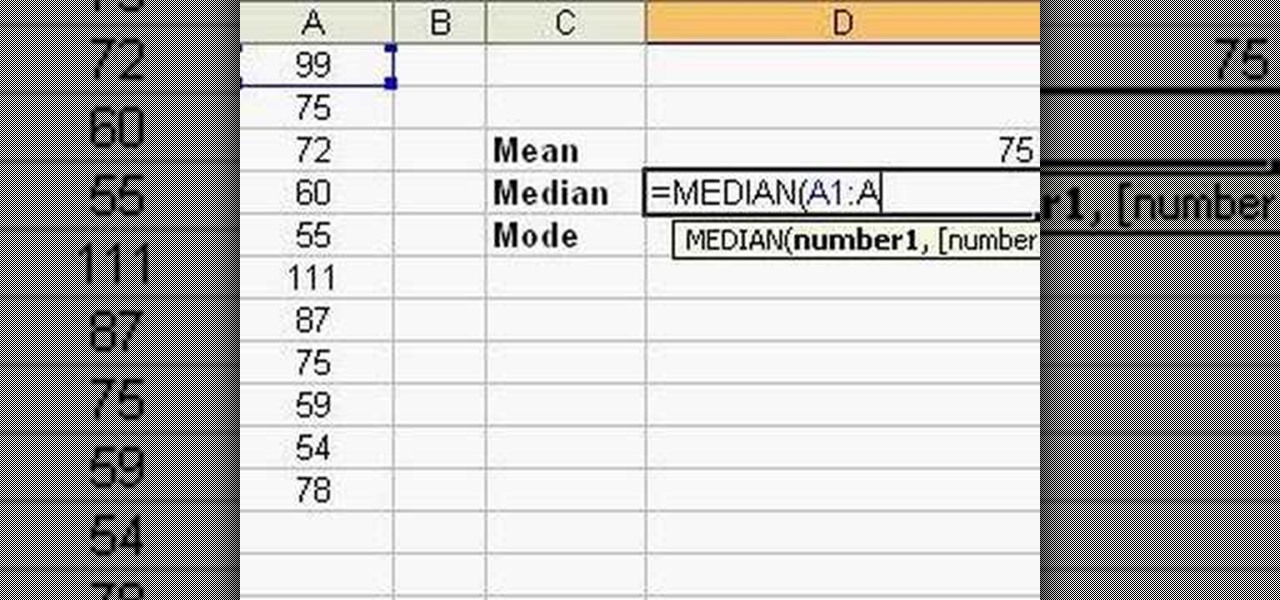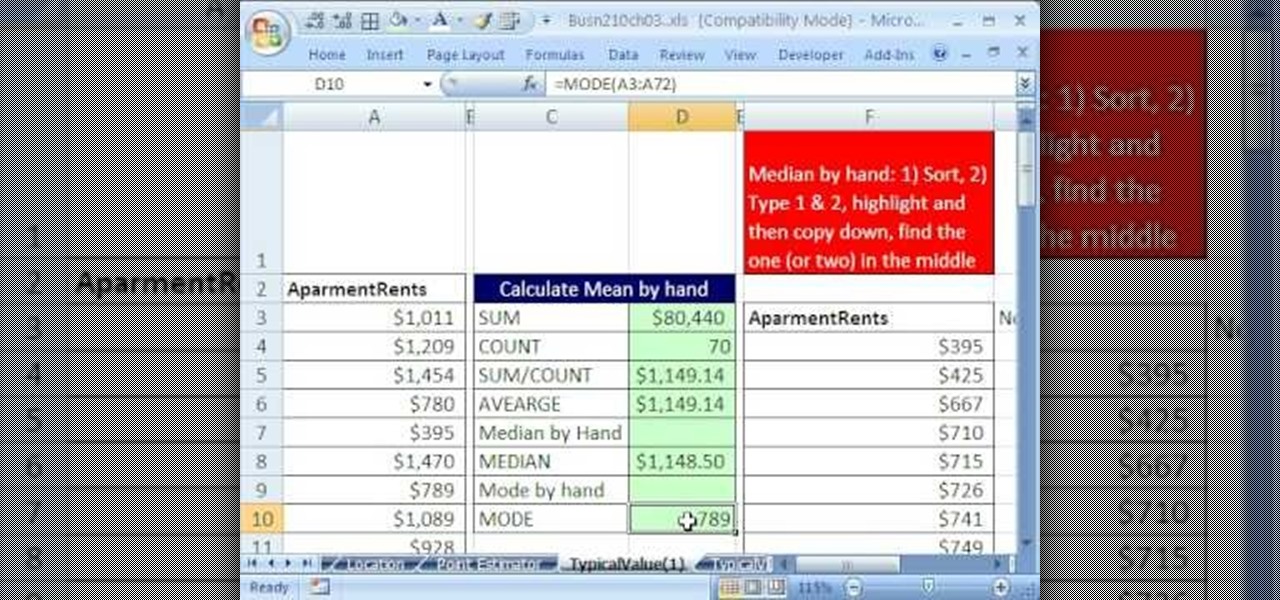
If you use Microsoft Excel on a regular basis, odds are you work with numbers. Put those numbers to work. Statistical analysis allows you to find patterns, trends and probabilities within your data. In this MS Excel tutorial from everyone's favorite Excel guru, YouTube's ExcelsFun, the 34th installment in his "Excel Statistics" series of free video lessons, you'll learn how to use MEAN, MEDIAN, MODE. These measures give us a typical value, a measure of central tendency one value that can repr...
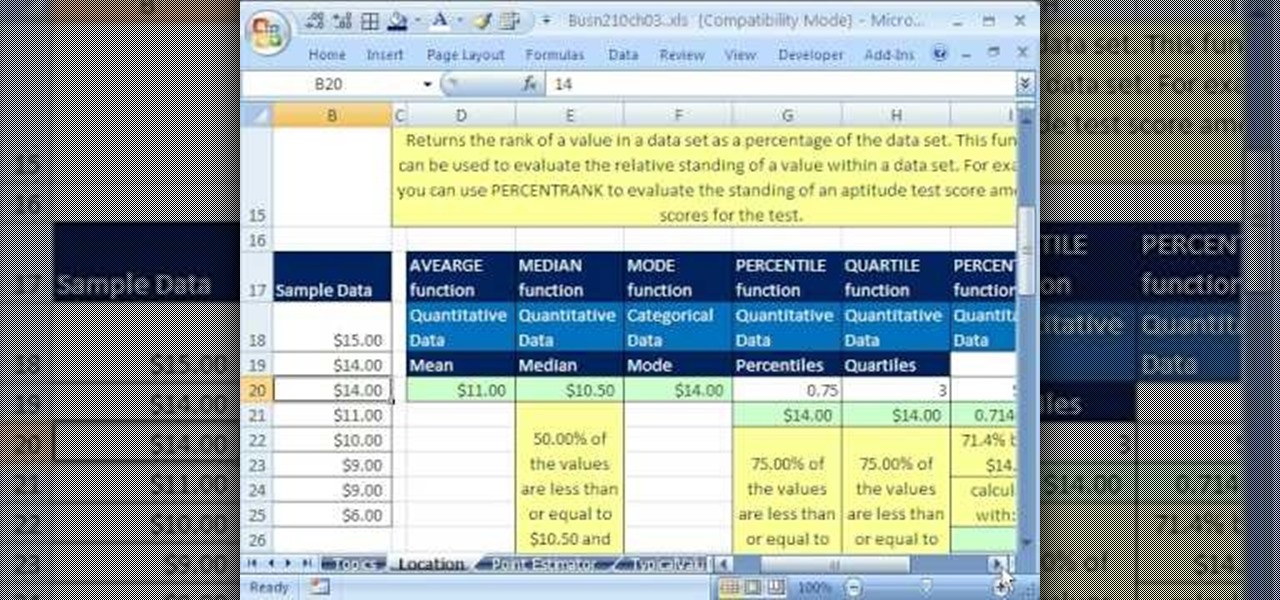
If you use Microsoft Excel on a regular basis, odds are you work with numbers. Put those numbers to work. Statistical analysis allows you to find patterns, trends and probabilities within your data. In this MS Excel tutorial from everyone's favorite Excel guru, YouTube's ExcelsFun, the 33rd installment in his "Excel Statistics" series of free video lessons, you'll learn how to use the AVEARGE, MEDIAN, MODE, PERCENTILE, QUARTILE and PERCENTILERANK functions to measure location.

Whether you're interested in learning Microsoft Excel from the bottom up or just looking to pick up a few tips and tricks, you've come to the right place. In this tutorial from everyone's favorite digital spreadsheet guru, ExcelIsFun, the nth installment in his "Highline Excel Class" series of free video Excel lessons, you'll learn how to do basic statistical analysis in Excel. Specifically, this video covers the following topics:
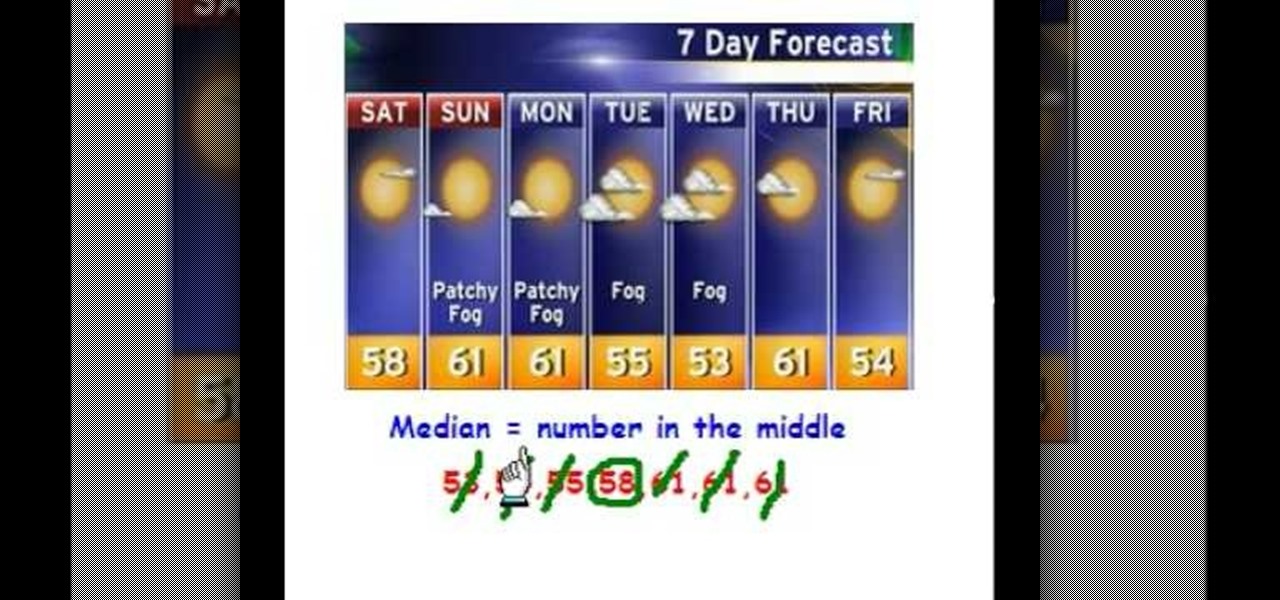
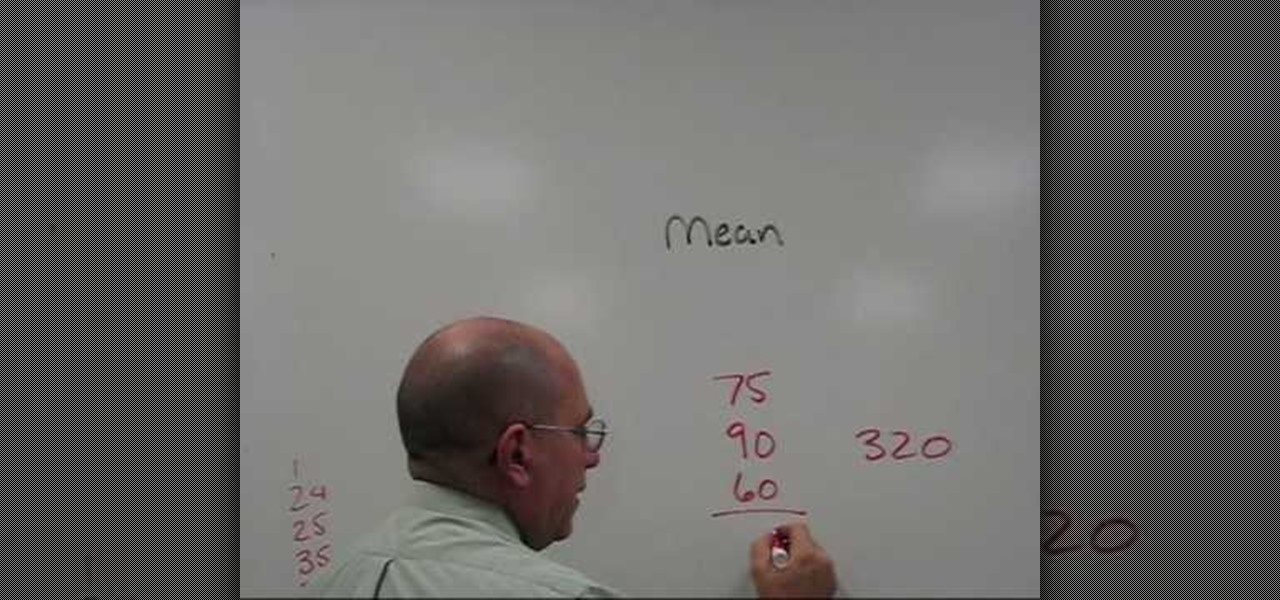
This is a how-to-video which demonstrates techniques to find the median of number in a series. This demonstration takes the following example.

In this tutorial video the author shows how to find the length of the median of a trapezoid. He starts to show that we first need to add the sum of the parallel sides of the trapezoid which are on the either side of the median. Now this obtained value is to be divided by two to get the length of the median. He explains that the length of the median of a trapezoid is nothing but the average of the lengths of the parallel sides of the trapezoid. If you want to learn how to find the length of th...

This video shows us the method to find the median and the inter-quartile range. The first step involves the arrangement of the numbers in the ascending order. Median is the middle number. The middle number is the number at (number of numbers + 1)/2 if the number of numbers is odd or the (number of number)/2 if the number of numbers is even. In the example the number is located at [(11+1)/2] or the 6th number. The inter-quartile range is higher quartile - lower quartile. The higher quartile is...

Follow this video to learn how to formulate calculations in Microsoft Excel. First type in a list of numbers in the cells. In order to calculate the median click on the cell where you want the answer to be shown. Then type equals, average, open bracket and insert the cell code where the first number is, colon, and then type in the cell where the last number in the list lies, and close brackets. In practice this is an example where the numbers are in a list from cell A1 to cell A11: =AVEARAGE(...
The Mean is the average number, the Median is the center of the group and the Mode is the number that shows most often.
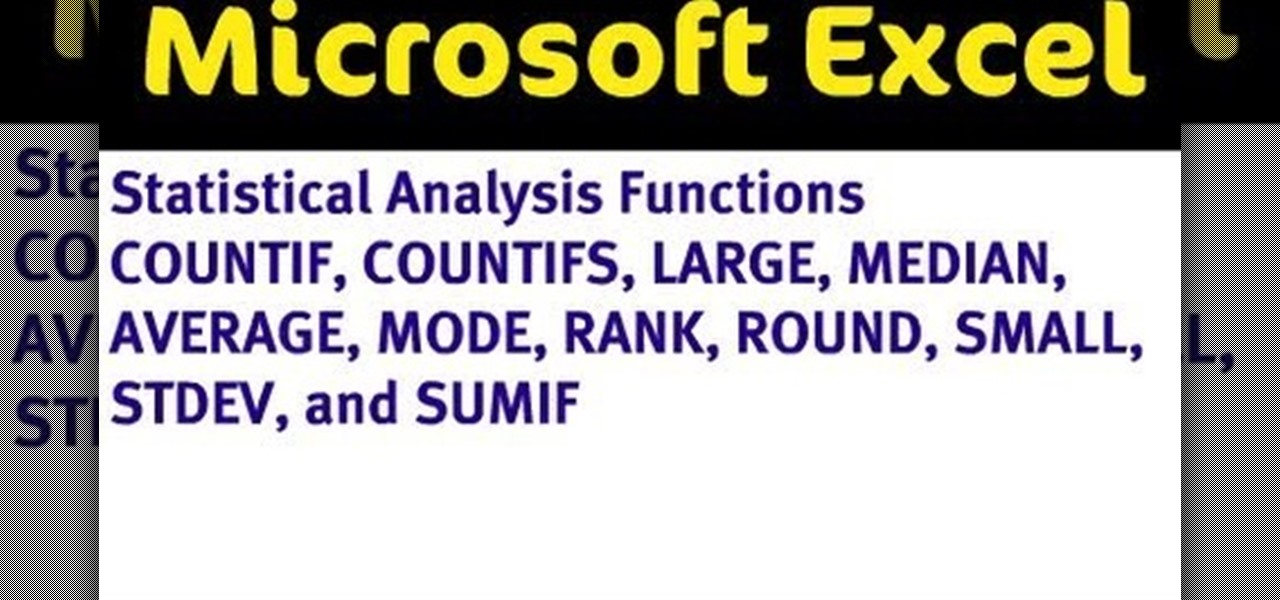
If you use Microsoft Office Excel on anything resembling a regular basis, odds are you work with numbers. Put those numbers to work with this free MS Excel video tutorial, which will teach you how to use a number of Excel's basic statistical functions (e.g., STDEV, AVERAGE, MEDIAN, MODE, RANK, ROUND, LARGE & SMALL).
New to Microsoft Excel? Looking for a tip? How about a tip so mind-blowingly useful as to qualify as a magic trick? You're in luck. In this MS Excel tutorial from ExcelIsFun, the 145th installment in their series of digital spreadsheet magic tricks, you'll learn how to create a formula that will calculate the median when you have more than 1 criterion.
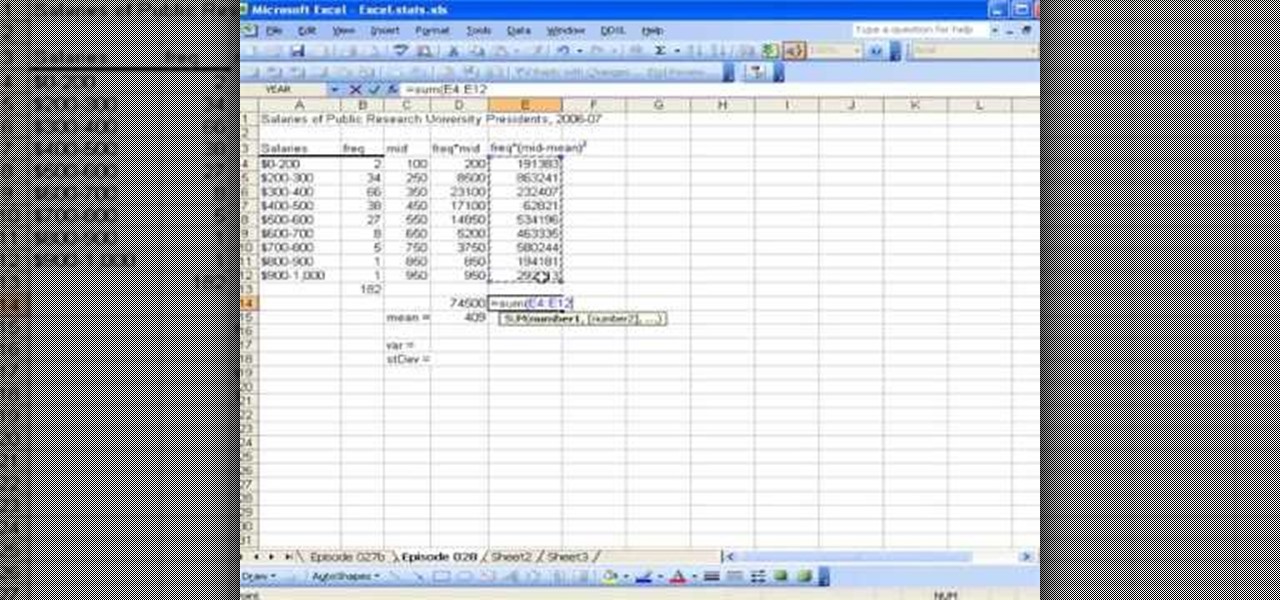
This video shows the method to find the variance and standard deviation using Excel. The variance shows the variability of the data points from the median. We find the difference of the median and the mean. We write the formula using '=' sign. The median and data points are put in it by selecting the appropriate cell. The median is made an absolute constant by pressing the F4 key. This is squared by using '^2'. This is multiplied to the frequency using '*'. The result is found for all the dat...
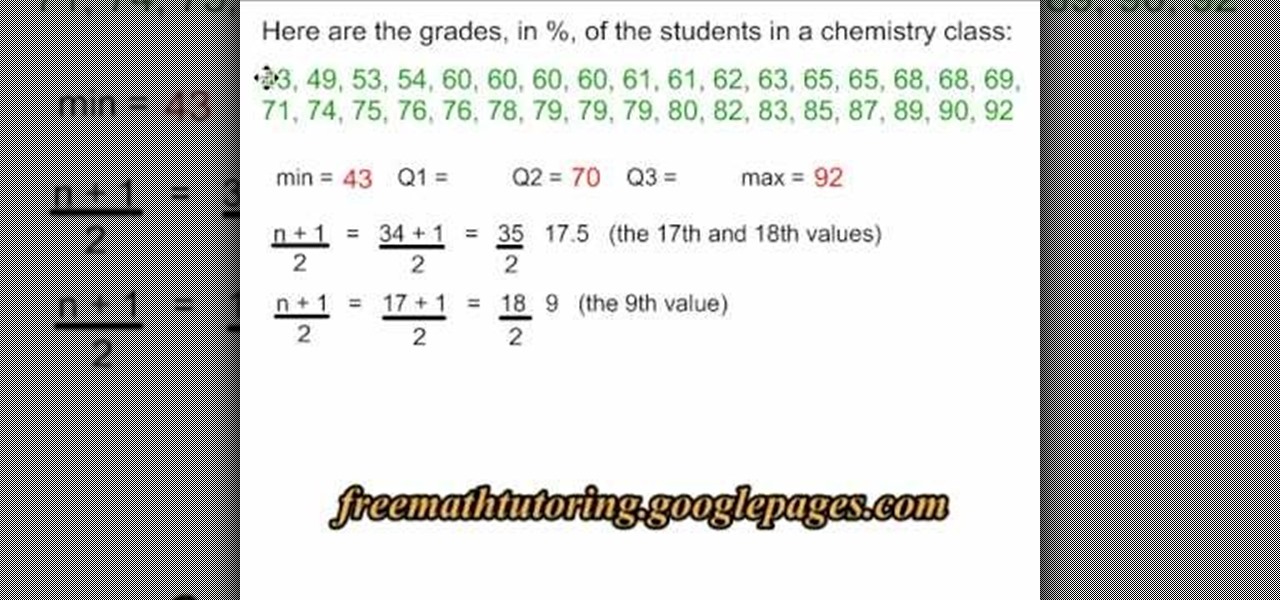
This is an interesting mathematical instructional video on how to make a quartile diagram. This example is about 34 grades obtained by chemistry class students. We need a minimum value, a maximum value, Q1, Q2 and Q3 values to make a quartile diagram. The minimum is 43 and the maximum is 92. To calculate Q2 median formula (n+1 over 2)is used. The Q2 median is 17.5. So the average of 69 and 71 is 70 and hence Q2 70. Similarly Q1 is calculated as 61 and Q3 is calculated as 79. Now you can draw ...
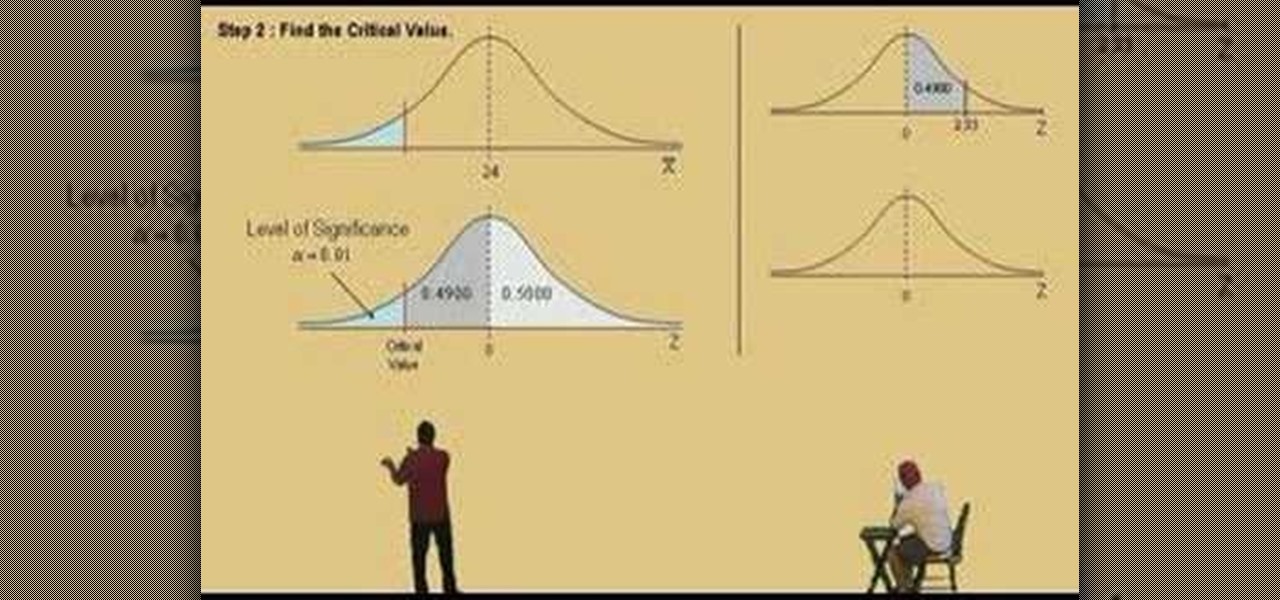
Lawrence Perez, from Saddleback College, and his assistant Charlie, give this introduction to statistics lesson on using the Z tests for the mean. If you don't know about statistics, well, I don't know what to say.
If you've ever had problems with trapezoids in the past, this math lesson should clear some things up. A trapezoid is a geometrical shape, a quadrilateral, that has only one pair of parallel sides. Outside of the US, it's referred to as a trapezium. Yay Math breaks down the properties of trapezoids, including the isosceles trapezoid, the legs of the trapezoid and the median of the trapezoid.
Learn how to minimize the sum of squared error for regression line problems in stats. Whether you need help studying for that next big stats text or just a hand finishing your homework, you're sure to be well served by this four-part free video math lesson from Salman Khan.
Learn about the difference between z- and t-statistics with this video guide. From Ramanujan to calculus co-creator Gottfried Leibniz, many of the world's best and brightest mathematical minds have belonged to autodidacts. And, thanks to the Internet, it's easier than ever to follow in their footsteps. For all of the details, watch this installment from Internet pedagogical superstar Salman Khan's series of free math tutorials.
From Ramanujan to calculus co-creator Gottfried Leibniz, many of the world's best and brightest mathematical minds have belonged to autodidacts. And, thanks to the Internet, it's easier than ever to follow in their footsteps (or just study for that next big test). With this installment from Internet pedagogical superstar Salman Khan's series of free math tutorials, you'll learn how to calculate a confidence interval in basic statistics.
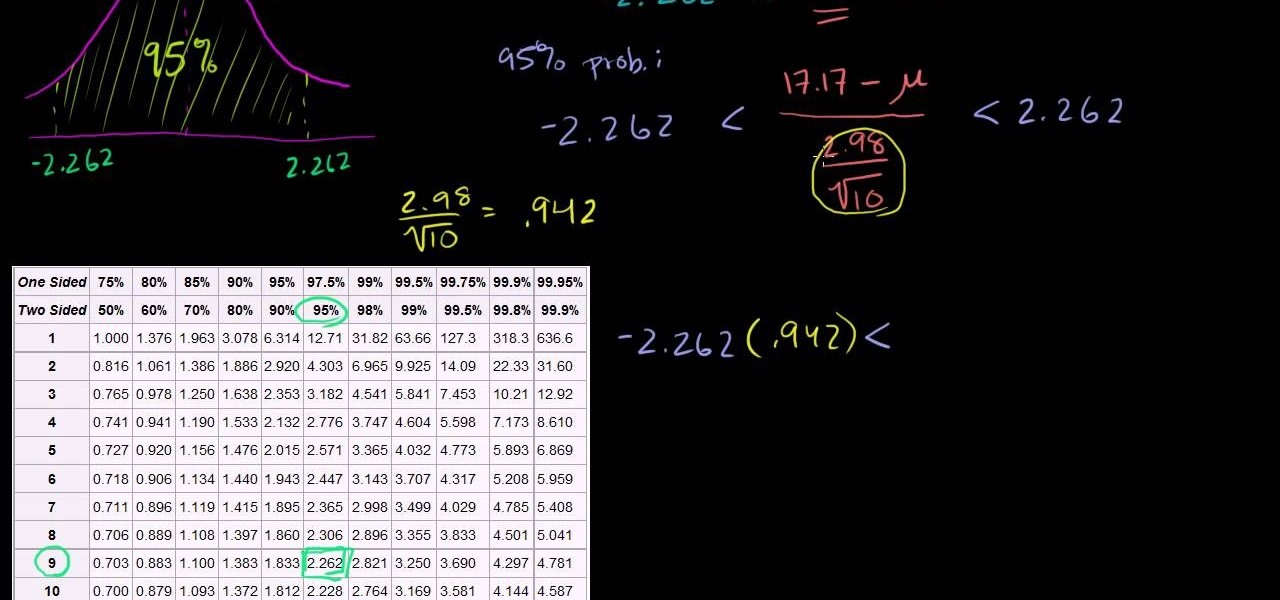
From Ramanujan to calculus co-creator Gottfried Leibniz, many of the world's best and brightest mathematical minds have belonged to autodidacts. And, thanks to the Internet, it's easier than ever to follow in their footsteps (or just study for that next big test). With this installment from Internet pedagogical superstar Salman Khan's series of free math tutorials, you'll learn how to find a 95% confidence interval in statistics.
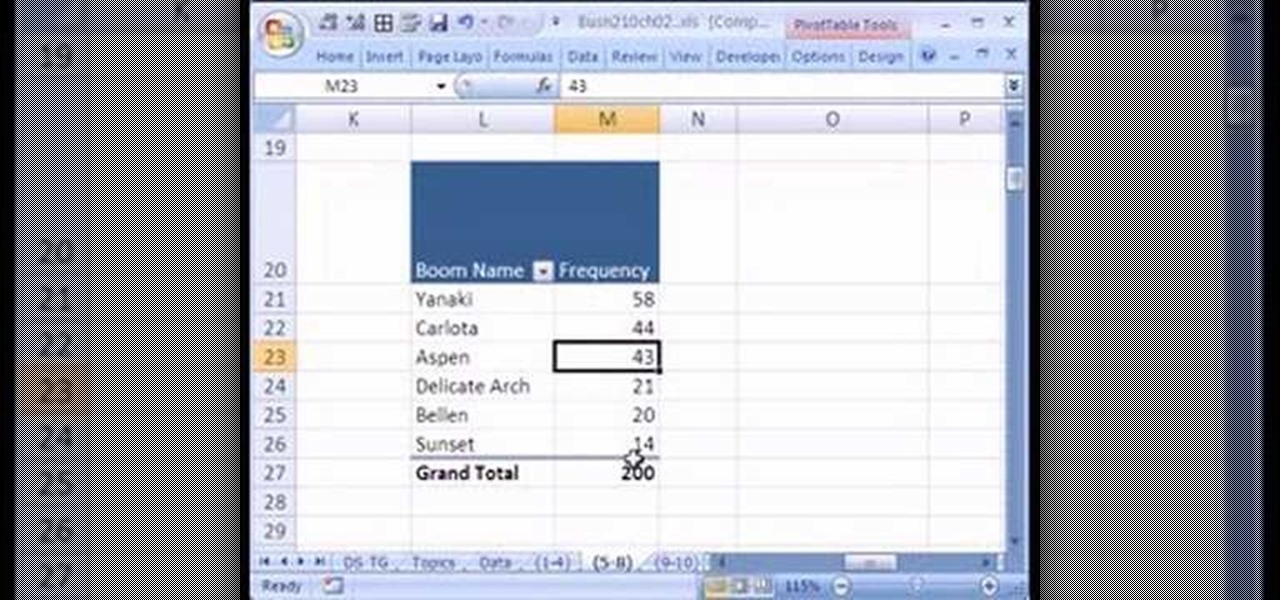
If you use Microsoft Excel on a regular basis, odds are you work with numbers. Put those numbers to work. Statistical analysis allows you to find patterns, trends and probabilities within your data. In this MS Excel tutorial from everyone's favorite Excel guru, YouTube's ExcelsFun, the 15th installment in his "Excel Statistics" series of free video lessons, you'll learn how to use create a frequency distribution, relative frequency distribution, percent frequency distribution and pie chart wi...
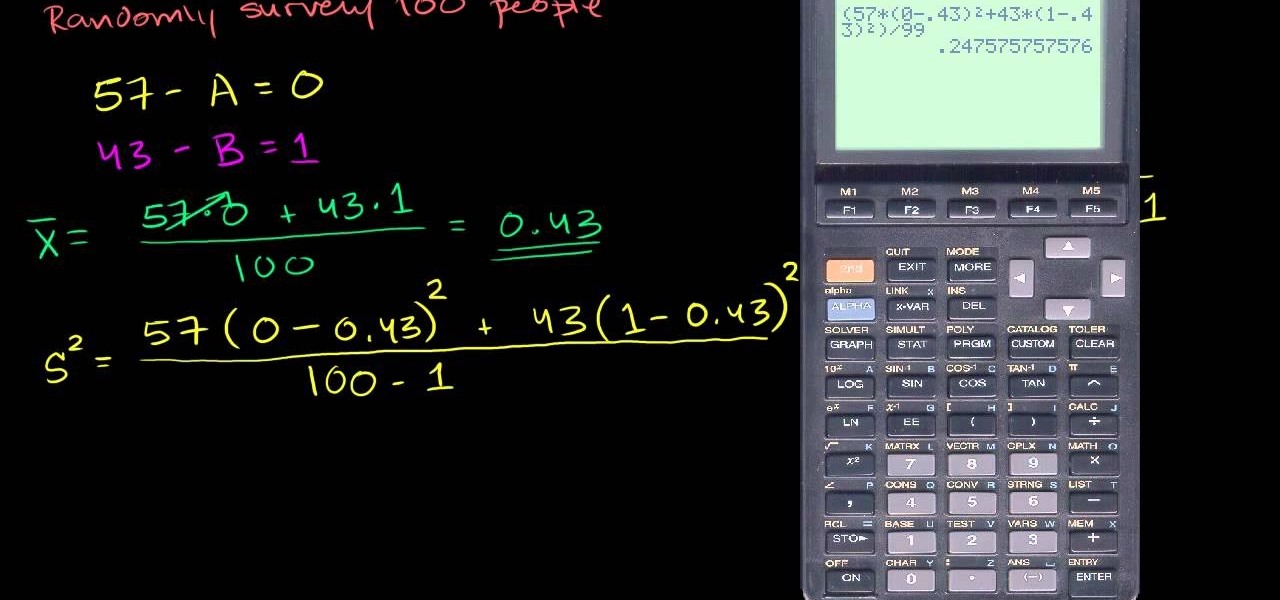
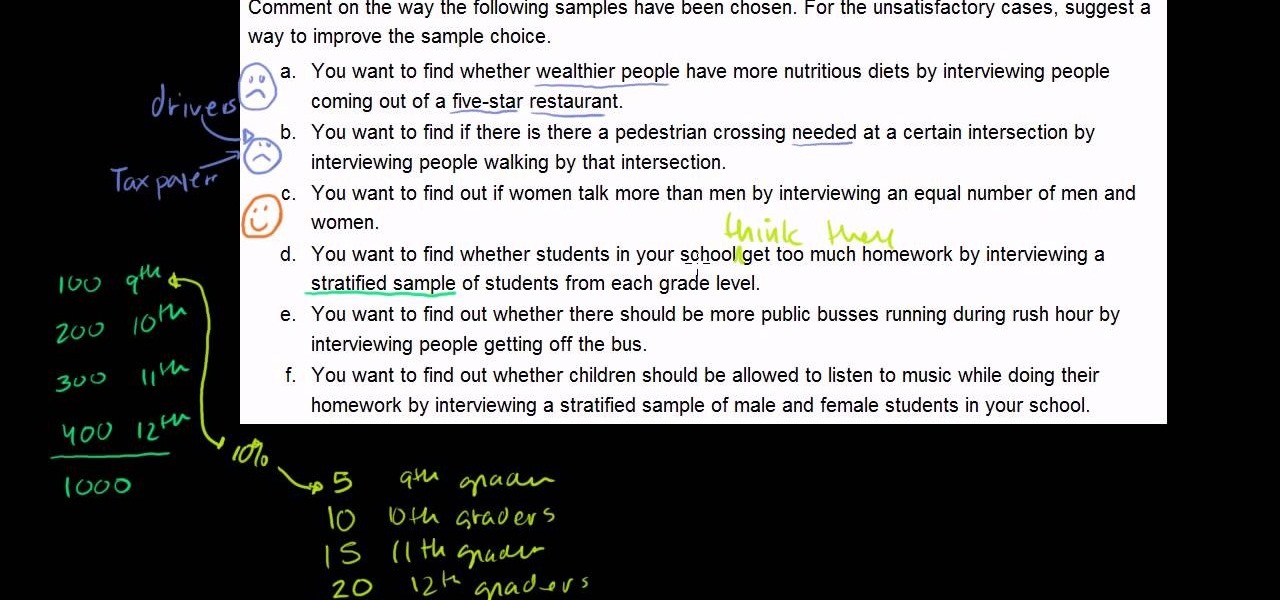
From Ramanujan to calculus co-creator Gottfried Leibniz, many of the world's best and brightest mathematical minds have belonged to autodidacts. And, thanks to the Internet, it's easier than ever to follow in their footsteps (or just finish your homework or study for that next big test). With this installment from Internet pedagogical superstar Salman Khan's series of free math tutorials, you'll learn how to work with surveys and samples in general statistics.
Need a little help in your Statistics class? In this statistics tutorial hosted by The Free Math Tutor, a demonstration of how to use the Sharp EL531W calculator to find the correlation coefficient (r-value) and the equation of a regression line is given. Want some more practice? For exercises and answer sheets, go here.
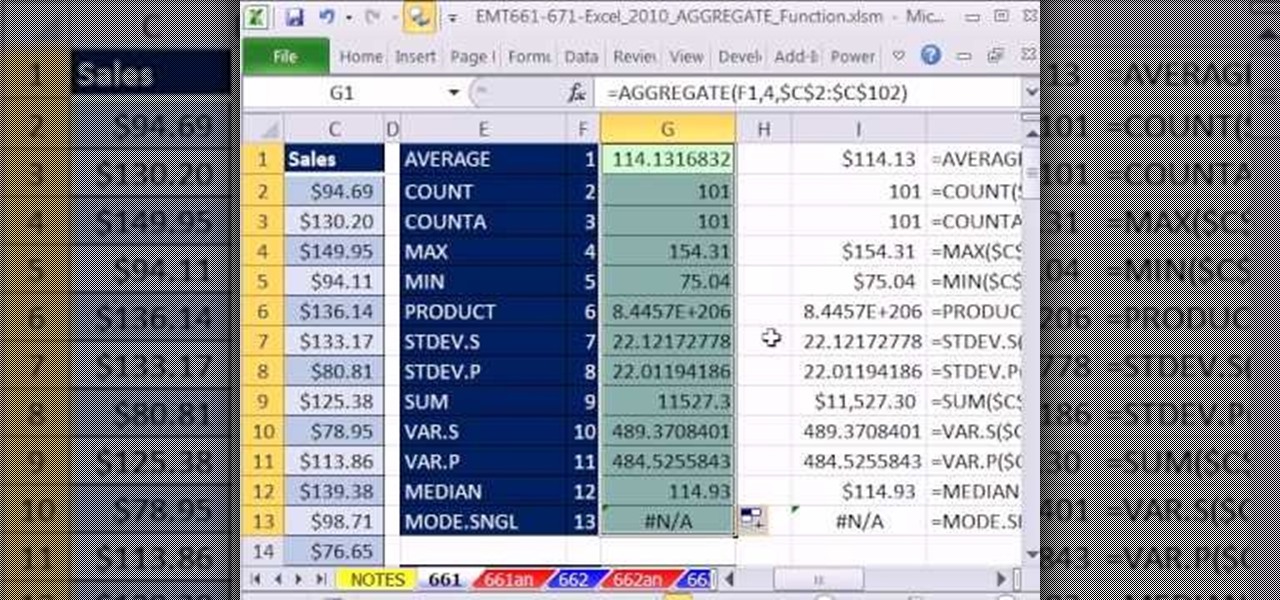
New to Microsoft Excel? Looking for a tip? How about a tip so mind-blowingly useful as to qualify as a magic trick? You're in luck. In this MS Excel tutorial from ExcelIsFun, the 664th installment in their series of digital spreadsheet magic tricks, you'll learn how about how the new Excel 2010 AGGREGATE function that can calculate these 19 different functions depending on what number you put into the 1st argument of the AGGREGATE function. This is an improvement over the SUBTOTAL function wh...
Learn how to solve statistics problems that require you to find the regression line. Whether you need help studying for that next big stats text or just a hand finishing your homework, you're sure to be well served by this four-part free video math lesson from Salman Khan.
Learn how to solve r-squared problems. Whether you need help studying for that next big stats text or just a hand finishing your homework, you're sure to be well served by this free video math lesson from Salman Khan, which presents a detailed overview of how to calculate r-squared in statistics.
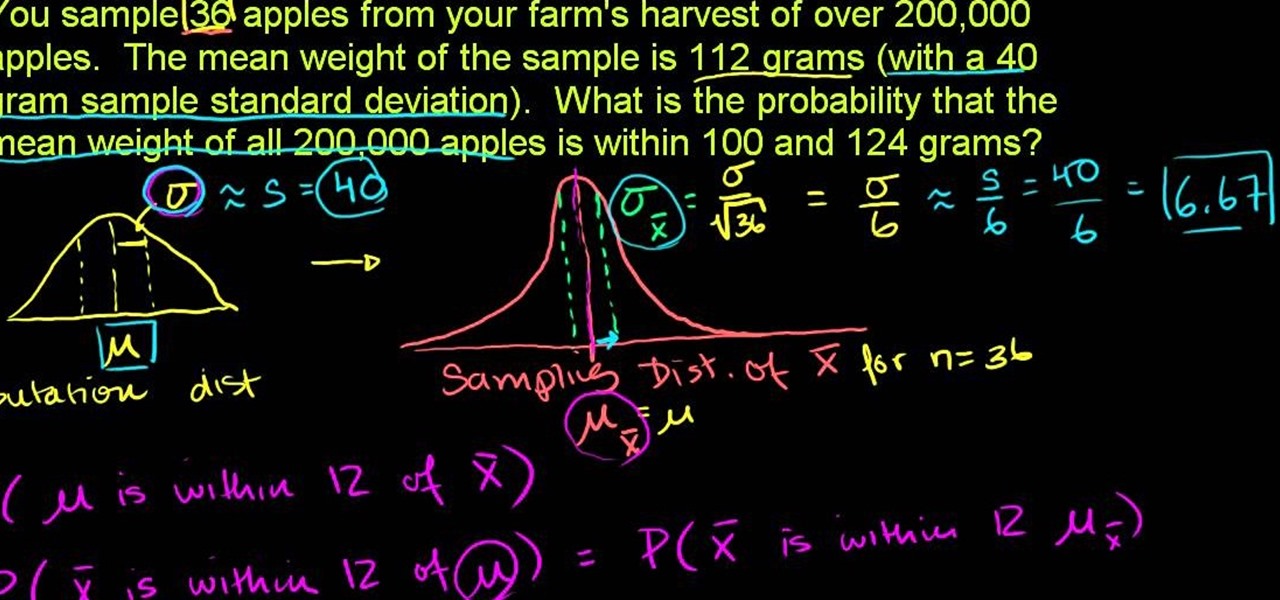
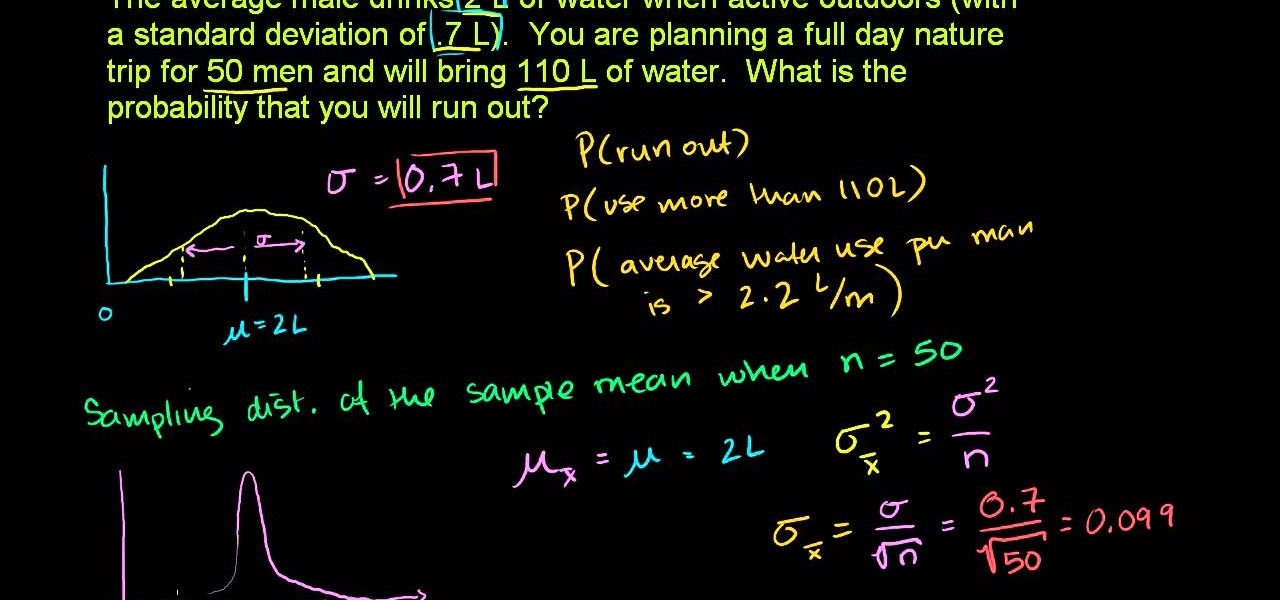
From Ramanujan to calculus co-creator Gottfried Leibniz, many of the world's best and brightest mathematical minds have belonged to autodidacts. And, thanks to the Internet, it's easier than ever to follow in their footsteps (or just study for that next big test). With this installment from Internet pedagogical superstar Salman Khan's series of free math tutorials, you'll learn how to calculate sample distribution in statistics.
If you use Microsoft Excel on a regular basis, odds are you work with numbers. Put those numbers to work. Statistical analysis allows you to find patterns, trends and probabilities within your data. In this MS Excel tutorial from everyone's favorite Excel guru, YouTube's ExcelsFun, the 43rd installment in his "Excel Statistics" series of free video lessons, you'll learn how to use the Excel Data Analysis add-in descriptive statistics tool.
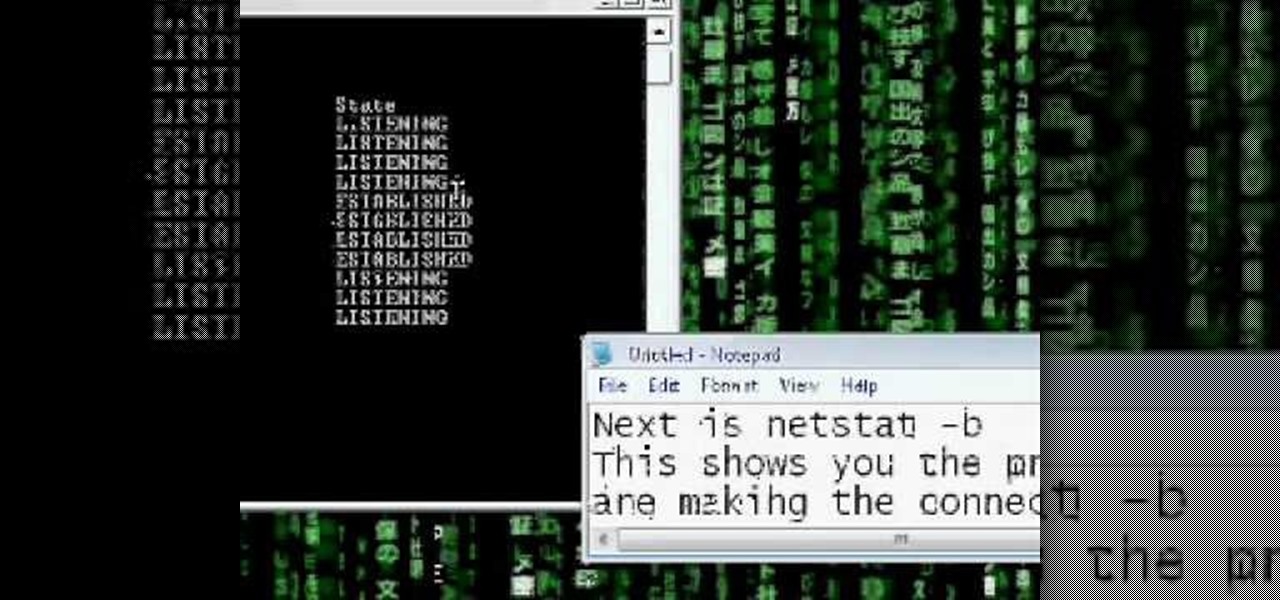
Netstat (network statistics) is a command-line tool that displays network connections (both incoming and outgoing), routing tables, and a number of network interface statistics. It is available on Unix, Unix-like, and Windows NT-based operating systems. This video tutorial presents a basic introduction to working with the netstat tool. Determine whether you've been hacked with this how-to.
In this video, we learn how to improve your resume with valid statistics. You need solid numbers to back up the information you are writing on your resume, not just words written on the paper. Most applicants look qualified on paper, but don't land interviews because they don't offer proof to validate their claims. When you provide proof of what you are stating, the person who is viewing your resume will be more likely to call you for an interview. Make sure to provide supporting documents an...
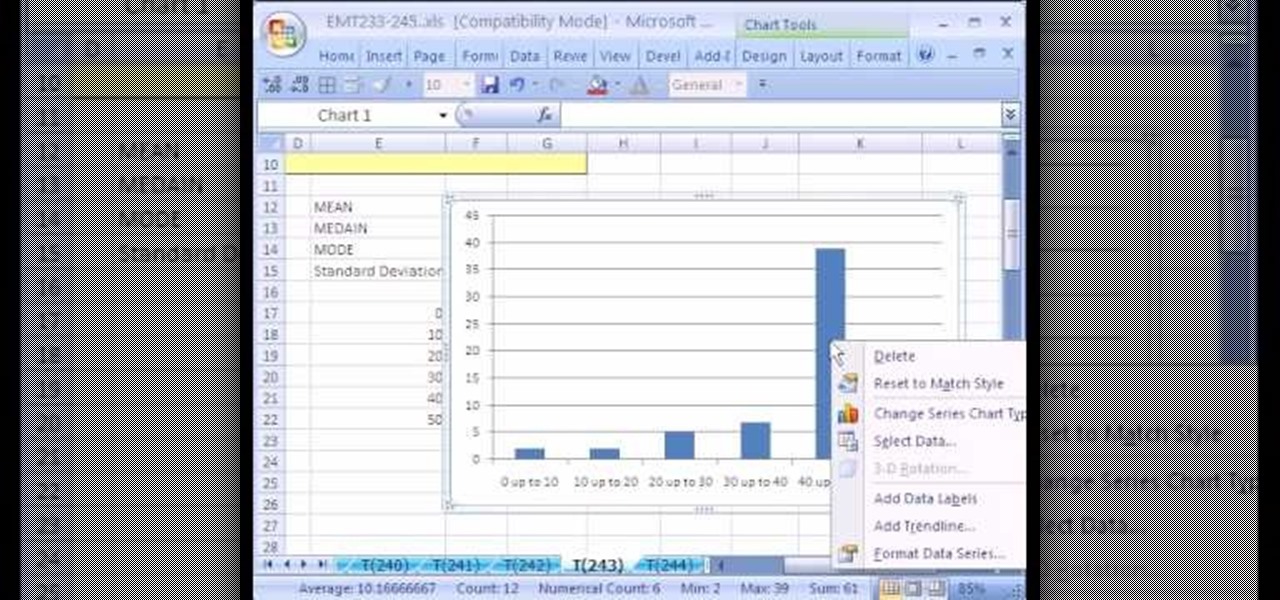
New to Excel? Looking for a tip? How about a tip so mind-blowingly advanced as to qualify as a magic trick? You're in luck. In this Excel tutorial from ExcelIsFun, the 243rd installment in their series of digital spreadsheet magic tricks, you'll learn how to find typical values, or averages – a single value that allows you to talk about all the data points in a given spreadsheet. Specifically, you'll learn how to find the mean, median, mode and standard deviation for a set of numbers.
Photoshopuniverse shows you how to simulate a watercolor painting on Photoshop. With this you can take any photo and make it look like it was a water color painting. Take any photo and then duplicate the layer 3 times including original. Focus on the first layer go to cut out. You want a high edge fidelity, and add the number of levels no more than 5. Add some simplicity and the change mode too luminosity. Go to the second copy layer do a dry brush increase size to maximum. add just a little ...
This video explains how we can have a smooth skin in the pictures using Photoshop tools. The healing brush tool is used to delete all blemishes, red spots or black marks from the skin in the photo. While doing this it is important to select smaller portions and then go ahead instead of selecting bigger portions of the skin. Later the median filter is used so that the smoothing is just optimum. This actually helps in getting the right image specially for close up photos.
Want to see whether your PC is being accessed by hackers? Netstat (network statistics) is a command-line tool that displays network connections (both incoming and outgoing), routing tables, and a number of network interface statistics. It is available on Unix, Unix-like, and Windows NT-based operating systems. This video tutorial presents a basic introduction to working with the netstat tool. Determine whether you've been hacked with this how-to.
In this tutorial, we learn how to use the Quintile Formula in Statistics. To find the quintile rank of a formula that is in a certain set, you will first need to count the number you are given. Then, read the equation so you understand what the R, N, equal side, and other numbers mean. Once you understand what all of these mean, fill in the formula with the correct information. Use the information you are given in the question to fill it into the equation. When finished, you will apply the ru...
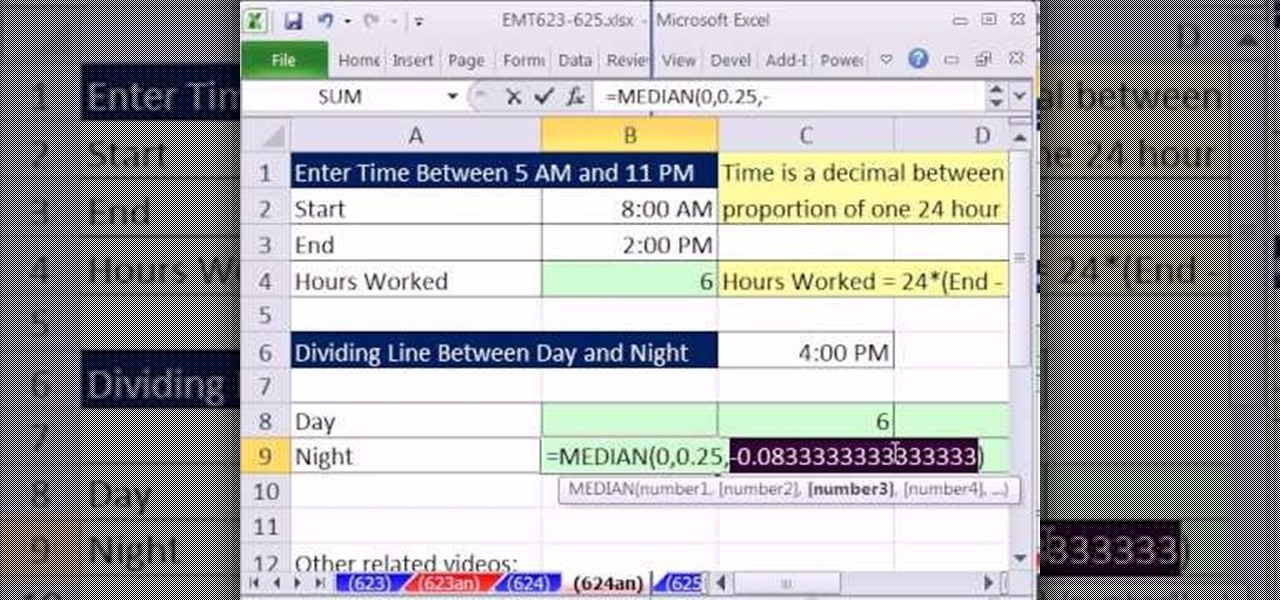
New to Microsoft Excel? Looking for a tip? How about a tip so mind-blowingly useful as to qualify as a magic trick? You're in luck. In this MS Excel tutorial from ExcelIsFun, the 624th installment in their series of digital spreadsheet magic tricks, you'll learn how to break apart the hours worked in a given day into one part for the day shift and a second part for the night shift using the MEDIAN function instead of the IF function. The MEDAIN function can be used when there are different ca...
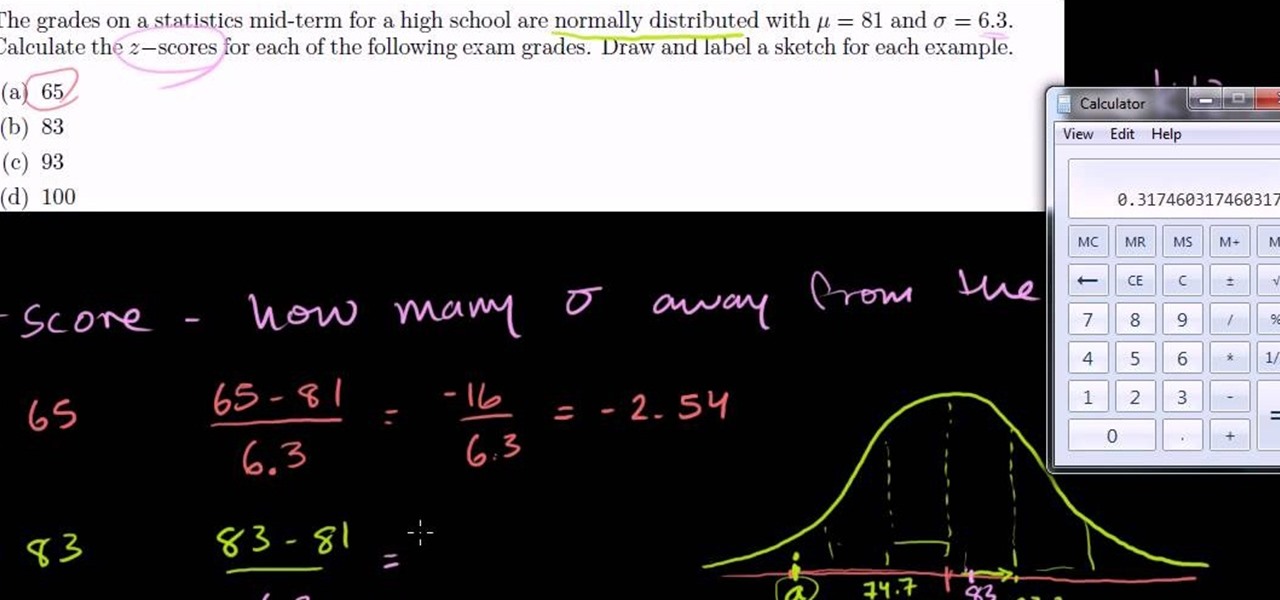
Need help figuring out how to determine a z-score for a normal distribution (or bell curve) in statistics? From Ramanujan to calculus co-creator Gottfried Leibniz, many of the world's best and brightest mathematical minds have belonged to autodidacts. And, thanks to the Internet, it's easier than ever to follow in their footsteps (or just finish your homework or study for that next big test). With this installment from Internet pedagogical superstar Salman Khan's series of free math tutorials...
If you use Microsoft Excel on a regular basis, odds are you work with numbers. Put those numbers to work. Statistical analysis allows you to find patterns, trends and probabilities within your data. In this MS Excel tutorial from everyone's favorite Excel guru, YouTube's ExcelsFun, the very first installment in his "Excel Statistics" series of free video lessons, you'll learn how to get started doing statistical analysis in Microsoft Excel 2007.
Want to find the value of a t-statistic confidence interval for a small sample? This clip's your ticket. From Ramanujan to calculus co-creator Gottfried Leibniz, many of the world's best and brightest mathematical minds have belonged to autodidacts. And, thanks to the Internet, it's easier than ever to follow in their footsteps. For all of the details, watch this installment from Internet pedagogical superstar Salman Khan's series of free math tutorials.
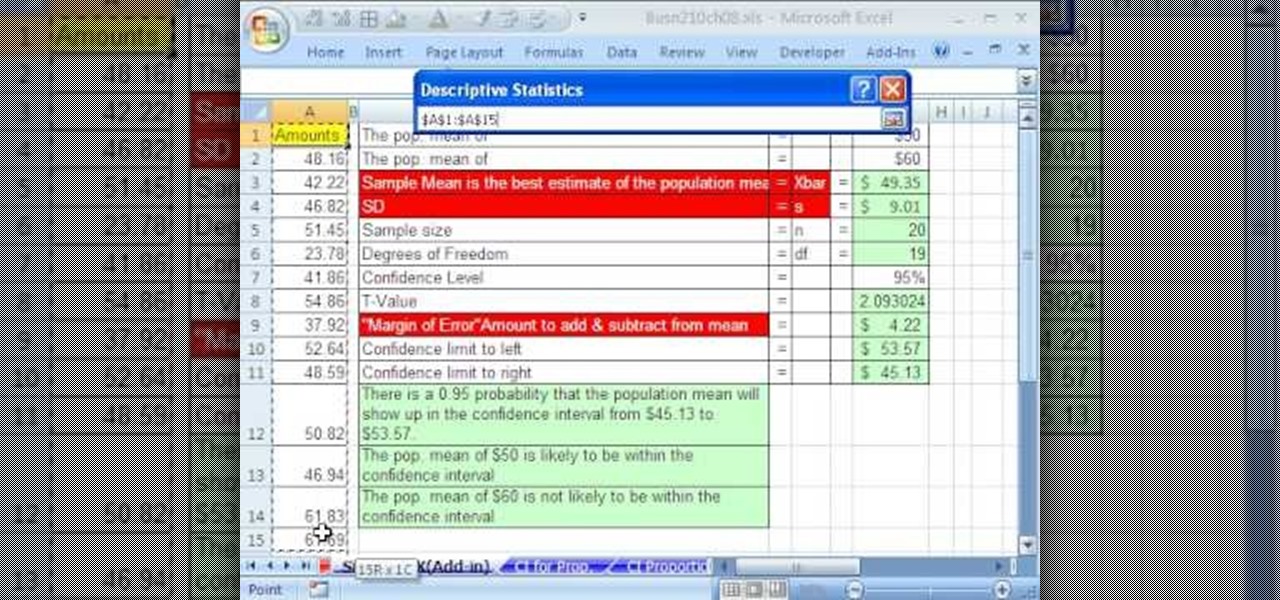
If you use Microsoft Excel on a regular basis, odds are you work with numbers. Put those numbers to work. Statistical analysis allows you to find patterns, trends and probabilities within your data. In this MS Excel tutorial from everyone's favorite Excel guru, YouTube's ExcelsFun, the 84th installment in his "Excel Statistics" series of free video lessons, you'll learn how to construct confidence intervals when the sigma is NOT known using the Descriptive Statistics data analysis add-in.
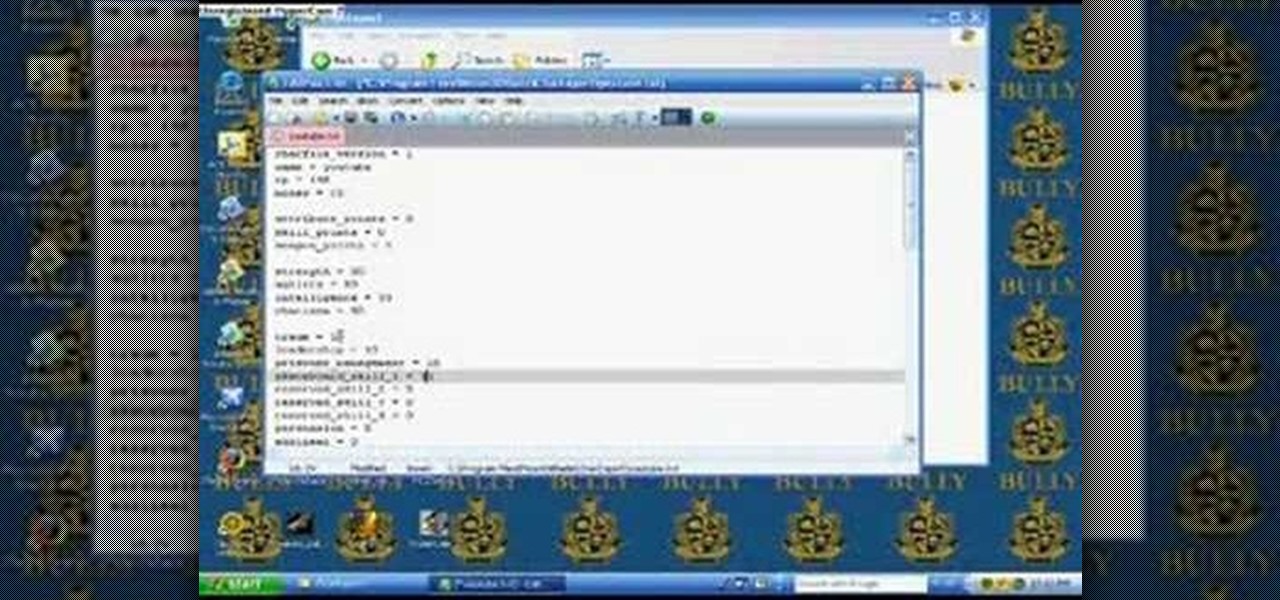
This video shows you how to change your skill levels in mount and blade. Go to the character menu and click on the statistics button, then click the export button. Exit Mount and Blade. Go to My computer, your local disk drive (usually C), program files, mount & blade, CharExport. In CharExport you should see a file with your character's name, open the file and you will see every stat that your character has. Change them however you want, save the file and close it. Restart Mount and Blade, l...
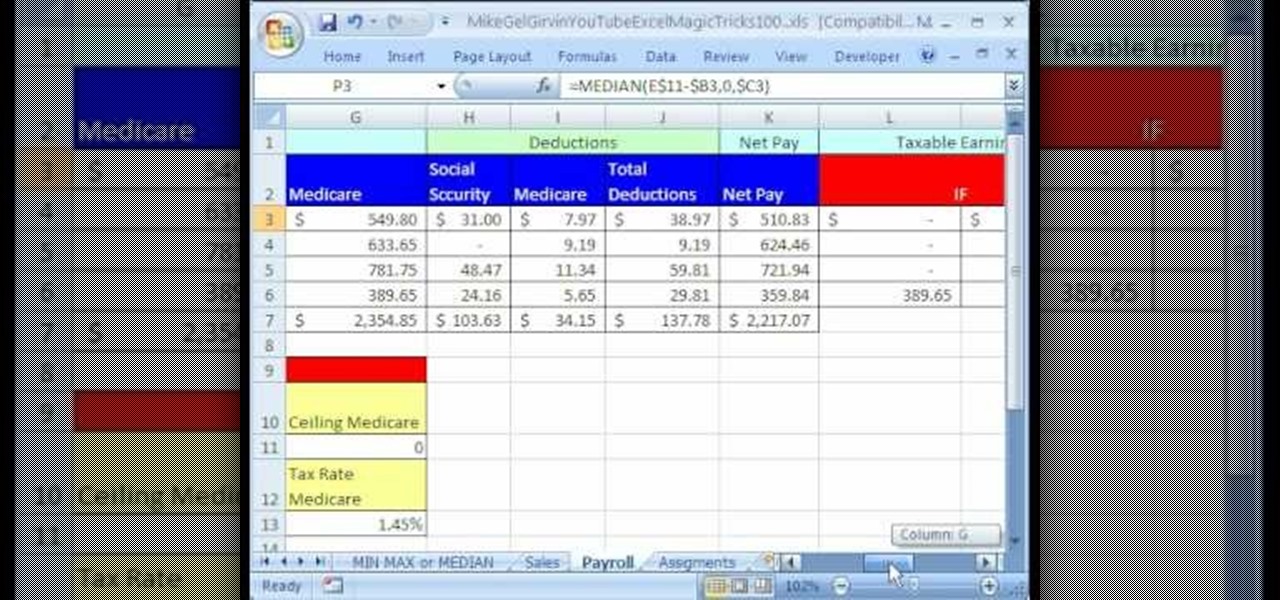
New to Excel? Looking for a tip? How about a tip so mind-blowingly advanced as to qualify as a magic trick? You're in luck. In this Excel tutorial from ExcelIsFun, the 100th installment in their series of digital spreadsheet magic tricks, you'll learn how to replace a long IF formula with a simple MIN/MAX formula (or an even simpler MEDIAN function). See 3 amazing examples. When you have a hurdle such a Commission Hurdle or a Payroll Taxable Earning Hurdle, and you are using an IF function fo...