There are songs that we love, songs that make us sad, and songs that change the way we view the world—and that's something that Steve Jobs knew all too well.

The majority of Android devices have built-in sensors underneath the hood that measure motion, position, and several environmental parameters that provide data needed to monitor your movements and adjust accordingly.
As the protectors of all things good, the Federal Communications Commission is usually busy behind the scenes pissing off Slim Shady, giving out fines for indecent nipple exposure at certain halftime events, and warning the NSA about losing any "confidential" phone information they steal from us.

There is a substantial number of helpful tools at your disposal in Microsoft Word when it comes to writing; grammar check, word count, dictionary, thesaurus, and tons more. One tool that doesn't necessarily make itself obvious is testing your document's readability. With this built-in tool, you can not only check your spelling and grammar, but also the reading level of your document.

A good baseball team can't be good unless all of its players are good. And while every player is important to the team's overall success, the batter is usually the one most closely watched and analyzed.

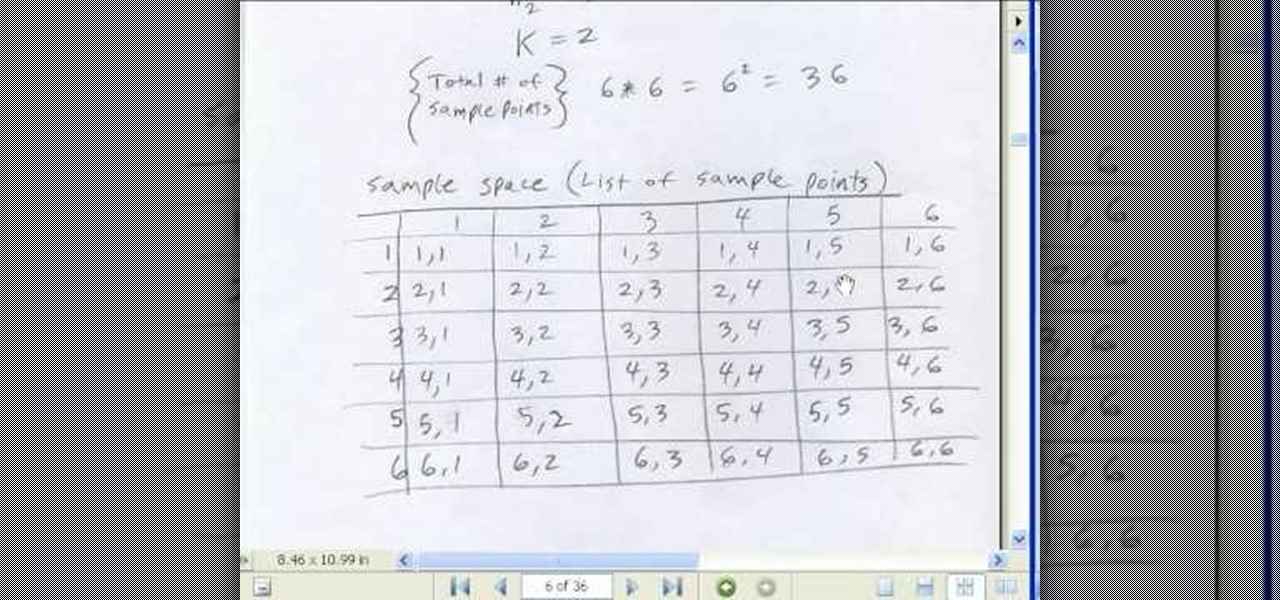
From Ramanujan to calculus co-creator Gottfried Leibniz, many of the world's best and brightest mathematical minds have belonged to autodidacts. And, thanks to the Internet, it's easier than ever to follow in their footsteps (or just finish your homework or study for that next big test). With this installment from Internet pedagogical superstar Salman Khan's series of free math tutorials, you'll learn how to calculate the probability of two dependent events in statistics.

If you use Microsoft Excel on a regular basis, odds are you work with numbers. Put those numbers to work. Statistical analysis allows you to find patterns, trends and probabilities within your data. In this MS Excel tutorial from everyone's favorite Excel guru, YouTube's ExcelsFun, the 47th installment in his "Excel Statistics" series of free video lessons, you'll learn how to use the NORMSINV function for critical values and the NORSDIST function for p-values. Compare building confidence int...
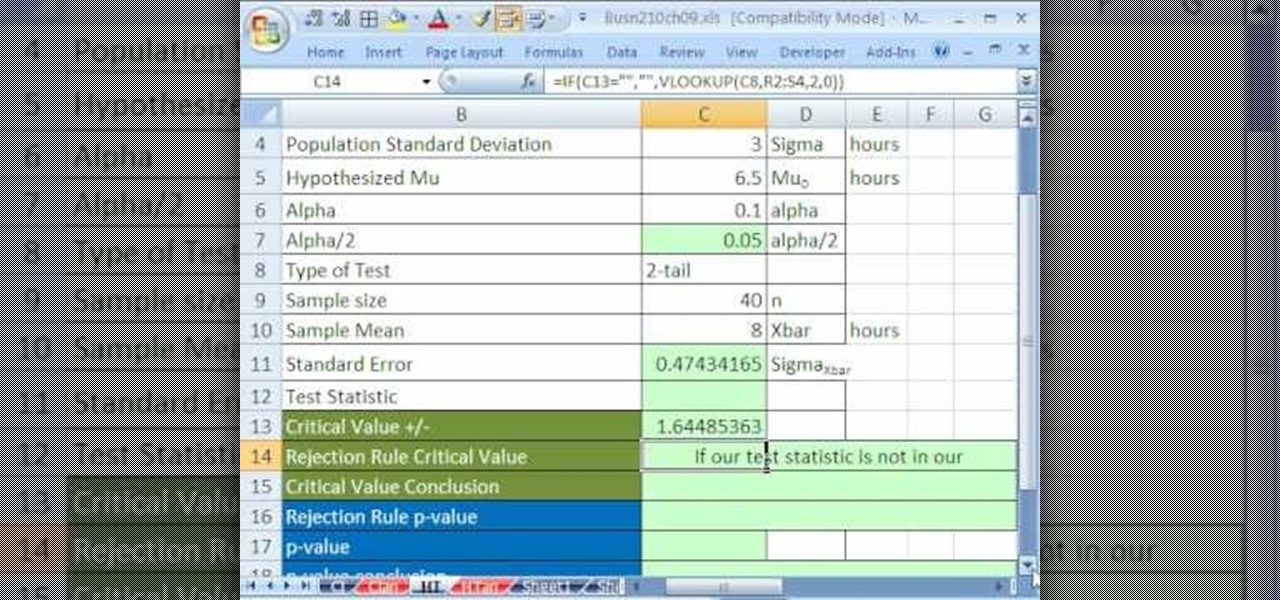
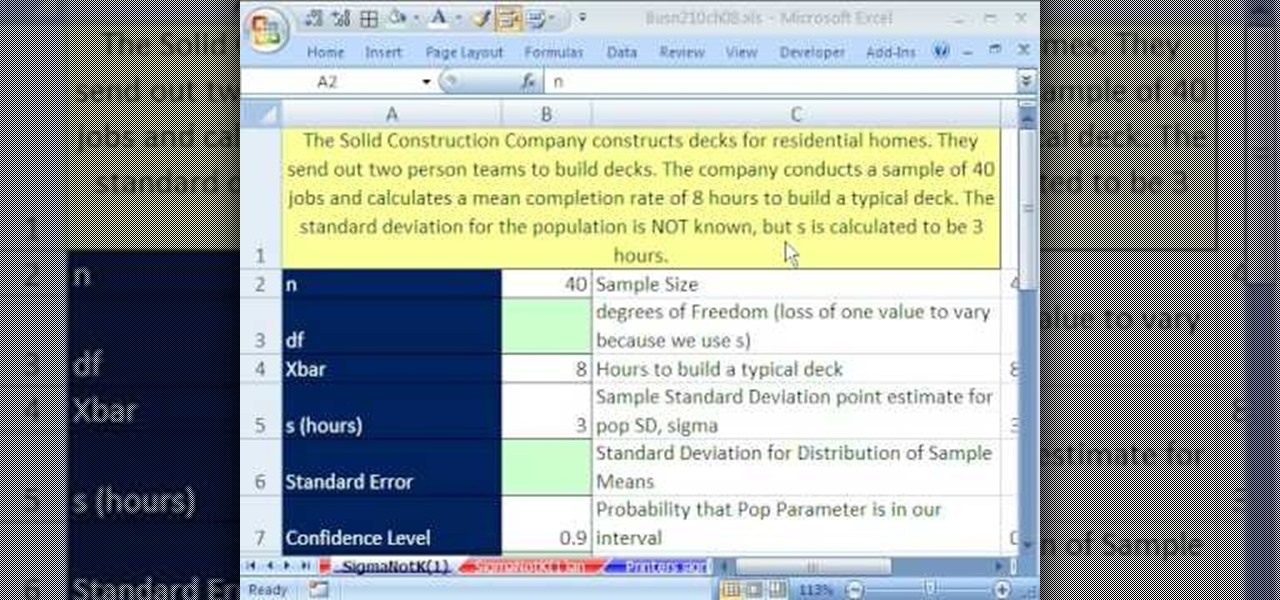
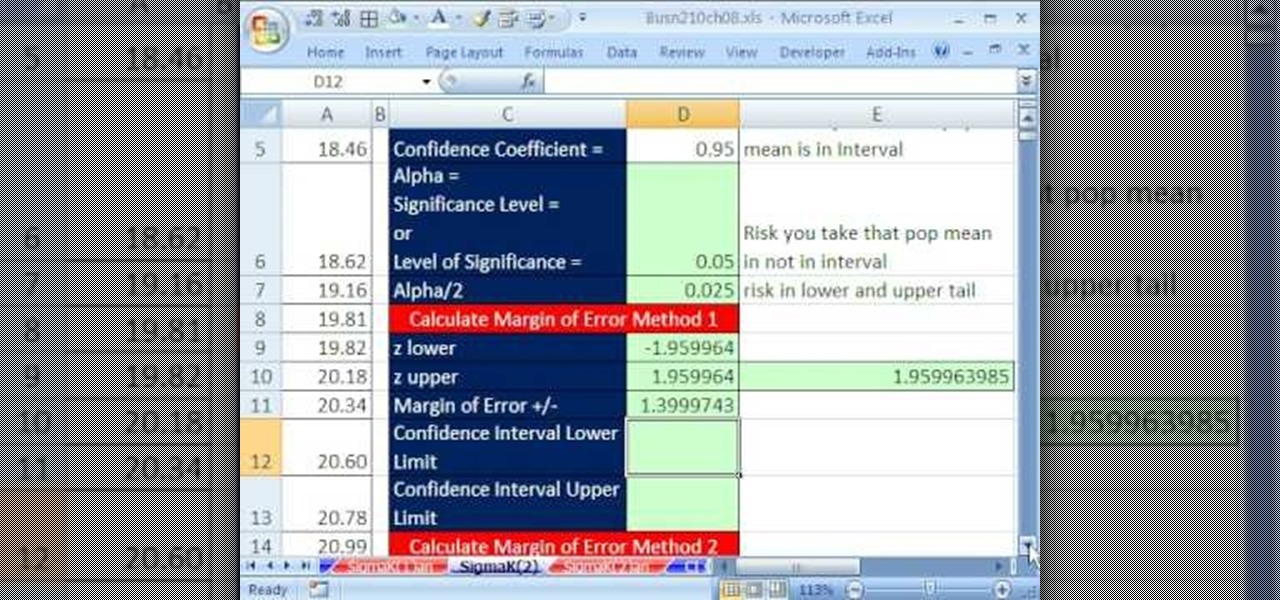
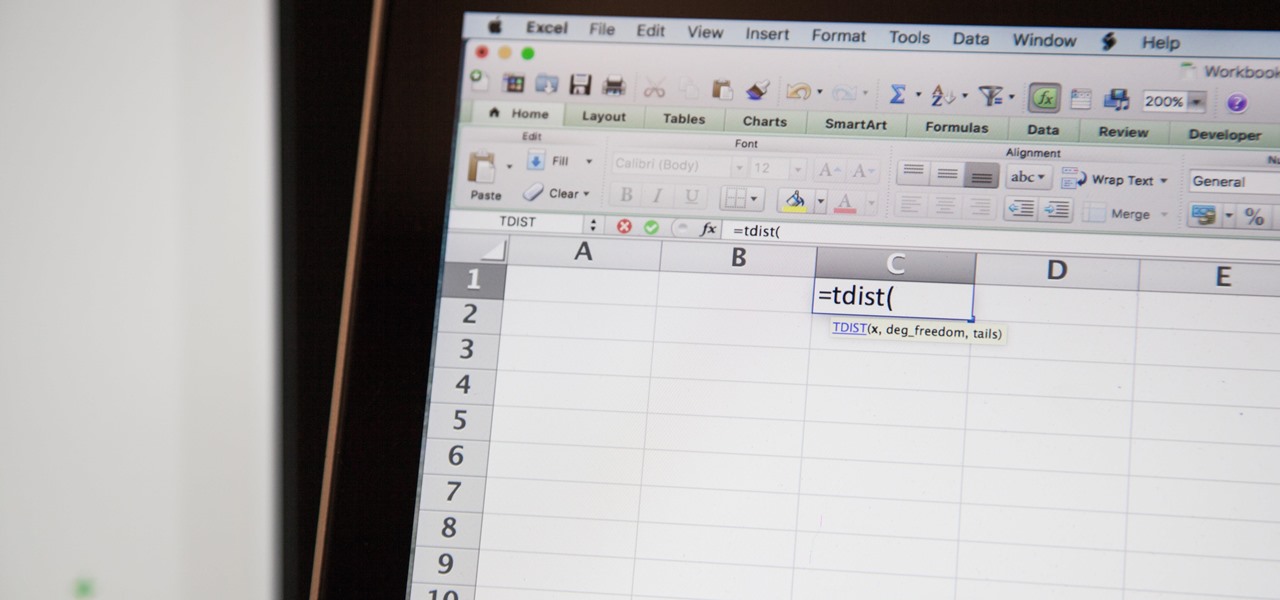
If you use Microsoft Excel on a regular basis, odds are you work with numbers. Put those numbers to work. Statistical analysis allows you to find patterns, trends and probabilities within your data. In this MS Excel tutorial from everyone's favorite Excel guru, YouTube's ExcelsFun, the 82nd installment in his "Excel Statistics" series of free video lessons, you'll learn how to construct confidence intervals when the sigma value (the population's standard deviation) in NOT Known using the TINV...
Most women wear the wrong bra size. It's not that we don't care for finding the right one, but rather that all retailers make their bras just a little bit different, and the number + cup size system is more mystifying than helpful.
Need a quick primer on how to solve type-1 error problem in stats? Let this video be your guide. From Ramanujan to calculus co-creator Gottfried Leibniz, many of the world's best and brightest mathematical minds have belonged to autodidacts. And, thanks to the Internet, it's easier than ever to follow in their footsteps. For all of the details, watch this installment from Internet pedagogical superstar Salman Khan's series of free math tutorials.
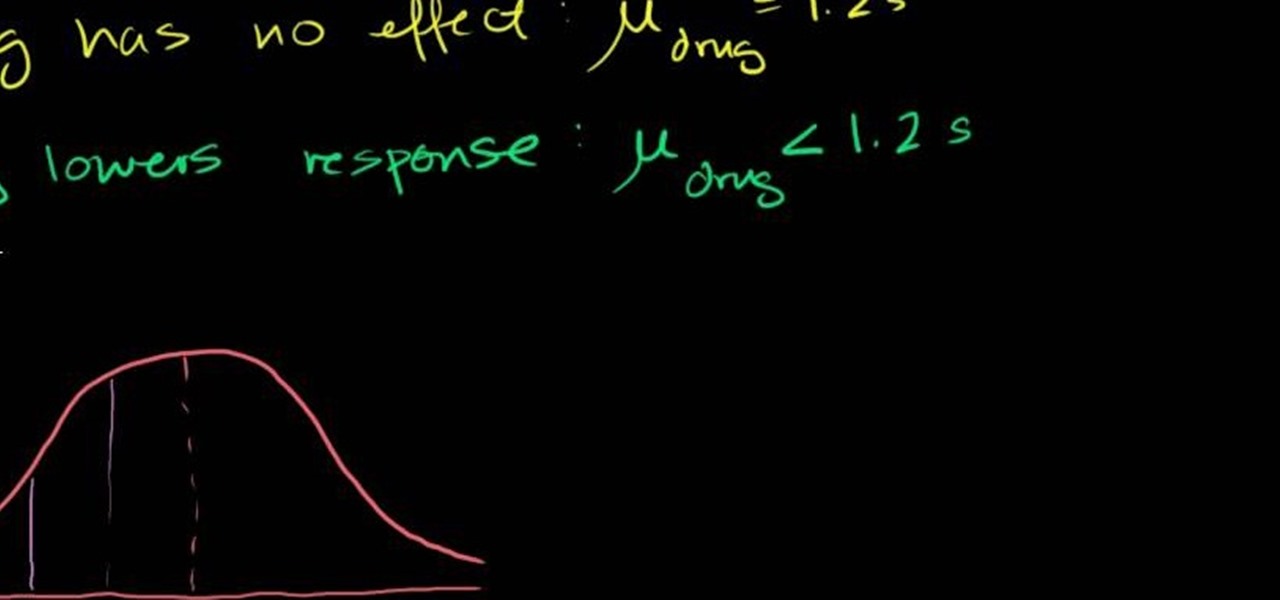
Can't make heads or tails of one- and two-tailed tests? Never fear. This stats lesson will teach you everything you'll need to know. From Ramanujan to calculus co-creator Gottfried Leibniz, many of the world's best and brightest mathematical minds have belonged to autodidacts. And, thanks to the Internet, it's easier than ever to follow in their footsteps. For all of the details, watch this installment from Internet pedagogical superstar Salman Khan's series of free math tutorials.
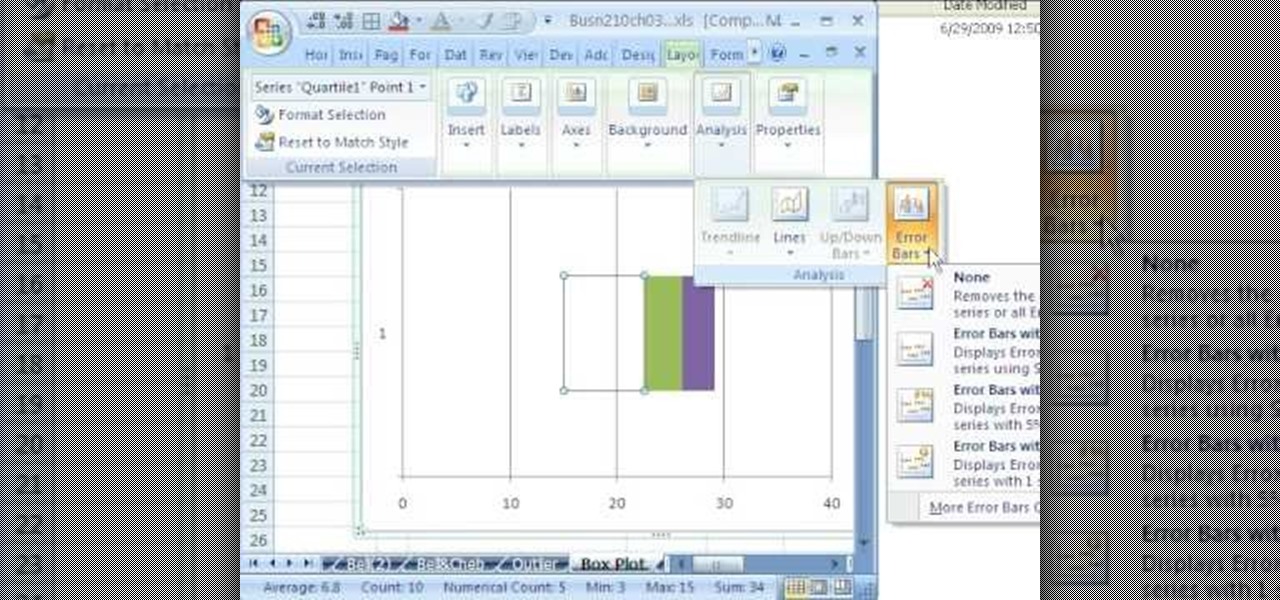
If you use Microsoft Excel on a regular basis, odds are you work with numbers. Put those numbers to work. Statistical analysis allows you to find patterns, trends and probabilities within your data. In this MS Excel tutorial from everyone's favorite Excel guru, YouTube's ExcelsFun, the 49th installment in his "Excel Statistics" series of free video lessons, you'll learn how to find outliers with the +/- 3 Z-score rule and the ABS function. See how to do a box plot by hand and in Excel. For th...
If you use Microsoft Excel on a regular basis, odds are you work with numbers. Put those numbers to work. Statistical analysis allows you to find patterns, trends and probabilities within your data. In this MS Excel tutorial from everyone's favorite Excel guru, YouTube's ExcelsFun, the 38th installment in his "Excel Statistics" series of free video lessons, you'll learn how to use the RANK and PERCENTRANK functions as well as the Data Analysis add-in's Rank & Percentile tools.
If you use Microsoft Excel on a regular basis, odds are you work with numbers. Put those numbers to work. Statistical analysis allows you to find patterns, trends and probabilities within your data. In this MS Excel tutorial from everyone's favorite Excel guru, YouTube's ExcelsFun, the 20th installment in his "Excel Statistics" series of free video lessons, you'll learn how to take raw quantitative (numerical) data and figure out how to group it into classes so that you can have categories an...
If you use Microsoft Excel on a regular basis, odds are you work with numbers. Put those numbers to work. Statistical analysis allows you to find patterns, trends and probabilities within your data. In this MS Excel tutorial from everyone's favorite Excel guru, YouTube's ExcelsFun, the 81st installment in his "Excel Statistics" series of free video lessons, you'll learn how to construct confidence intervals when the sigma (population standard deviation) is known. See how the CONFIDENCE and NO...
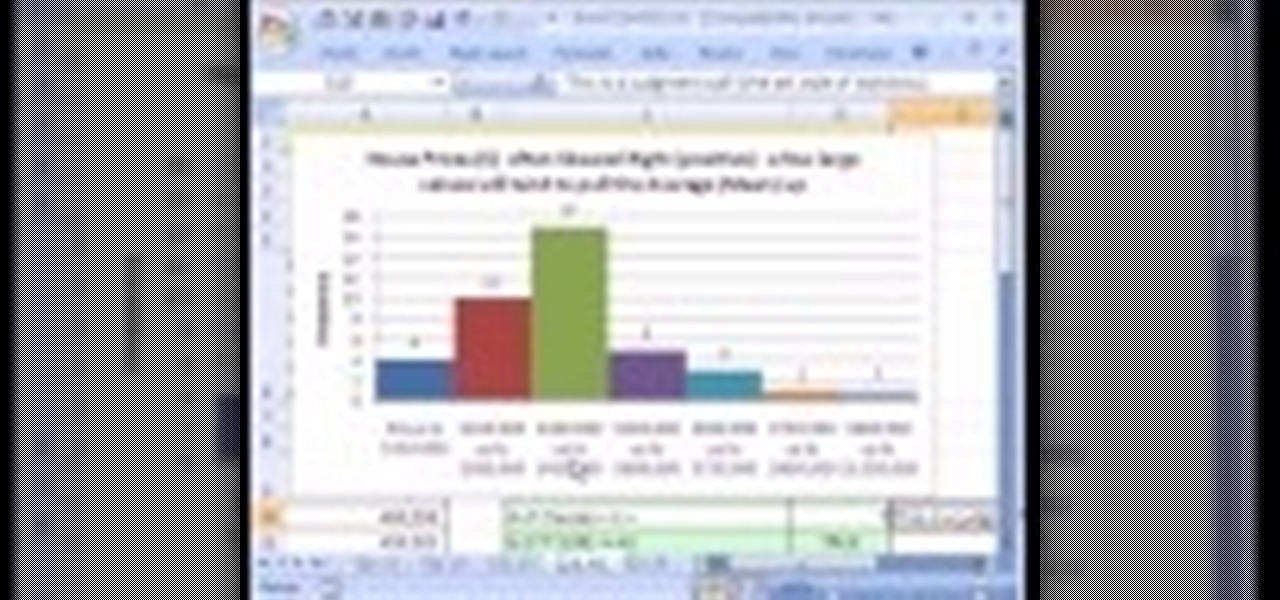
If you use Microsoft Excel on a regular basis, odds are you work with numbers. Put those numbers to work. Statistical analysis allows you to find patterns, trends and probabilities within your data. In this MS Excel tutorial from everyone's favorite Excel guru, YouTube's ExcelsFun, the 23rd installment in his "Excel Statistics" series of free video lessons, you'll learn how to work with skew in histograms for quantitative Data. Learn how to skew left (negative) and skew right (positive) with ...
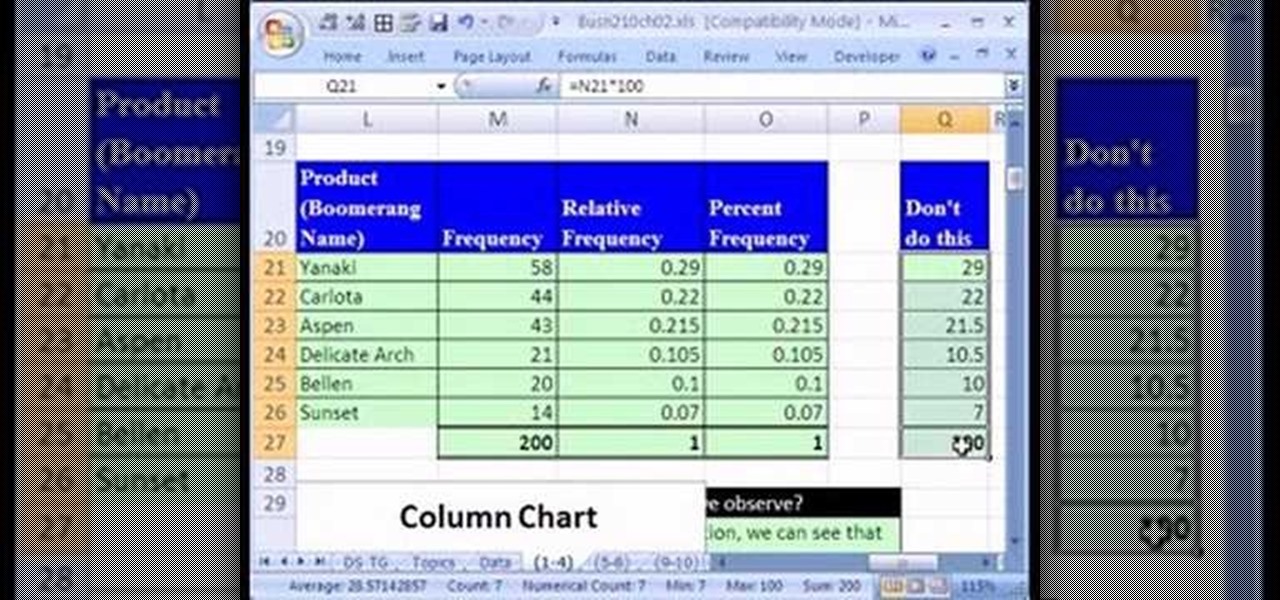
If you use Microsoft Excel on a regular basis, odds are you work with numbers. Put those numbers to work. Statistical analysis allows you to find patterns, trends and probabilities within your data. In this MS Excel tutorial from everyone's favorite Excel guru, YouTube's ExcelsFun, the 14th installment in his "Excel Statistics" series of free video lessons, you'll learn how to create relative & percent & frequency distributions with formulas for categorical data. See, too, how to create a per...
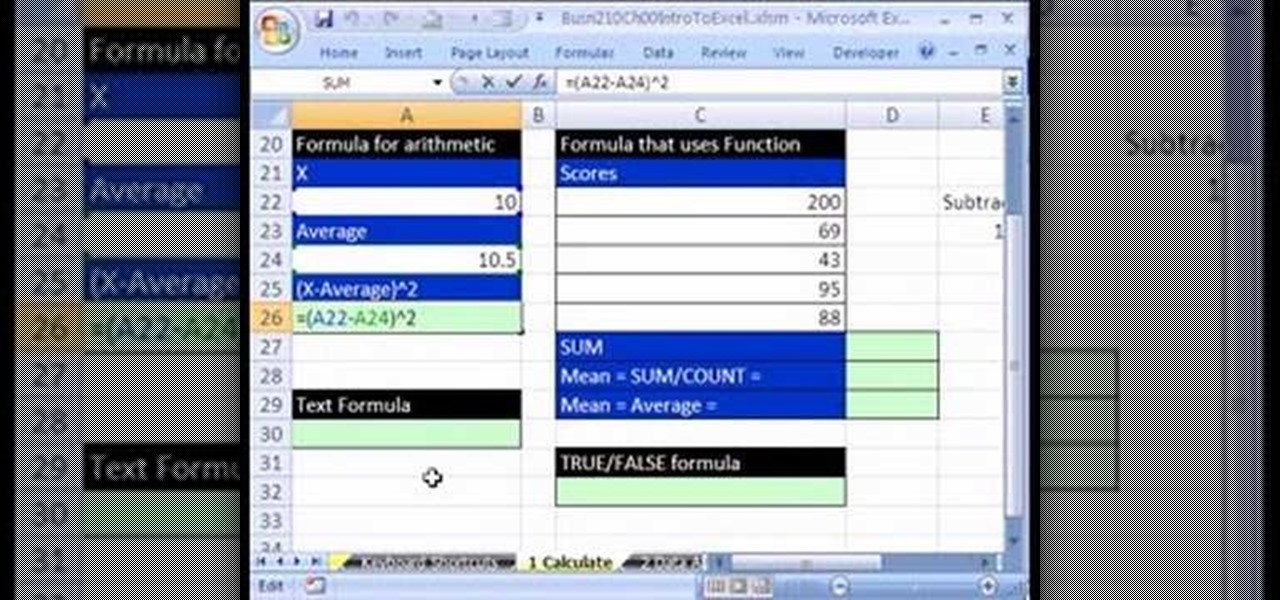
If you use Microsoft Excel on a regular basis, odds are you work with numbers. Put those numbers to work. Statistical analysis allows you to find patterns, trends and probabilities within your data. In this MS Excel tutorial from everyone's favorite Excel guru, YouTube's ExcelsFun, the 2nd installment in his "Excel Statistics" series of free video lessons, you'll learn how to make calculations in Excel using formulas and cell references. Learn about the different Excel Math operators and func...
This video shows how to clean a Tippmann 98 Custom paintball gun. Materials needed are Pliers, gun lubricant, paper towels, Tippmann 98 Custom and Appropriate sized Allen Wrenches.Step 1. Unscrew barrel, take off hopper connector and tae off bolt cap.Step 2. Next use the Allen wrench to take off Co2 connector and handle grip.Step 3. Then take out the 6 screws that hold the 2 sides of the gun together.Step 4. Take out the front and back bolt.Step 5. Spray lubricant on the places and on both O-...
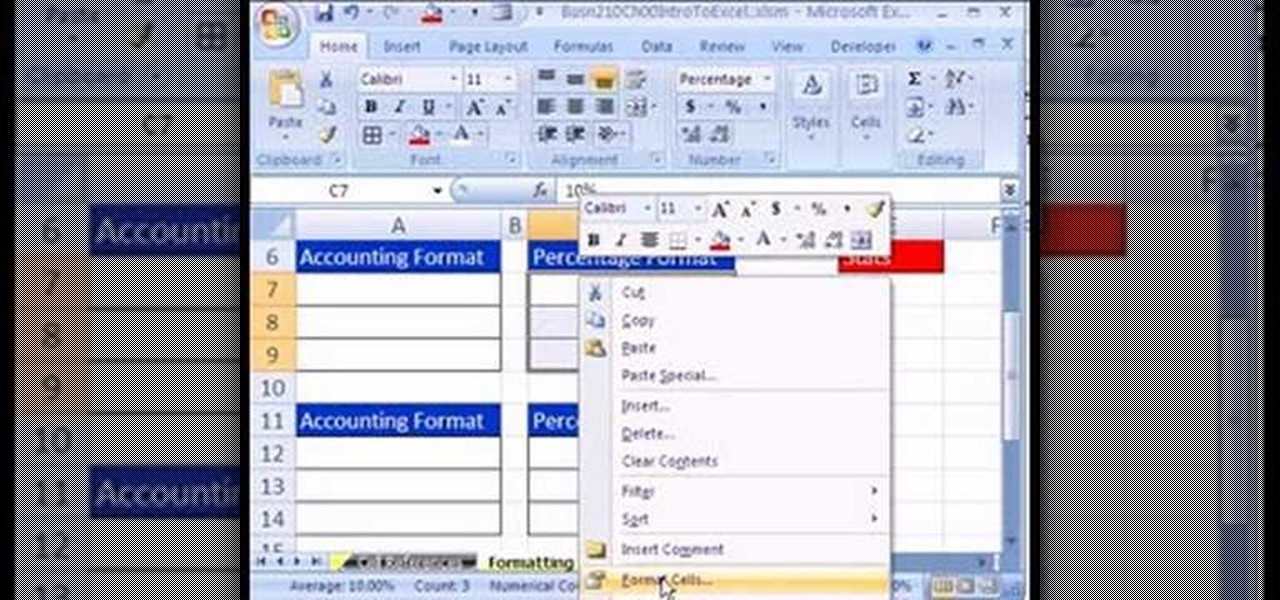
This is the fifth video in the Statistics in Excel. He gives the website address where content can be downloaded. He speaks about the different types of formatting like stylistic and number formatting. He talks about the different formats like accounting and percentage, and how to use both of them. Accounting format is nice because it lines up the decimals nicely. He shows how to apply the accounting format. The percentage format displays the value in as a percentage. He shows you how to appl...
Veronica from Tekzilla teaches you how to monitor network activity on Windows 7. Go to ITSamples and download the Network Activity Indicator program. Install it and run it. This will add a new icon on your system tray. It blinks to reflect incoming and outgoing packets. You can right click to see a more detailed report. You also get statistics and a menu for your network and firewall settings. So to get the popular windows XP type network indicator icon all you need to do is follow the steps ...
In this tutorial the instructor explains the percentile formula. He says that the percentile formula is used to find the percentile rank of a data point in a group of data. He takes an example that consists of the lengths of puppies. Now he intends to find out the percentile rank of any puppy in the group. He shows that the formulate to compute a percentile rank of a particular puppy is rank R = 100 * (N< + (1/2)N= )/ Nt, where N< is the number of puppies whose length is less that the length ...
Central limit theorum is easily one of the most fundamental and profound concepts in statistics and perhaps in mathematics as a whole. In probability theory, the central limit theorum (CLT) states conditions under which the mean of a suffiently large number of independent random large variables (each with finite means and variance) will be normally distributed, approximately. Huh? If you are having trouble understanding central limit theorum and need help trying to solve it, check out this tu...
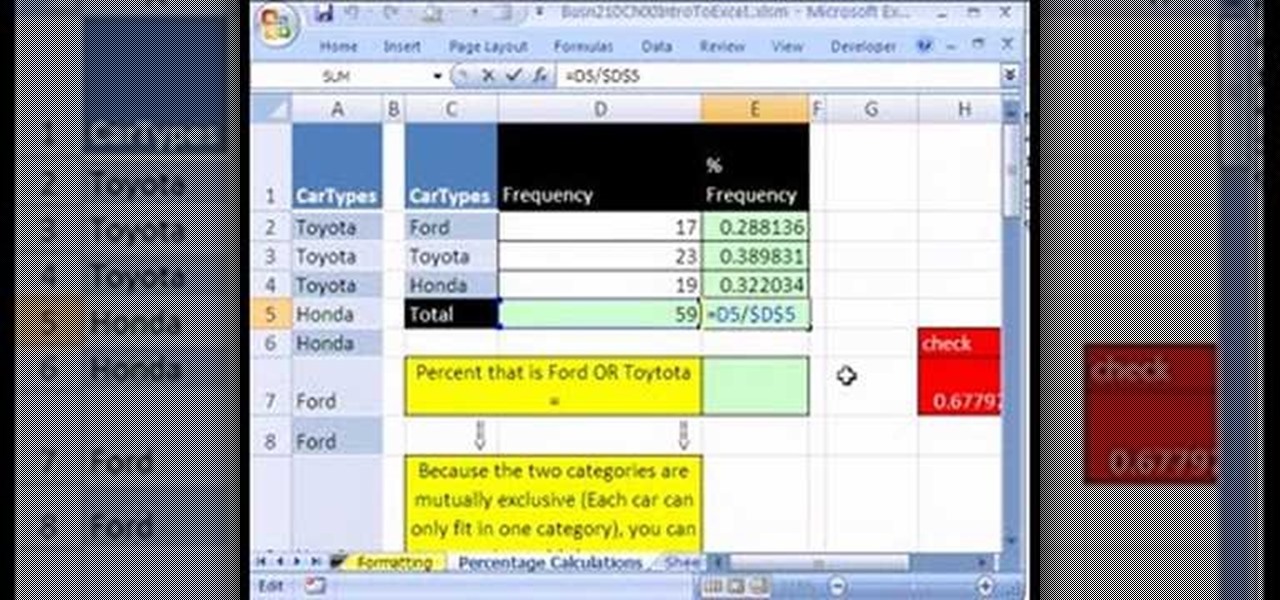
This Excel Statistics series of video shows how to calculate proportions and percentages in Microsoft Excel. This video shows how to do percentage calculations using formulas in Microsoft Excel. To make a formula for a percentage, you need to first make a formula to calculate the total sum of objects you are going to use. To do that, use the sum formula. Now, divide the current object's value with the previously generated sum formula, which gives you the frequency. When you multiply this by 1...
According to a U.S. survey, the crud in our garages is taking up most available floor space. Hence the average North American chucks up to $6500 worth of mostly useless stuff on the floor of the garage, while the $20,000 vehicle sits outside in the cold, rusting. It's time to get our cars back into garages. We spent more than $688 million dollars last year on garage organization and it barely made a dent. If you don't believe me, walk down your street and count the number of houses with cars ...
Companies are already clamoring to figure out strategies for integrating augmented reality into their advertising platforms. AR is going to become a huge asset to marketers, and Apple's ARKit is only going to help that along. Mixed reality producer Bilawal Singh Sidhu has given us a sneak peek of what the world of advertising could be with the ARKit.
You would think most people would agree that you shouldn't use your smartphone while driving. Apparently, most people would be liars, according to recent data from the National Safety Council (NSC) and Zendrive.
One of my favorite new additions to iOS is the ability to view battery usage stats on a per-app basis, which is helpful in knowing exactly which apps are taking up all of my iPhone's battery life. If you jailbreak iOS 8 on your device, you can take Apple's stock battery stats feature even further to give you details on how those apps are actually using the battery.
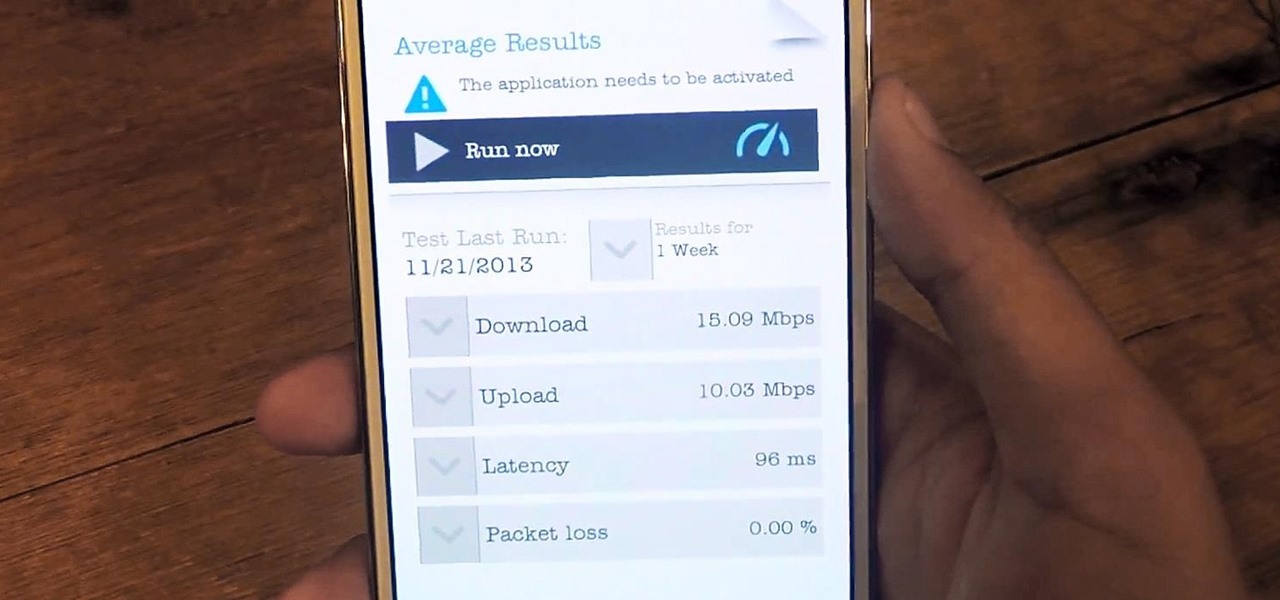
With the majority of smartphone carriers no longer offering unlimited data plans for the iPhone, monitoring how much mobile data you use is a key element to saving money on your phone bill.
So you need to find the p-value for your hypothesis test. To do so, employ the spreadsheet program Microsoft Excel. Using a simple formula, you can easily determine the p-value for your tests and thereby conclude strong or weak support of the null hypothesis.
Percents are handy for displaying statistics or labeling objects such as sale items in a store, or ingredient labels. However, in a math equation, a percent is a bit difficult to use. Therefore, you will need to convert your percents into an easier type of number form.
Most people keep their ungodly sexual desires deep inside, only to be indulged in private on their computers. It makes you wonder... what secrets do your neighbors have? What kind of porn are they watching? And how much and for how long? Thanks to some public (and anonymous) data, you can now find out.
Excerpts from a presentation by Dr. Simeon Hein at the International UFO Congress, 2005. Dr. Hein is the director of the Institute for Resonance in Boulder, Colorado. The Institute is devoted to the study of subtle-energy sciences including remote viewing, crop circles and related subjects. Dr. Hein has a Ph.D. in sociology and has previously taught research methodology and statistic courses. Dr. Hein first learned remote viewing in 1996 and subsequently became involved in crop circle researc...
If you use Microsoft Excel on a regular basis, odds are you work with numbers. Put those numbers to work. Statistical analysis allows you to find patterns, trends and probabilities within your data. In this MS Excel tutorial from everyone's favorite Excel guru, YouTube's ExcelsFun, the 50th installment in his "Excel Statistics" series of free video lessons, you'll learn the basics of probability:
Not exactly sure how to get a hold of a death certificate? Whether you need a death certificate to trace your family history or to make a legal claim, follow these steps to get the record you need.
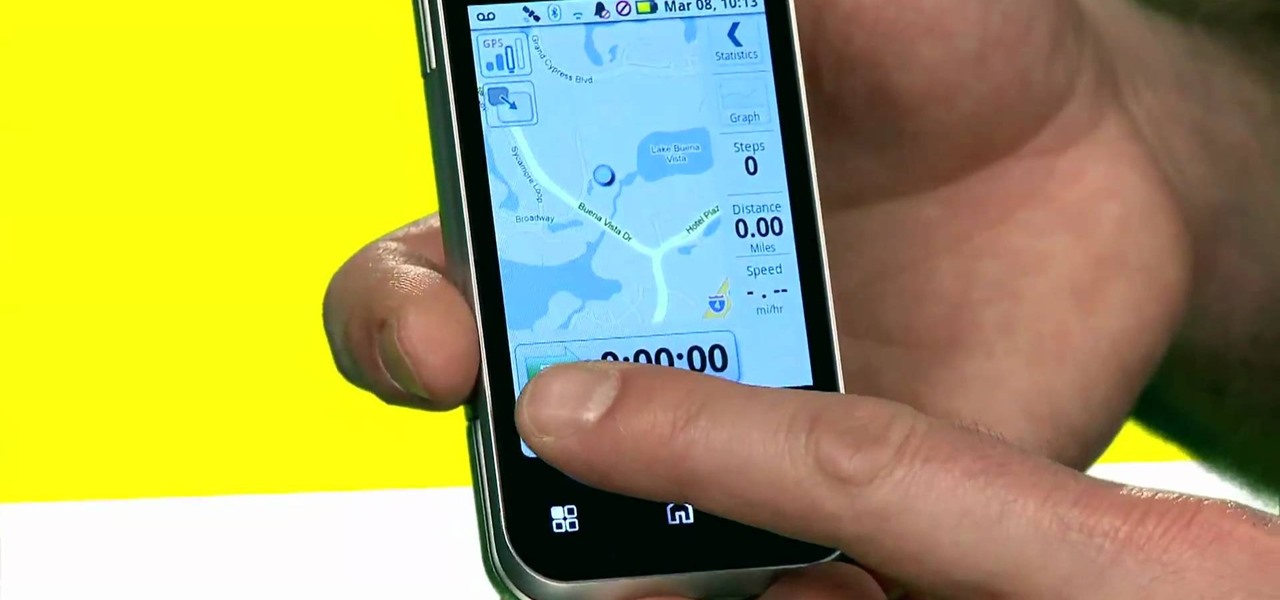
Staying in tune with the digital age doesn't mean you have to sacrifice personal health. In fact, new technology only makes it easier to workout and keep track of your progress. On any Android mobile phone, there's an application called Cardio Trainer that could help you out significantly. But how? Best Buy has answers. The Best Buy Mobile team explains how simple it is to use the Cardio Trainer app your Android enabled cell phone.
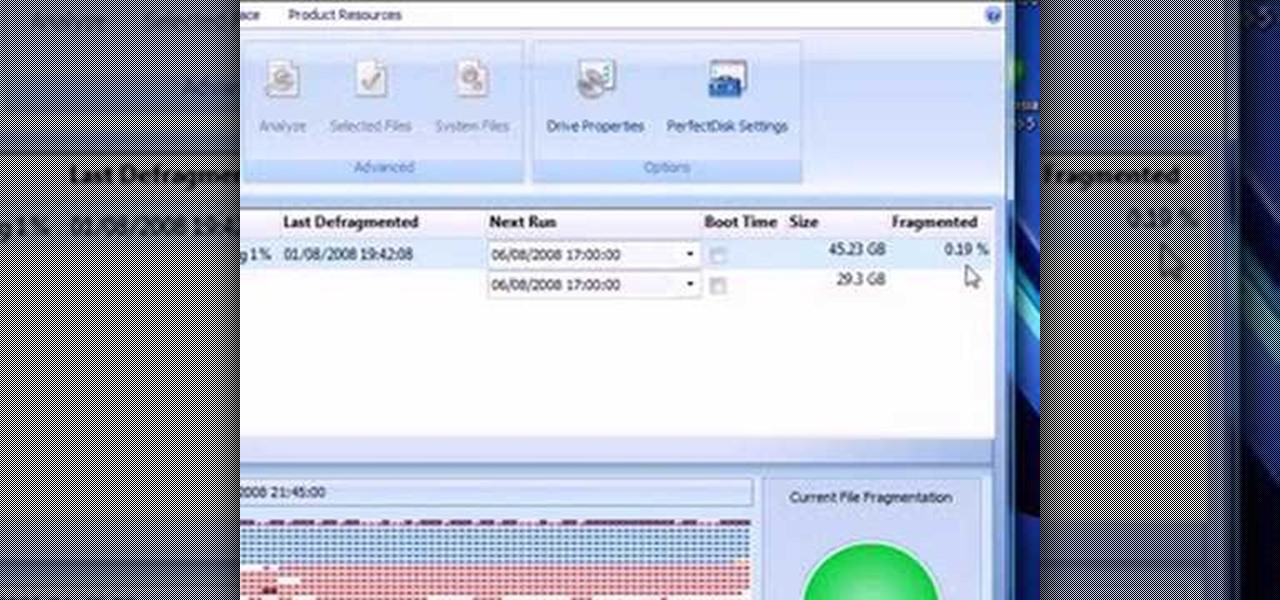
This video presents how to defragment and shrink a Windows Vista partition using Perfect Disk 2008 Professional program.First you need to download and install software application named Perfect Disk 2008.Type Perfect Disk 2008 into Google search engine, choose first link from the list.On the Raxco software home page choose Free Evaluation option from the list to the right.Download and install Perfect Disk 2008 Professional.Once it is installed, run the application. From Menu choose Analyze op...
Wearing a seat belt while in a car can save your life. Do you know how to adjust and properly use it? Learn how to drive safe and use seat belts properly (Ford DSFL). A professional driver explains how to fasten your seat belt properly.
What do you know about braking in an emergency situation? If you're not even sure what kind of brakes you have on your car or truck, then you need to do some research. Learn how to drive safe and deal with emergency stops (Ford DSFL). A professional driver explains the differences between braking with Antilock Braking Systems (ABS) and standard braking systems.
Driving a vehicle is a big responsibility and road safety is paramount. Improve your driving skills by using your most important tool -- your EYES! Learn how to drive safe and always look ahead (Ford DSFL). A professional driver explains why it's important to look where you want to go, not at an obstacle, when you're driving.