A non-CPU lens is one which does not have contacts on the rear mount, meaning it communicates with the rest of the camera solely through the aperture. This tutorial shows you how to set up the lens data for your camera, so you can get the most out of your non-CPU lens.
This video demonstrates how to reformat a hard drive and perform a clean installation of Windows XP operating system. The tutor first advises to make a back up of everything, including the drivers and my folders. He explains various methods by which one can take the backup of the data in a system. Now he shows how to format the C drive where you can now install Windows. He also shows software that is used to take the backup of important data before formatting. This video shows how to reformat...

Learn how to set up Internet on iPhone clones with this video. *First thing you need to do is to make an AT&T GPRS data account.
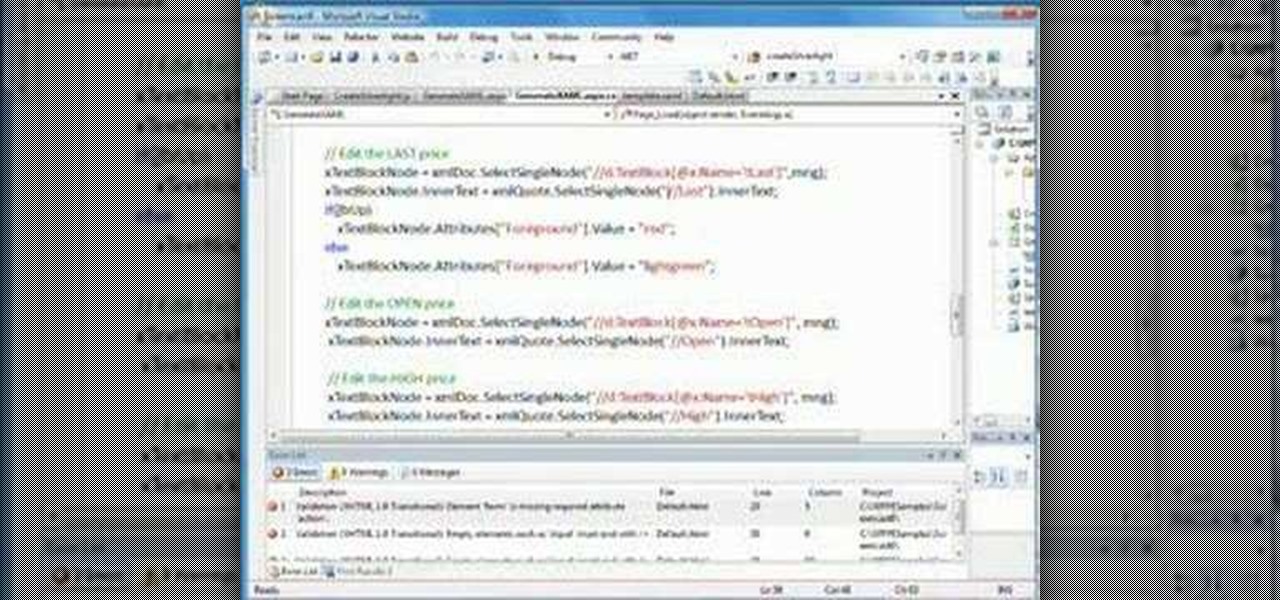
In this Silverlight web application tutorial you will learn how to create a basic stock quote application that updates in Realtime. You can apply this ASP.Net backend application to any realtime data update application you need to make. All you need is Silverlight to get you started.

If you've ever entered a lot of data into an Excel spreadsheet before, then you know that putting together even one spreadsheet is a pain in the butt. So if you are required to place all the data on one spreadsheet onto another spreadsheet, don't slave away for hours copying and pasting.
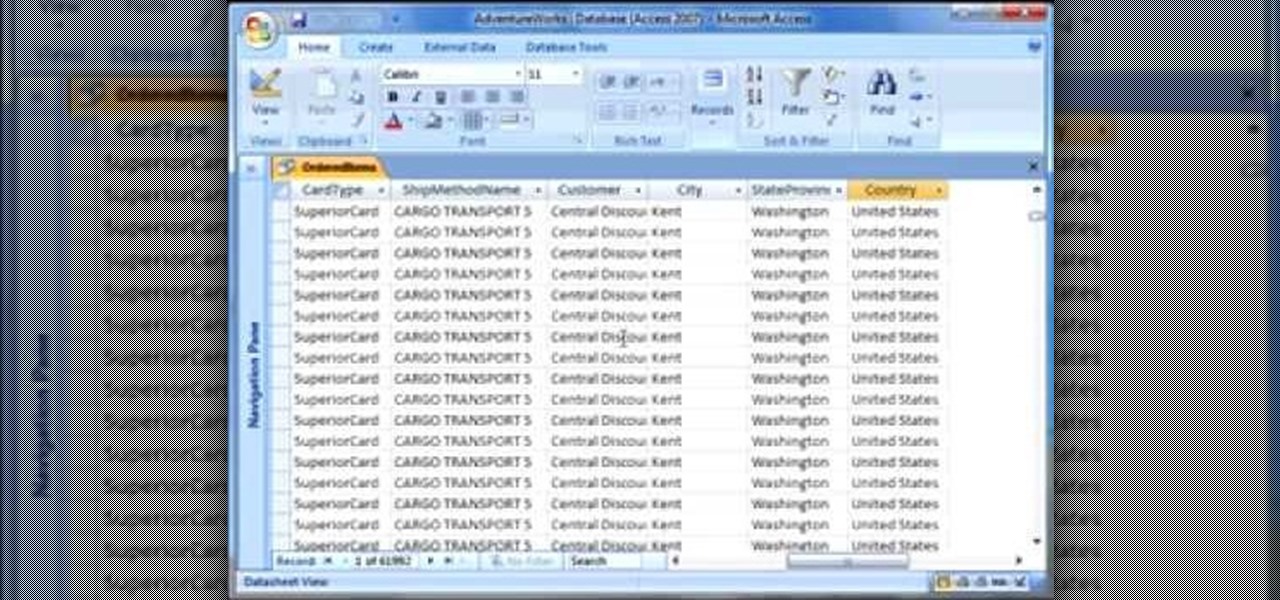
This screencast tutorial from Matthew MacDonald, author of Access 2007: The Missing Manual, shows you how to use pivot tables to analyze data in Microsoft Access 2007.

Are you 100% sure that all of your data is gone? Use Darik's Boot and Nuke to completely wipe a hard disk of all data.
This video shows you how to use Windows Task Manager to restart your computer without losing any data.
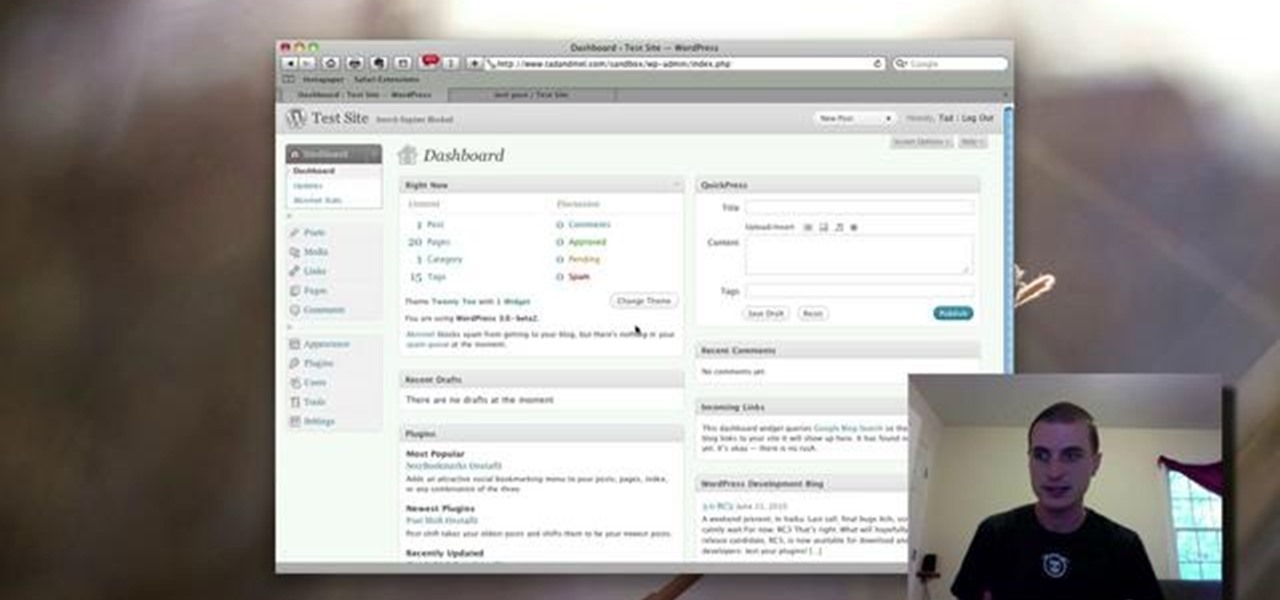
Want to add location data to posts on a self-hosted WordPress blog or website? This clip will show you the way. Every version of WordPress brings with it new features, new functions and new ways of doing things. Fortunately, the very same technology that allows an open-source blog publishing application like WordPress to exist in the first place also makes it easy for its users to share information about the abovesaid things through videos like this one. Take a look.
New to Microsoft Excel? Looking for a tip? How about a tip so mind-blowingly useful as to qualify as a magic trick? You're in luck. In this MS Excel tutorial from ExcelIsFun, the 650th installment in their series of digital spreadsheet magic tricks, you'll learn see how to take all records from a data set and place them into one column using the INDEX, INT, ROWS and MOD functions.
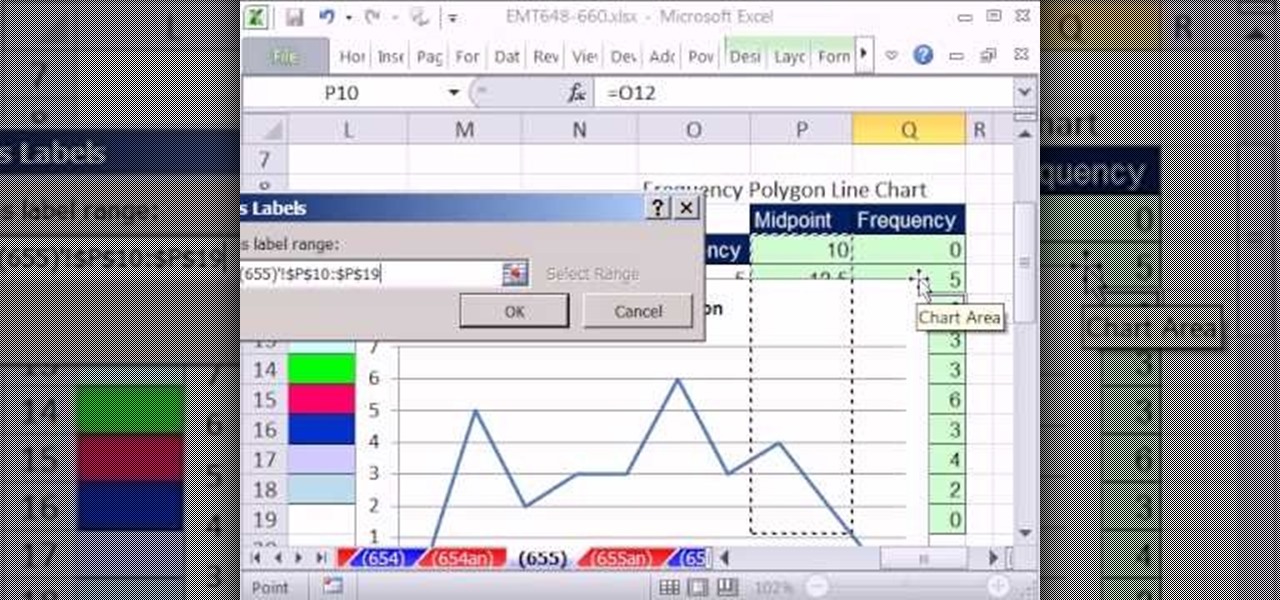
New to Microsoft Excel? Looking for a tip? How about a tip so mind-blowingly useful as to qualify as a magic trick? You're in luck. In this MS Excel tutorial from ExcelIsFun, the 655th installment in their series of digital spreadsheet magic tricks, you'll learn see how to create a statistical frequency polygon using a line chart. Also see how Excel mistakenly interprets number category label data as Number Series data.
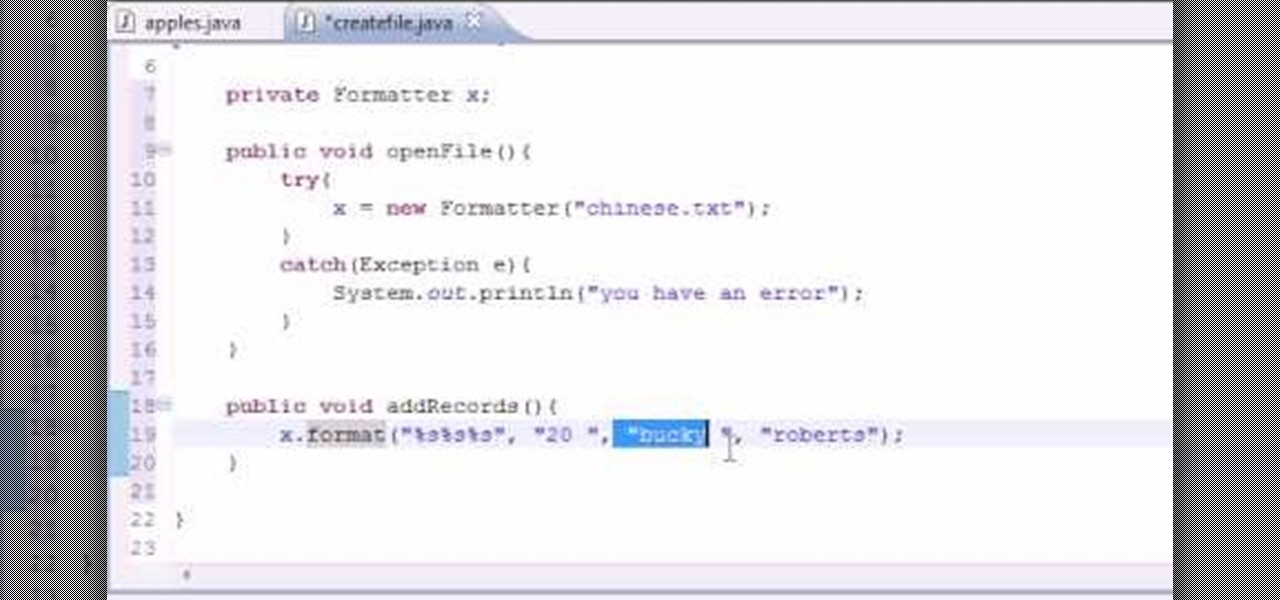
Want to program your own Java games and applications but don't know beans about object-oriented programming? Never you fear. This free video tutorial from TheNewBoston will have you coding your own Java apps in no time flat. Specifically, this lesson discusses how to write data to an external file when writing code in the Java programming language. For more information, including detailed, step-by-step instructions, watch this helpful programmer's guide.
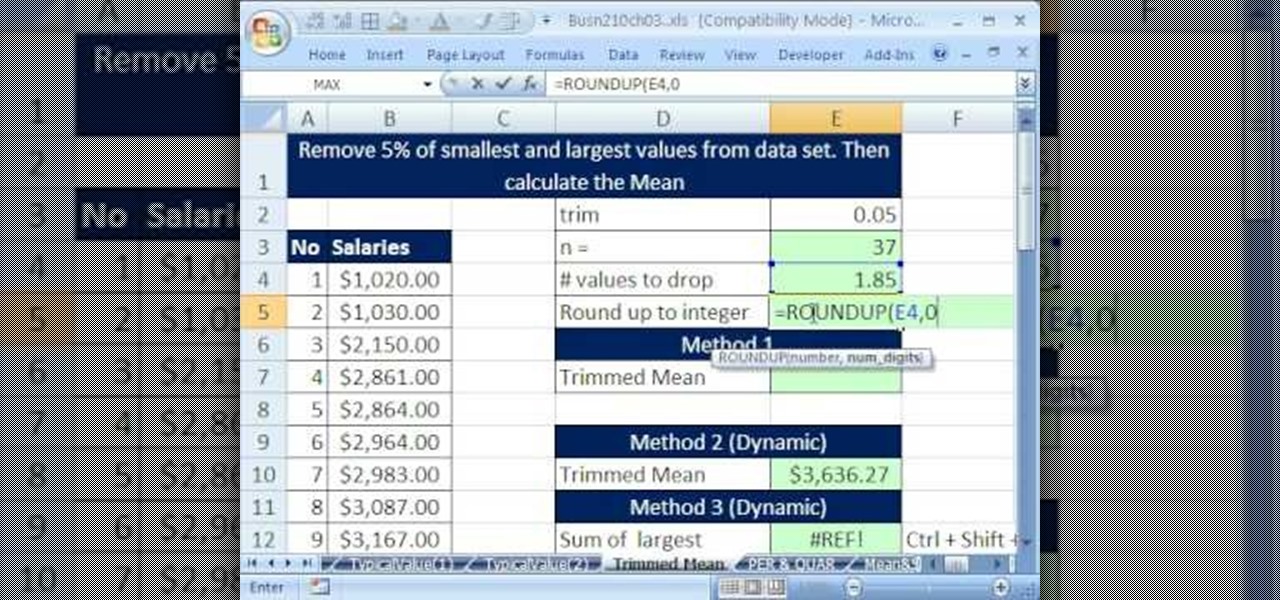
If you use Microsoft Excel on a regular basis, odds are you work with numbers. Put those numbers to work. Statistical analysis allows you to find patterns, trends and probabilities within your data. In this MS Excel tutorial from everyone's favorite Excel guru, YouTube's ExcelsFun, the 36th installment in his "Excel Statistics" series of free video lessons, you'll learn how to calculate a trimmed mean, which is used when there are extreme values in the data set that might skew the mean.
If you use Microsoft Excel on a regular basis, odds are you work with numbers. Put those numbers to work. Statistical analysis allows you to find patterns, trends and probabilities within your data. In this MS Excel tutorial from everyone's favorite Excel guru, YouTube's ExcelsFun, the 39th installment in his "Excel Statistics" series of free video lessons, you'll learn about variability (or dispersion or spread). Create an X-Y Scatter Diagram chart showing data points and the mean.
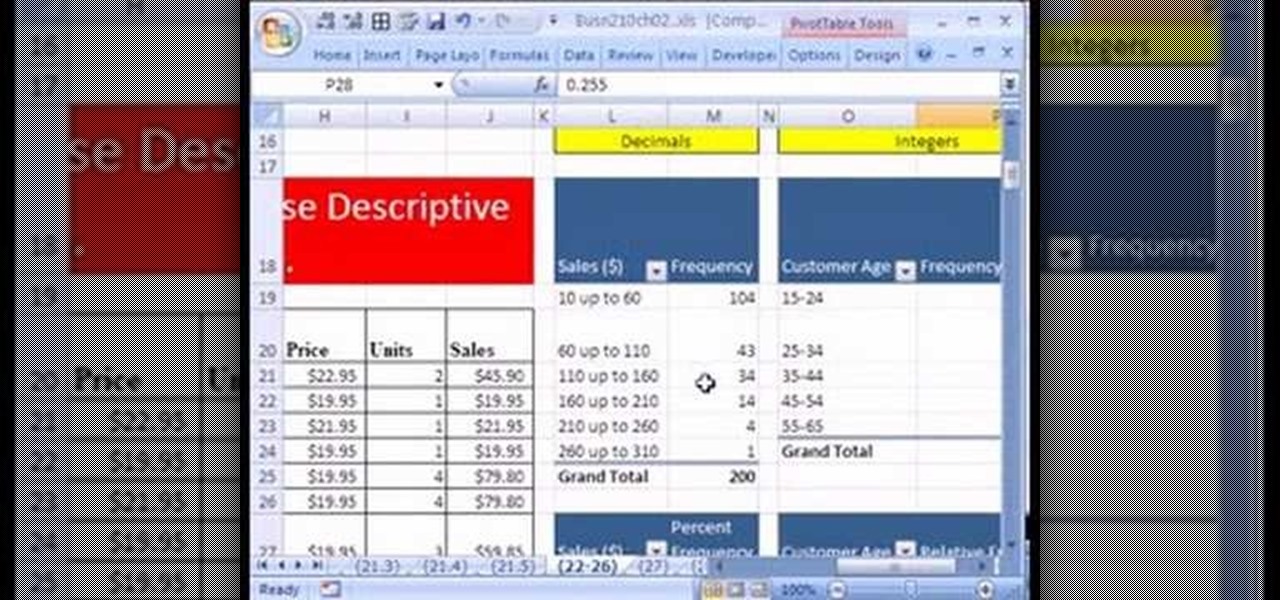
If you use Microsoft Excel on a regular basis, odds are you work with numbers. Put those numbers to work. Statistical analysis allows you to find patterns, trends and probabilities within your data. In this MS Excel tutorial from everyone's favorite Excel guru, YouTube's ExcelsFun, the 25th installment in his "Excel Statistics" series of free video lessons, you'll learn how to create quantitative data percent & relative frequency distributions with pivot tables. Also see how to create a histo...
If you use Microsoft Excel on a regular basis, odds are you work with numbers. Put those numbers to work. Statistical analysis allows you to find patterns, trends and probabilities within your data. In this MS Excel tutorial from everyone's favorite Excel guru, YouTube's ExcelsFun, the 22nd installment in his "Excel Statistics" series of free video lessons, you'll learn how to create a percent (%) cumulative frequency distribution with formulas, a histogram and an ogive chart. See how to add ...
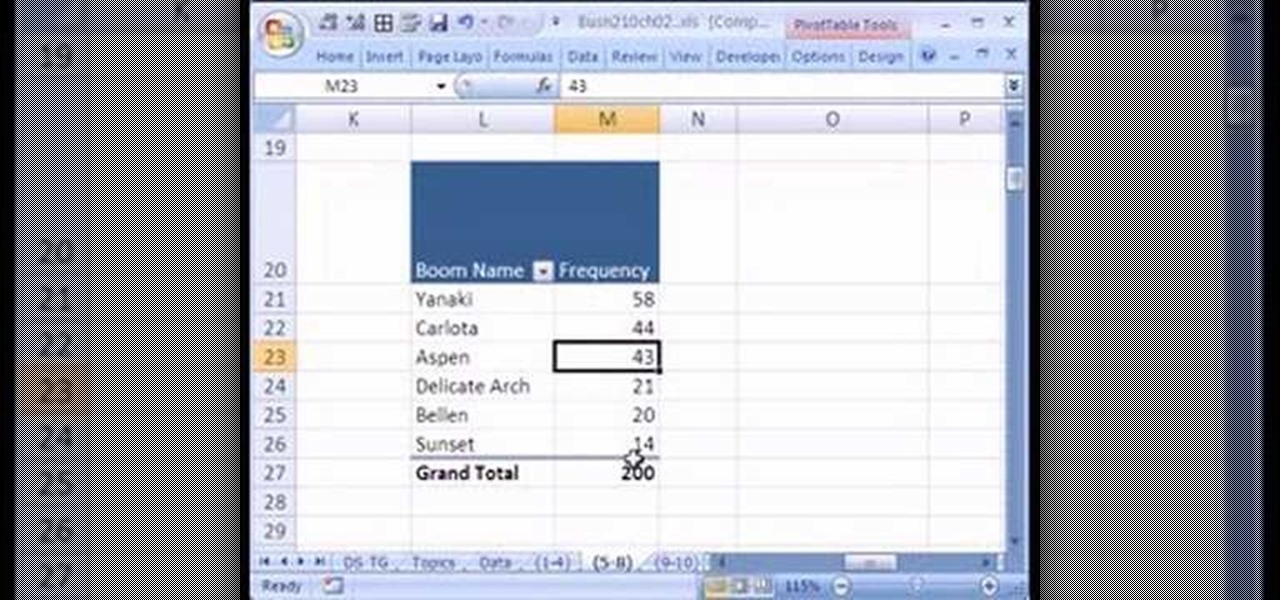
If you use Microsoft Excel on a regular basis, odds are you work with numbers. Put those numbers to work. Statistical analysis allows you to find patterns, trends and probabilities within your data. In this MS Excel tutorial from everyone's favorite Excel guru, YouTube's ExcelsFun, the 15th installment in his "Excel Statistics" series of free video lessons, you'll learn how to use create a frequency distribution, relative frequency distribution, percent frequency distribution and pie chart wi...
New to Microsoft Excel? Looking for a tip? How about a tip so mind-blowingly useful as to qualify as a magic trick? You're in luck. In this MS Excel tutorial from ExcelIsFun, the 351st installment in their series of digital spreadsheet magic tricks, you'll learn how to create an area chart for x and f(x) data as well as how to use the IF function to show a second data set plotted to show a specific area section.
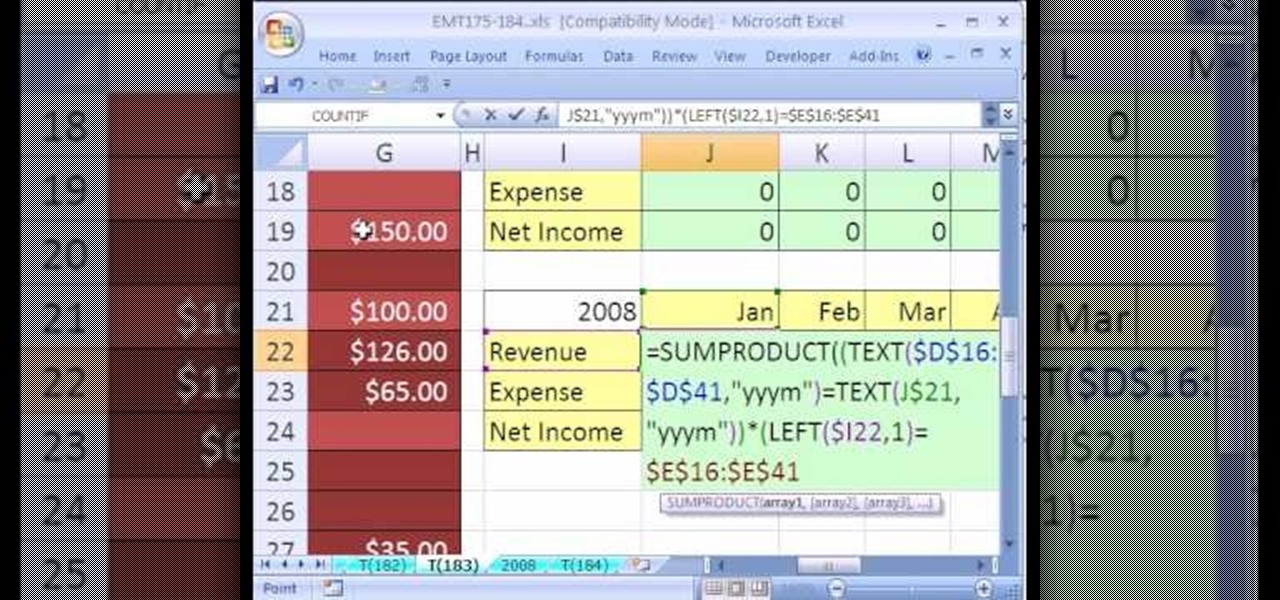
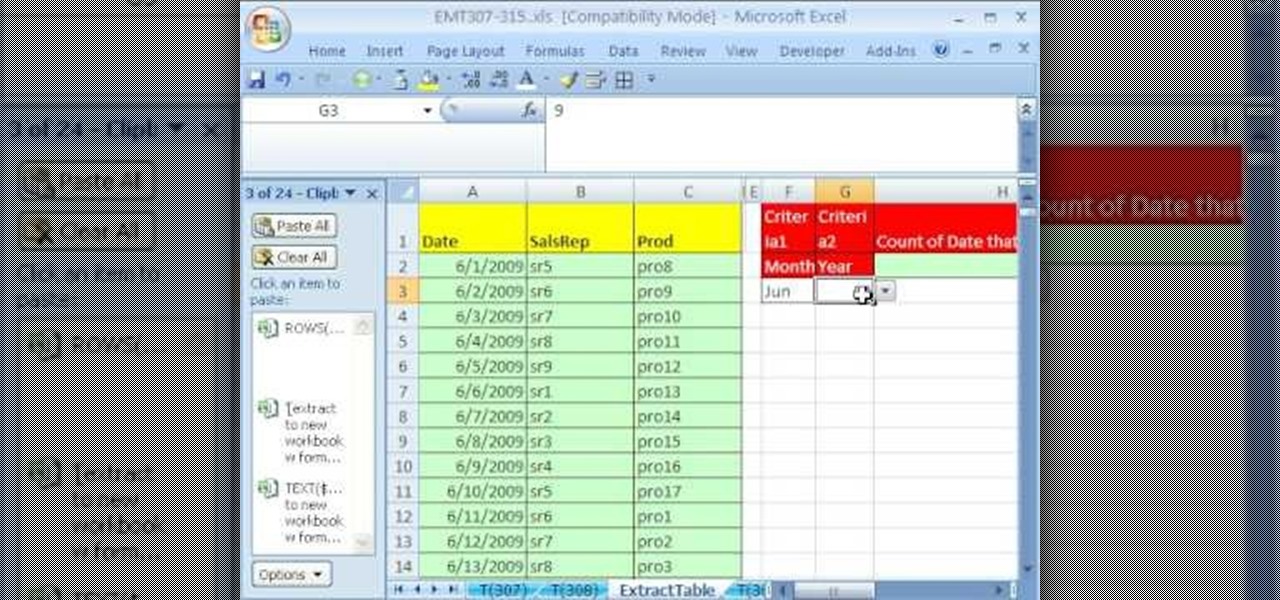
New to Microsoft Excel? Looking for a tip? How about a tip so mind-blowingly useful as to qualify as a magic trick? You're in luck. In this MS Excel tutorial from ExcelIsFun, the 183rd installment in their series of digital spreadsheet magic tricks, you'll learn how to sum revenue from a table of data by year and month using the SUMPRODUCT, TEXT, SUM, IF & LEFT functions in an array formula.
New to Excel? Looking for a tip? How about a tip so mind-blowingly useful as to qualify as a magic trick? You're in luck. With this video tutorial from ExcelIsFun, the 308th installment in their series of digital spreadsheet video tutorials, you'll learn how to extract data to a new workbook by array formula. Functions used include IF, ROWS, INDEX, TEXT, ROW and SUMPRODUCT.
In this video tutorial, Chris Pels shows how to create a custom profile provider to store and retrieve data associated with a user profile in SQL Server tables separate from the standard ASP.NET membership provider’s aspnet_Profile table. The principles covered in this video will apply to creating profile providers for other databases like Access and Oracle. After learning how to create the custom profile provider we learn how to install the provider in a web site and see a demonstration of l...
If you're reading this, you're likely a tech-savvy coding pro whose analytical talents are mostly applied to designing apps, cracking passwords, and infiltrating networks — all of which are admirable activities for both aspiring and seasoned white hat hackers. But there are other profitable ways that you can put these types of skills to use, namely in the world of investment and trading.
Many popular apps automatically share your personal data. While I have accepted a certain amount of data collection from Google, to know companies such as Facebook perform this without my consent bothers me. After some researching, I've found a great solution, and it doesn't require root.
Project Fi, Google's MVNO, is running a new promotion on the latest and greatest from LG. From July 16 until the 29th, whenever you order and activate the LG G7 ThinQ or LG V35 ThinQ, you will receive a $300 service credit. When you do the numbers, that equals a minimum of three free months of service.
Among its many new features, Android P returns the spirit of lock screen widgets to users by presenting the current temperature and weather conditions underneath the clock. It isn't flashy, but it's a fun and useful addition that, unfortunately, does not always work. If your lock screen weather isn't showing up, you might want to try these steps to fix it.
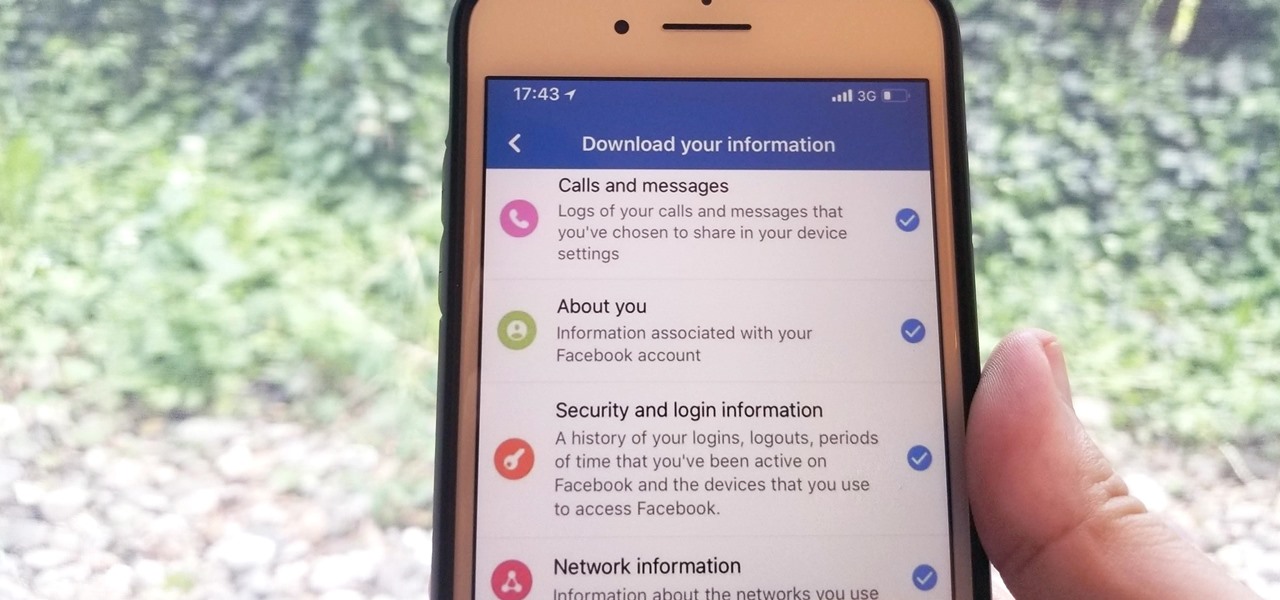
We've been able to download our Facebook data onto our computers for a while now, but now you can do so right from the comfort of your iPhone or Android phone. With it, you'll be able to integrate your data into other apps that support it or even just download it before you deactivate your account.
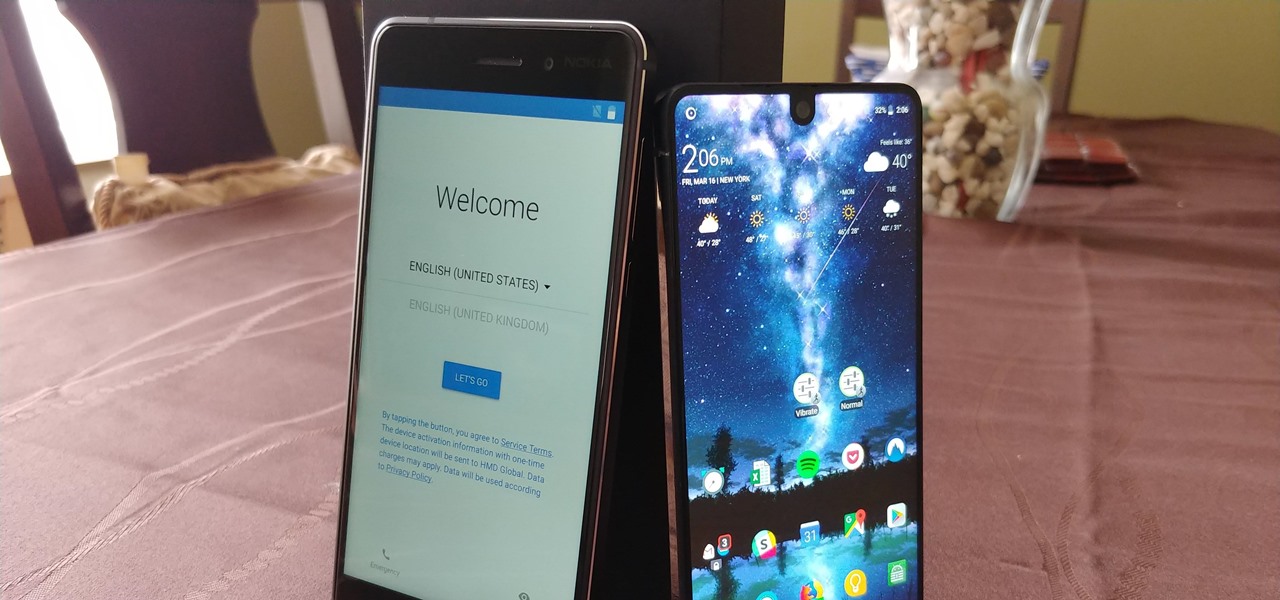
Setting up a new Android phone can be a pain. Although Google has some automated features, it does not restore everything. When it comes to transferring certain types of data like files and SMS logs, it's even trickier. By following our steps, you can be sure that you all your data will follow you to your new device.
This month, the power of artificial intelligence will be coming to more augmented reality developers as a leader in the game and 3D software development space and a major force behind the current school of cloud-based AI have officially announced a new partnership.
The nemesis of music streamers is data caps, cell phone or otherwise. Restricting monthly data and forcing users to decide between quantity and quality of music has had audiophiles tearing their hair out since streaming toppled the iPod. While the problem regarding music quality seems difficult to tackle, it's far from impossible.
Despite the threat of superbugs, physicians continue to prescribe antibiotics when they might not be needed, and patients are suffering.
Apple announced upcoming changes today to prevent third-party tracking of users and prevent autoplay, on Safari. Safari will prevent the recording (by anyone other than Apple) of users' browsing behavior, and by doing so prevent advertisers from targeting ads based on individuals' history.
Augmented and mixed reality developer Arvizio is working on a suite of software solutions for enterprises that will extend HoloLens capabilities as a full-fledged collaboration and conferencing tool. The company will demonstrate its Mixed Reality Studio suite to attendees at the Augmented World Expo, which begins later this month in Santa Clara, California.
Bose Corp is the latest company trying to make another dollar off of you without your permission. Bose Connect, the companion app to the swag $350 Bose headphones, is not the Jane to your Jack that maybe we all hoped it to be.
Google, the company that rules the internet, is now testing a method to leverage its machine learning with its ubiquitous presence on mobile devices. The new model they're employing is called Federated Learning, and it hopes to apply artificial intelligence to Google's services on Android without compromising user privacy.
Antibiotic-resistant infections that usually occur only in hospital settings are spreading in communities, increasing hospital stays—and danger—for young children.
If you've ever wanted to live in the Matrix—or at least the iconic digital rain data visualization that Neo saw when realizing he was, indeed, the "one"—you can now do that with the Microsoft HoloLens. Just download The Red Pill.
Welcome back my friends !! Today we'll go through the second part of this C# series
If you exceed your monthly mobile data limit, your cell phone bill can skyrocket pretty quickly. This is why a lot of people vigilantly monitor internet usage and even uninstall apps that use too much background data.
Though you can use the Social Engineering Toolkit to clone websites, this way is much more customisable.
You encounter this problem many times, when you plug your flash drive, and suddenly you find that all your data has become shortcuts everywhere!!!