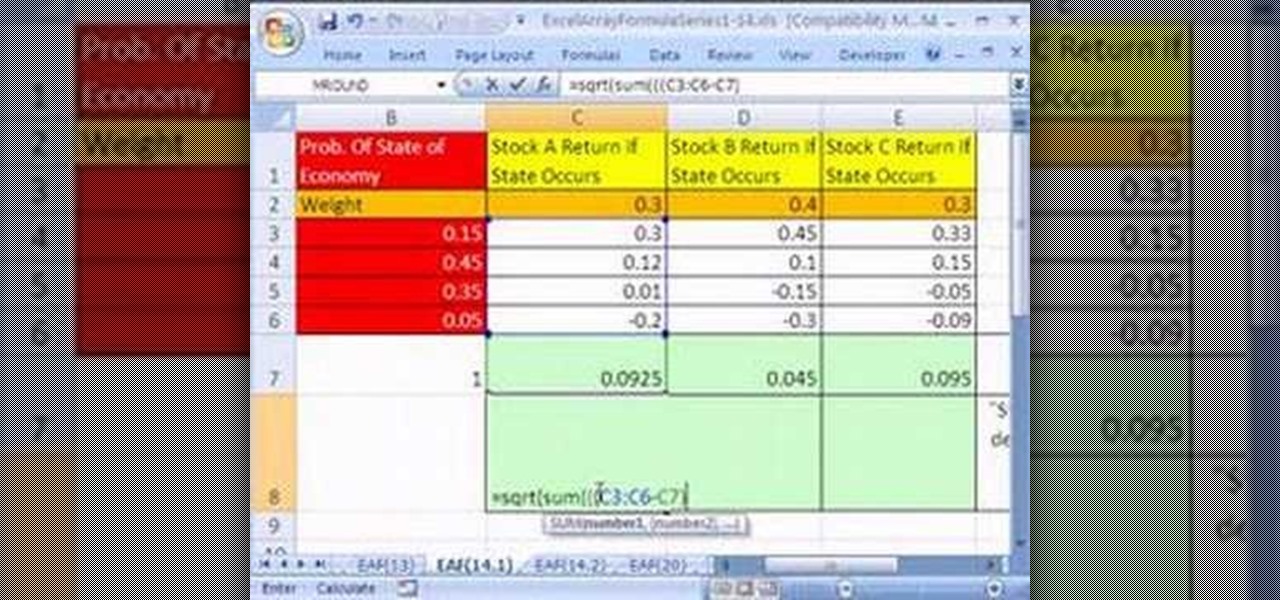
Looking for a primer on how to create and work with array formulas in Microsoft Office Excel? You've come to the right place. In this free video tutorial from everyone's favorite MS Excel guru, YouTube's ExcelIsFun, the 14th installment in his series of Excel array formula series, you'll learn how to create array formulas for individual stock return and standard deviation given different assumed states of the future economy.

Looking for a primer on how to create and work with array formulas in Microsoft Office Excel? You've come to the right place. In this free video tutorial from everyone's favorite MS Excel guru, YouTube's ExcelIsFun, the 12th installment in his series of Excel array formula series, you'll learn how to create array formulas for stock portfolio return & standard deviation.
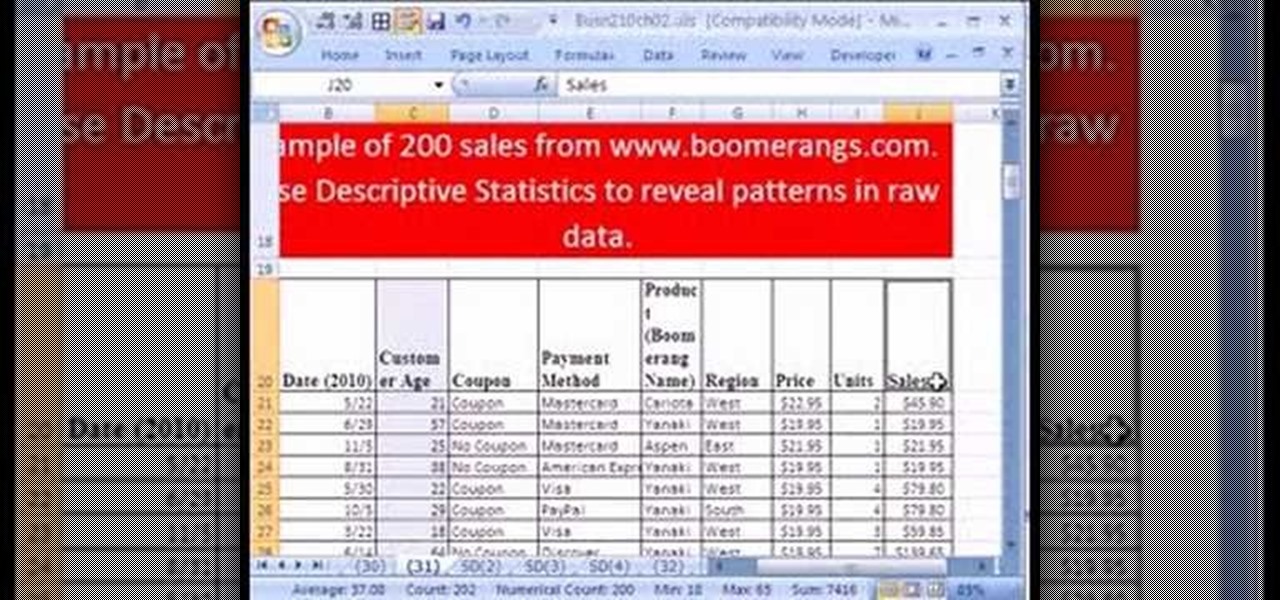
If you use Microsoft Excel on a regular basis, odds are you work with numbers. Put those numbers to work. Statistical analysis allows you to find patterns, trends and probabilities within your data. In this MS Excel tutorial from everyone's favorite Excel guru, YouTube's ExcelsFun, the 30th installment in his "Excel Statistics" series of free video lessons, you'll learn how to create a scatter diagram for 2 quantitative variables.

Looking for a primer on how to create and work with names in Microsoft Office Excel? You've come to the right place. In this free video tutorial from everyone's favorite MS Excel guru, YouTube's ExcelIsFun, the 12th installment in his series of Excel name tricks, you'll learn apply names to formulas using Excel's built-in Apply Name Feature.
Looking for a primer on how to create and work with names in Microsoft Office Excel? You've come to the right place. In this free video tutorial from everyone's favorite MS Excel guru, YouTube's ExcelIsFun, the 4th installment in his series of Excel name tricks, you'll learn to use short Excel names to expedite the formula creation process. For detailed instructions, watch this free video Excel lesson.
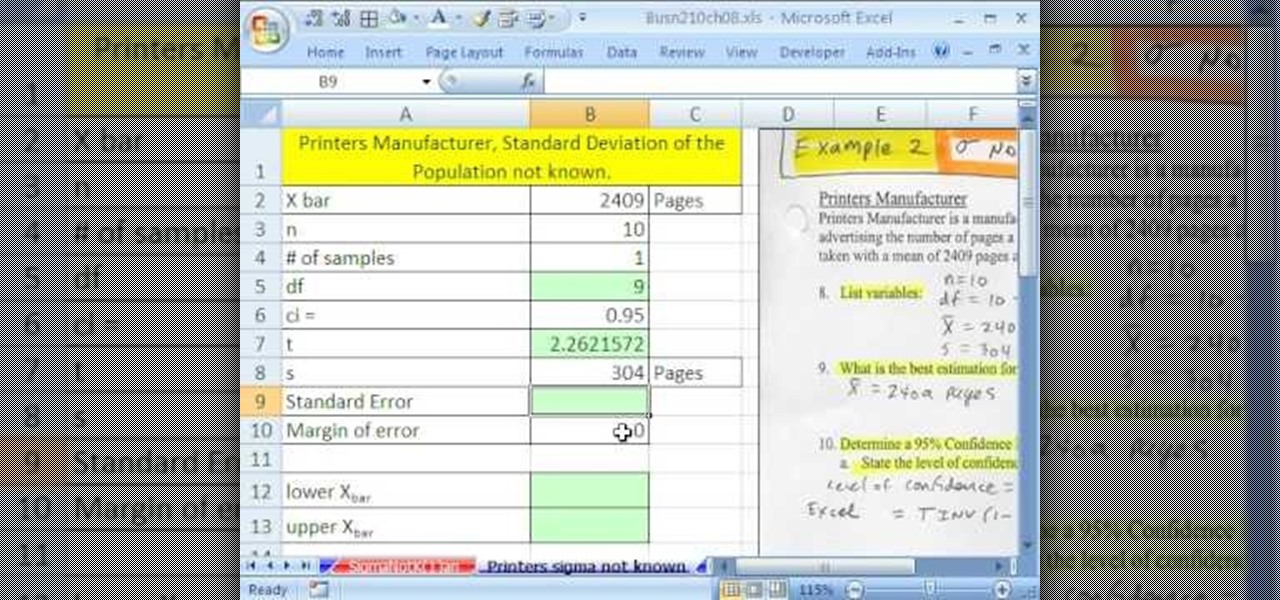
If you use Microsoft Excel on a regular basis, odds are you work with numbers. Put those numbers to work. Statistical analysis allows you to find patterns, trends and probabilities within your data. In this MS Excel tutorial from everyone's favorite Excel guru, YouTube's ExcelsFun, the 83rd installment in his "Excel Statistics" series of free video lessons, you'll learn how to construct confidence intervals when the sigma (population standard deviation) in NOT known using the TINV function.

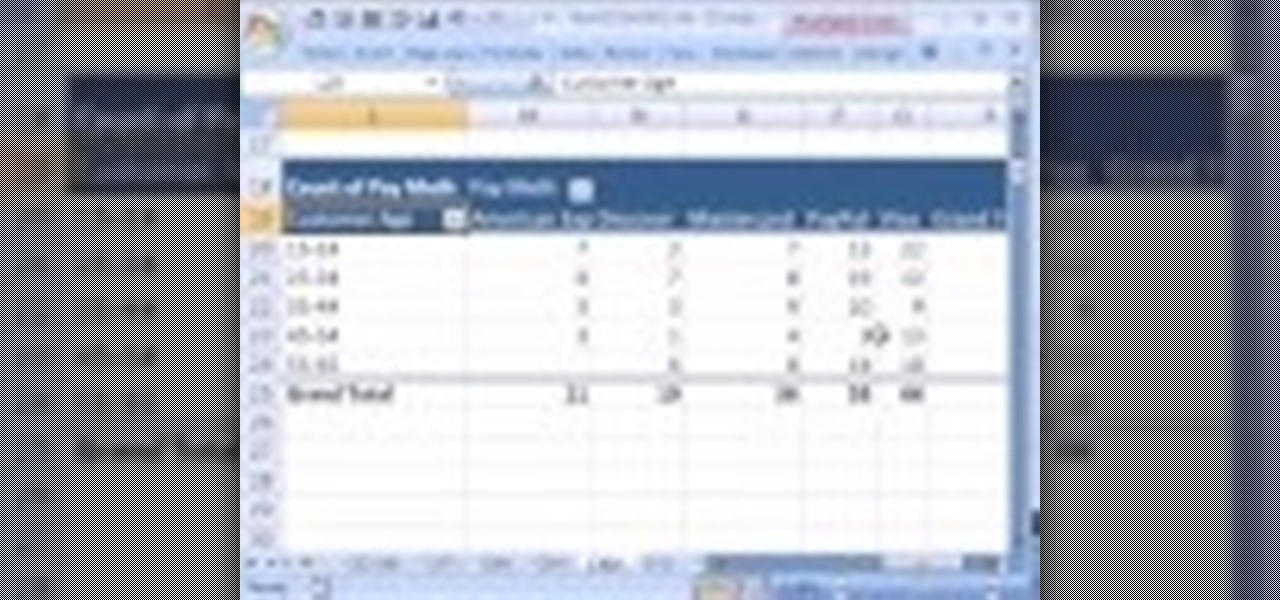
If you use Microsoft Excel on a regular basis, odds are you work with numbers. Put those numbers to work. Statistical analysis allows you to find patterns, trends and probabilities within your data. In this MS Excel tutorial from everyone's favorite Excel guru, YouTube's ExcelsFun, the 29th installment in his "Excel Statistics" series of free video lessons, you'll learn how to create quantitative data cross tabulation using a pivot table (PivotTable).

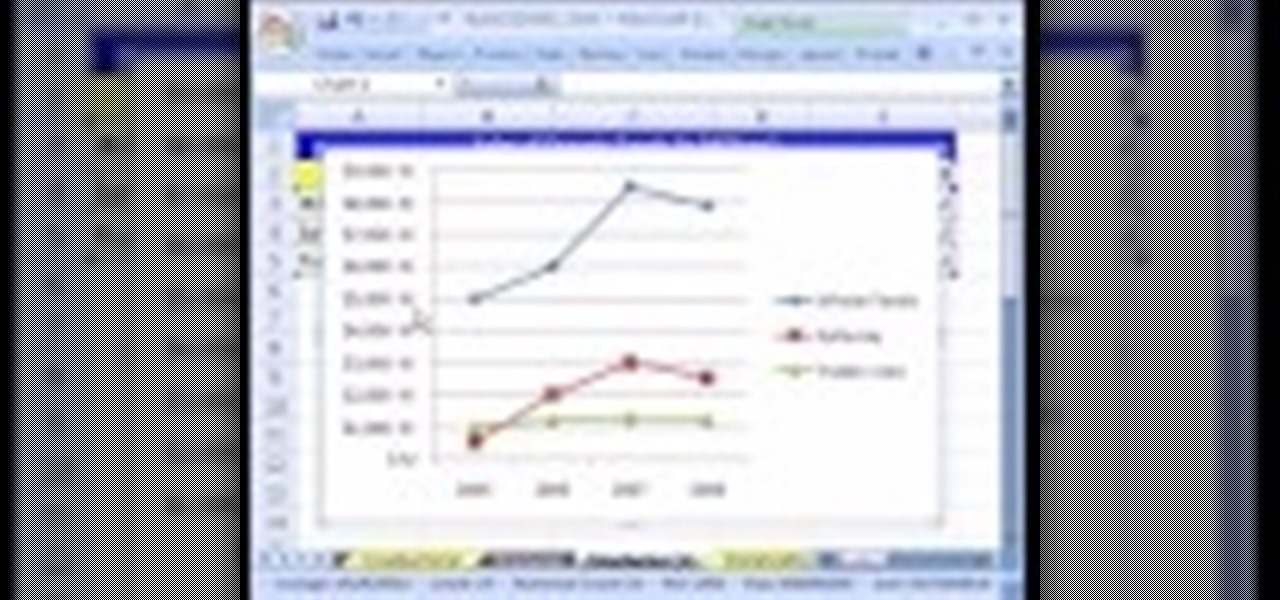
If you use Microsoft Excel on a regular basis, odds are you work with numbers. Put those numbers to work. Statistical analysis allows you to find patterns, trends and probabilities within your data. In this MS Excel tutorial from everyone's favorite Excel guru, YouTube's ExcelsFun, the 11th installment in his "Excel Statistics" series of free video lessons, you'll learn how to work with, and create charts for, cross-sectional and time-series data.

New to Microsoft Excel? Looking for a tip? How about a tip so mind-blowingly useful as to qualify as a magic trick? You're in luck. In this MS Excel tutorial from ExcelIsFun, the 90th installment in their series of digital spreadsheet magic tricks, you'll learn how to create a dynamic, two-way IF function lookup formula for pulling data from a different Workbook.

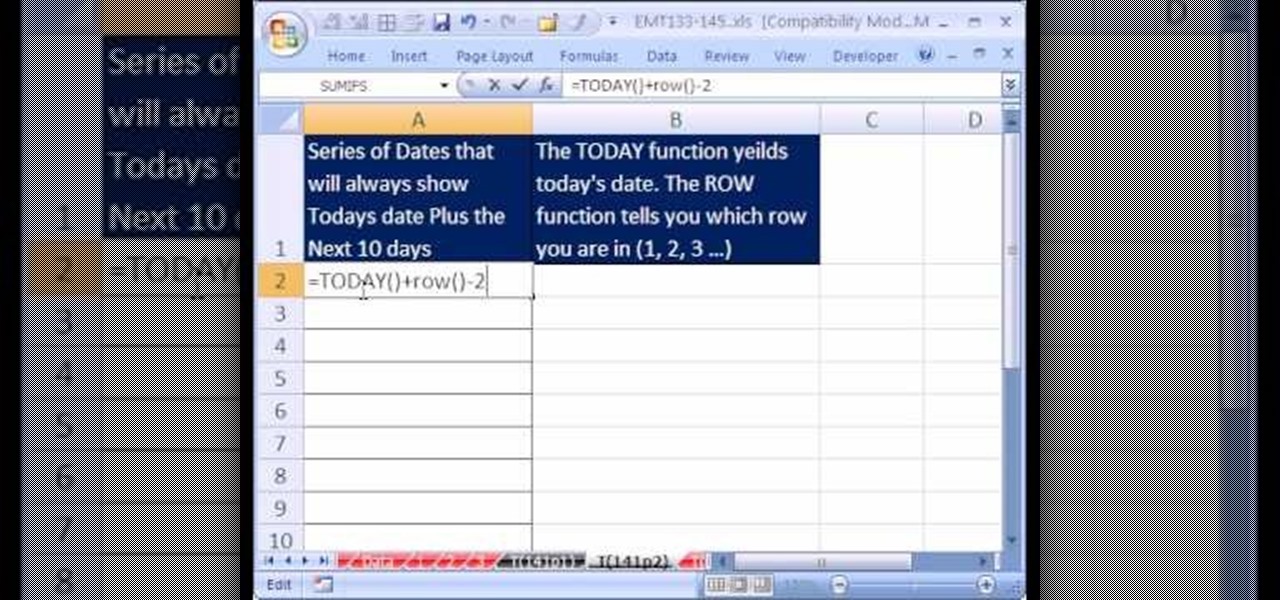
Love Microsoft Excel? This clip contains a tip that just might induce you to. With this free video tutorial from ExcelIsFun, the 141st installment of his "YouTubers Love Excel" or YTLE series of free video MS Excel lessons, you'll learn how to generate a series of dates with the TODAY and ROW function that will always show today plus the next 10 days.

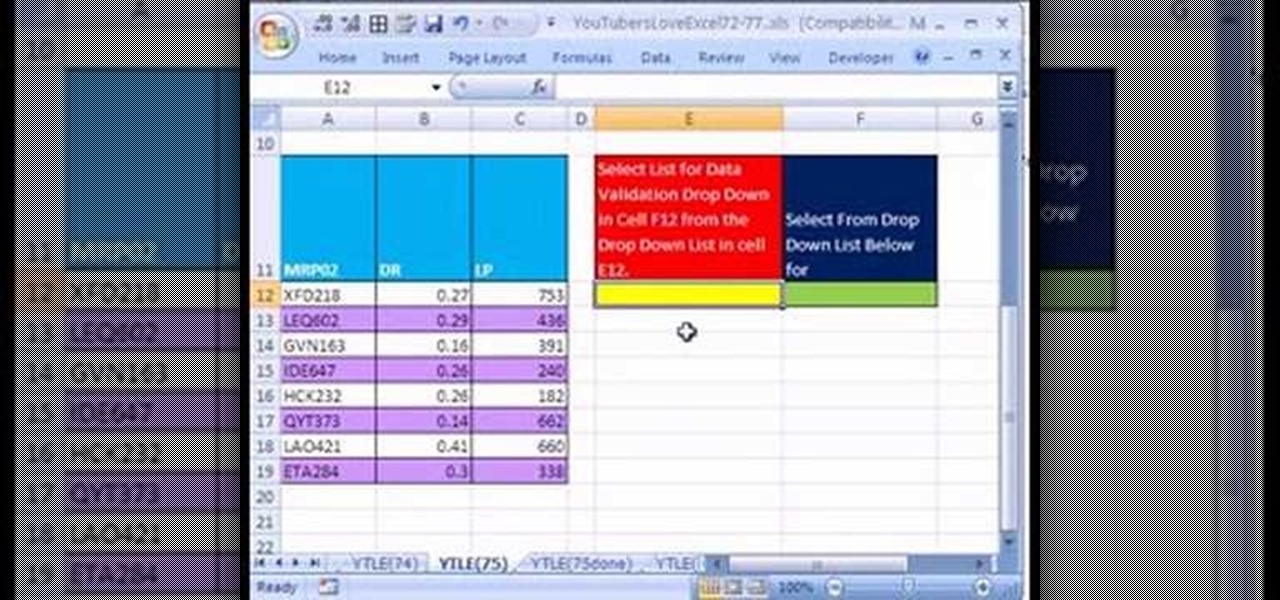
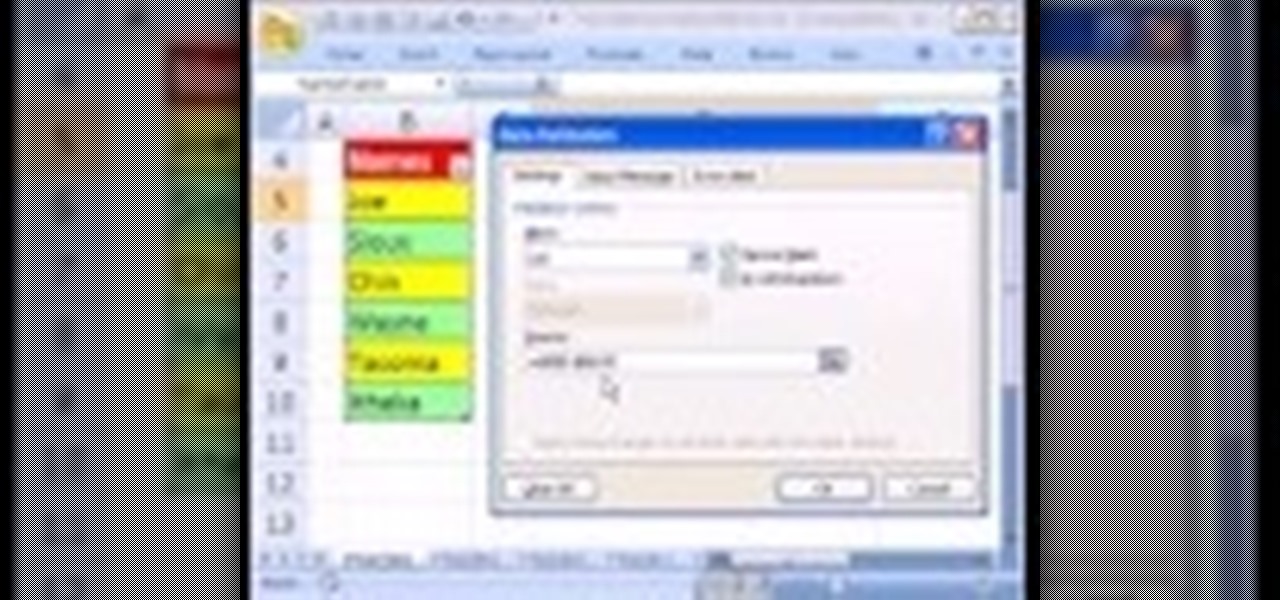
Love Microsoft Excel? This clip contains a tip that just might induce you to. With this free video tutorial from ExcelIsFun, the 75th installment of his "YouTubers Love Excel" or YTLE series of free video MS Excel lessons, you'll learn how to use name, the INDIRECT function and data validation drop-down lists to create DV lists based on DV lists.

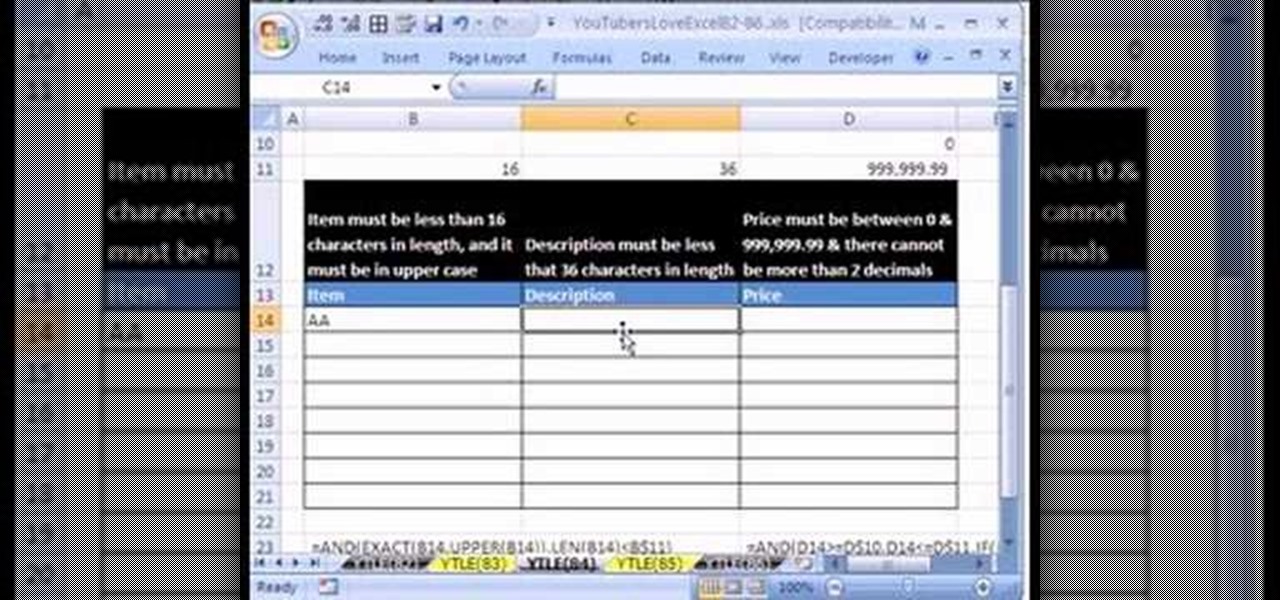
Love Microsoft Excel? This clip contains a tip that just might induce you to. With this free video tutorial from ExcelIsFun, the 84th installment of his "YouTubers Love Excel" or YTLE series of free video MS Excel lessons, you'll learn how to use custom true/false formulas for data validation and also see how to add an error message.

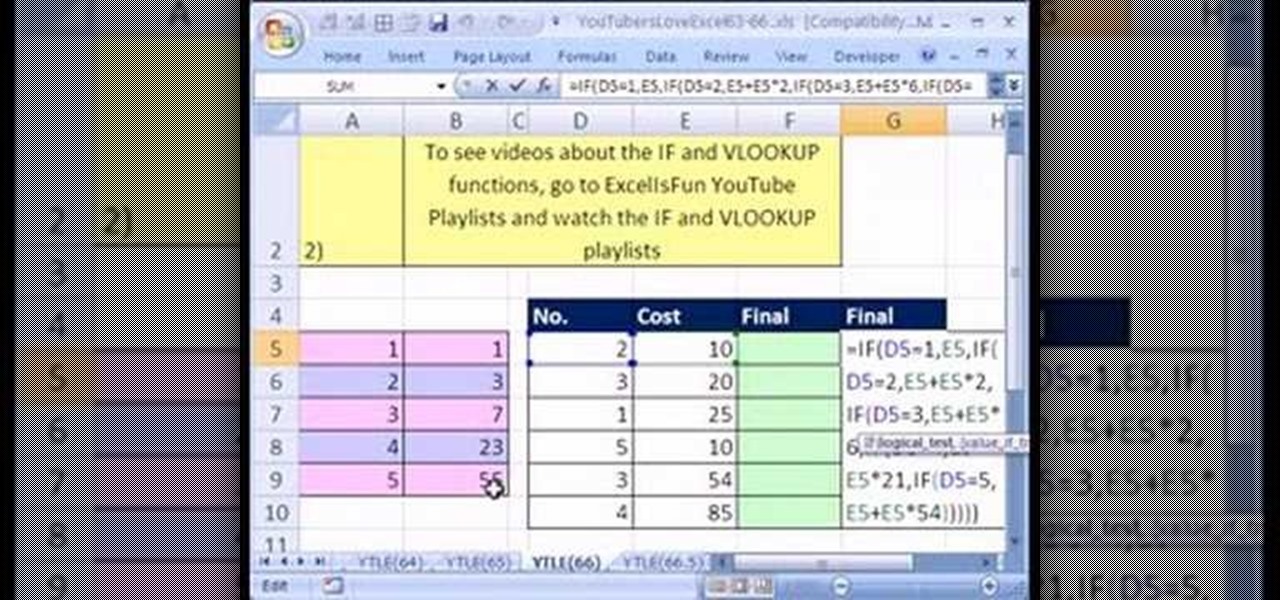
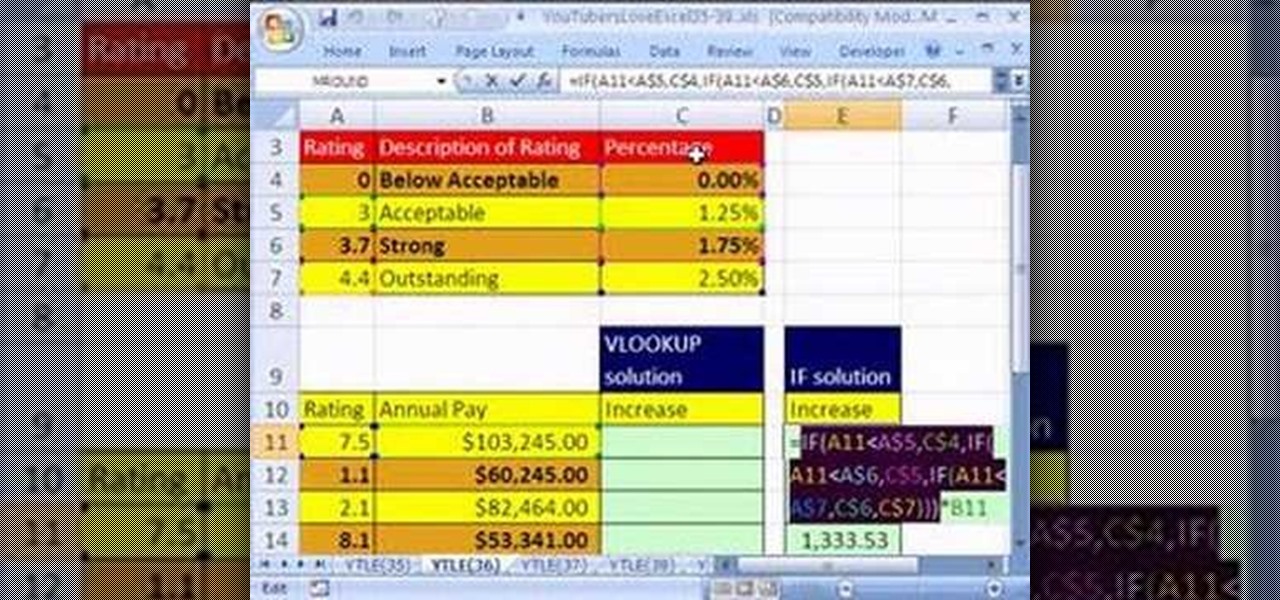
Love Microsoft Excel? This clip contains a tip that just might induce you to. With this free video tutorial from ExcelIsFun, the 66th installment of his "YouTubers Love Excel" or YTLE series of free video MS Excel lessons, you'll learn how to use the VLOOKUP function in a formula to replace a long IF function formula.

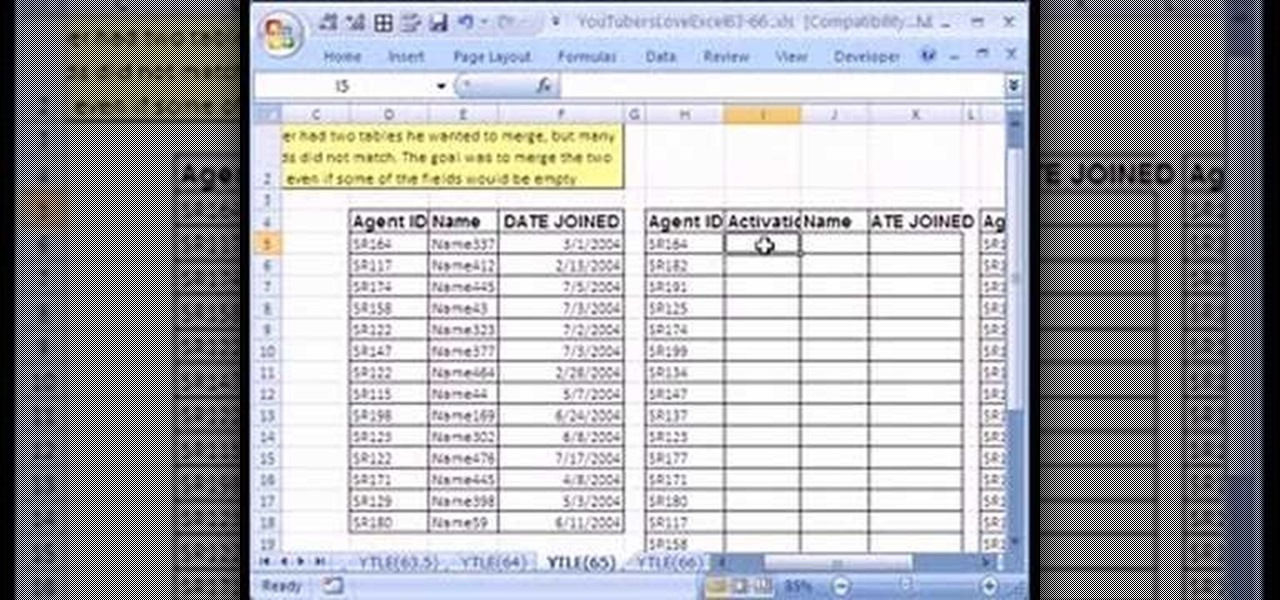
Love Microsoft Excel? This clip contains a tip that just might induce you to. With this free video tutorial from ExcelIsFun, the 63.5th installment of his "YouTubers Love Excel" or YTLE series of free video MS Excel lessons, you'll learn how to use the advanced filter "Unique Records Only" option and the VLOOKUP, COLUMN, IF, ISERROR and IFERROR functions to merge 2 tables.

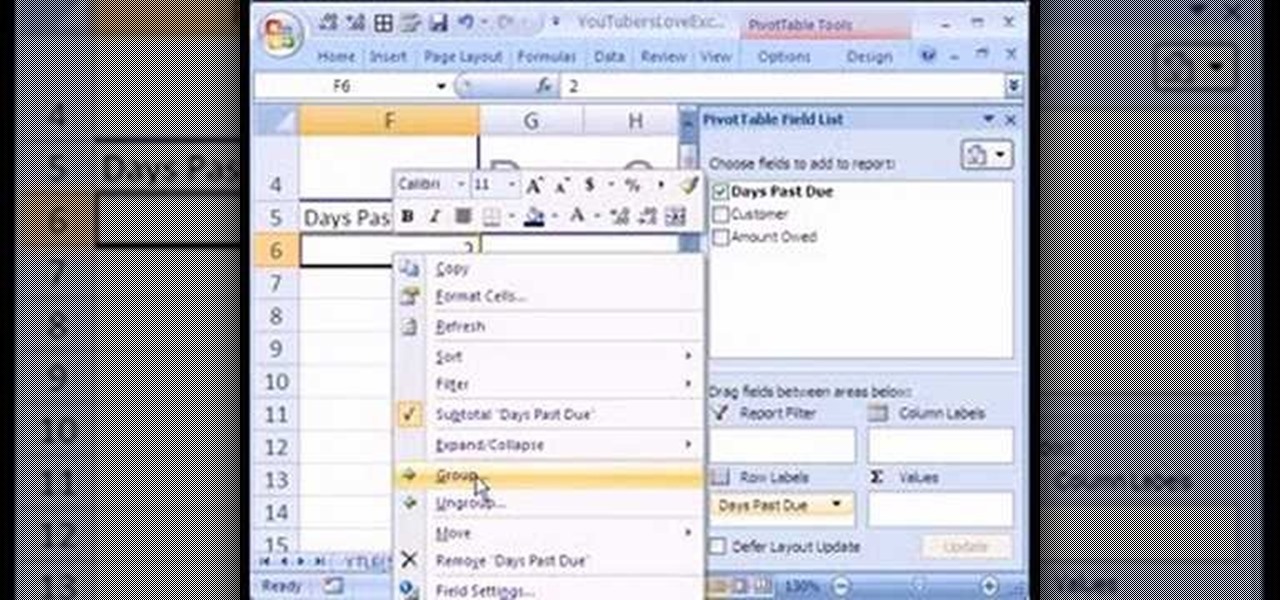
Love Microsoft Excel? This clip contains a tip that just might induce you to. With this free video tutorial from ExcelIsFun, the 59th installment of his "YouTubers Love Excel" or YTLE series of free video MS Excel lessons, you'll learn how to create an aged accounts receivable report using a pivot table (PivotTable) and grouping.

Love Microsoft Excel? This clip contains a tip that just might induce you to. With this free video tutorial from ExcelIsFun, the 58th installment of his "YouTubers Love Excel" or YTLE series of free video MS Excel lessons, you'll learn how to use the Excel 2007 table dynamic range feature with a data validation drop-down list without using the table name!

Love Microsoft Excel? This clip contains a tip that just might induce you to. With this free video tutorial from ExcelIsFun, the 37th installment of his "YouTubers Love Excel" or YTLE series of free video MS Excel lessons, you'll learn how to create a table of formulas and labels based on formula inputs in an assumption area.

Love Microsoft Excel? This clip contains a tip that just might induce you to. With this free video tutorial from ExcelIsFun, the 36th installment of his "YouTubers Love Excel" or YTLE series of free video MS Excel lessons, you'll learn how to use the VLOOKUP function to determine an increase in salary based on a rating scale.

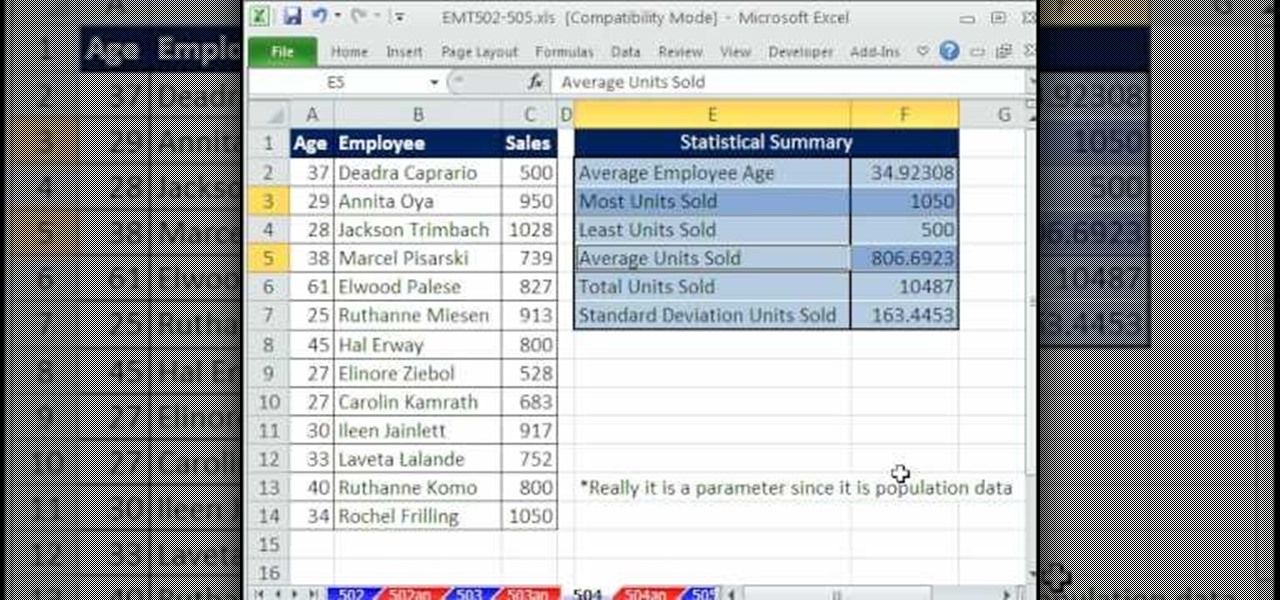
New to Microsoft Excel? Looking for a tip? How about a tip so mind-blowingly useful as to qualify as a magic trick? You're in luck. In this MS Excel tutorial from ExcelIsFun, the 504th installment in their series of digital spreadsheet magic tricks, you'll learn how to use the borders tab in the Format Cells dialog box to create a 3D effect.

New to Microsoft Excel? Looking for a tip? How about a tip so mind-blowingly useful as to qualify as a magic trick? You're in luck. In this MS Excel tutorial from ExcelIsFun, the 501st installment in their series of digital spreadsheet magic tricks, you'll learn how to work with time in Excel, making calculations and formatting temporal values.

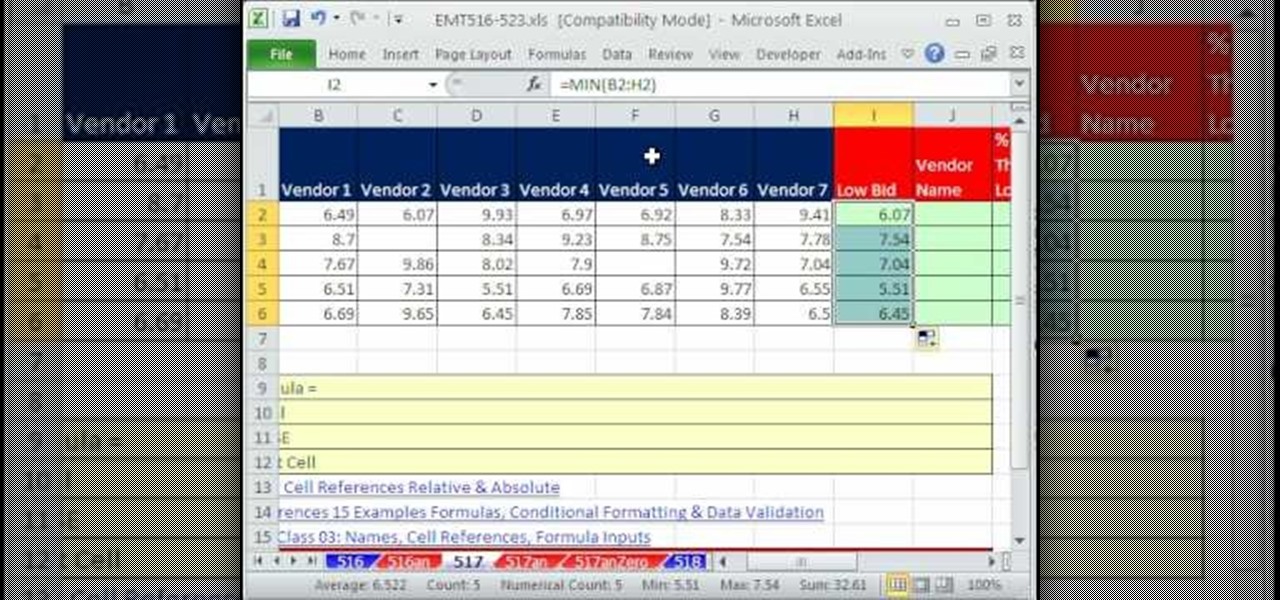
New to Microsoft Excel? Looking for a tip? How about a tip so mind-blowingly useful as to qualify as a magic trick? You're in luck. In this MS Excel tutorial from ExcelIsFun, the 517th installment in their series of digital spreadsheet magic tricks, you'll learn how to use the INDEX and MATCH functions to show vendor name associated with lowest bid.

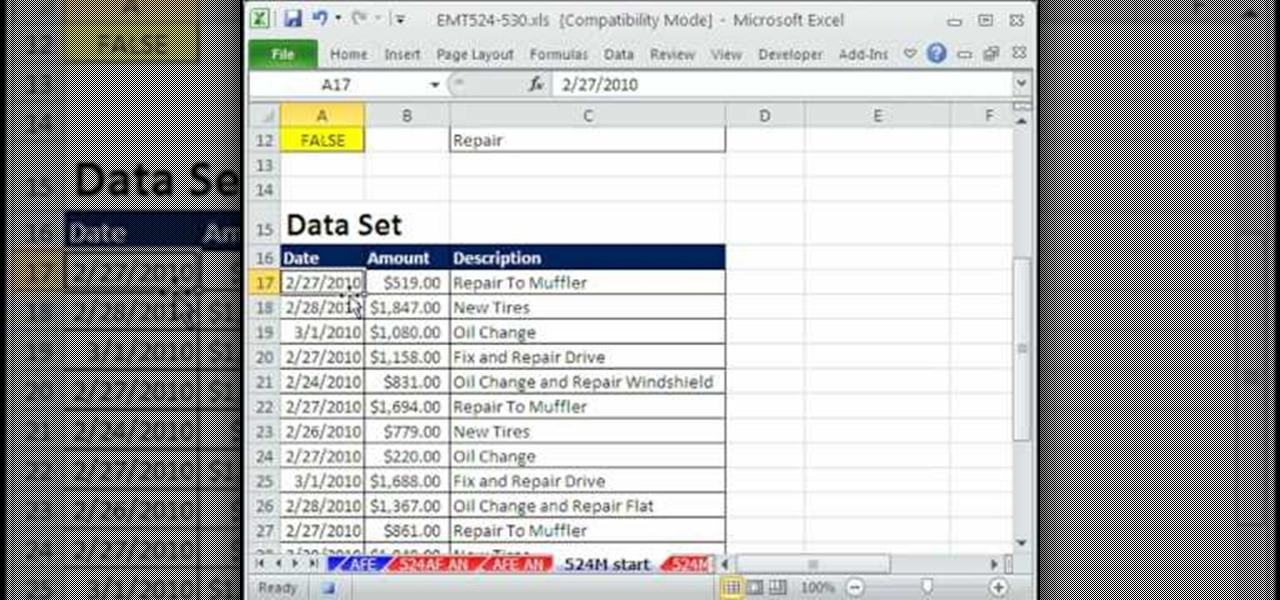
New to Microsoft Excel? Looking for a tip? How about a tip so mind-blowingly useful as to qualify as a magic trick? You're in luck. In this MS Excel tutorial from ExcelIsFun, the 524th installment in their series of digital spreadsheet magic tricks, you'll learn how to extract records with partial text NOT criteria via filter, advanced filter & array formula.

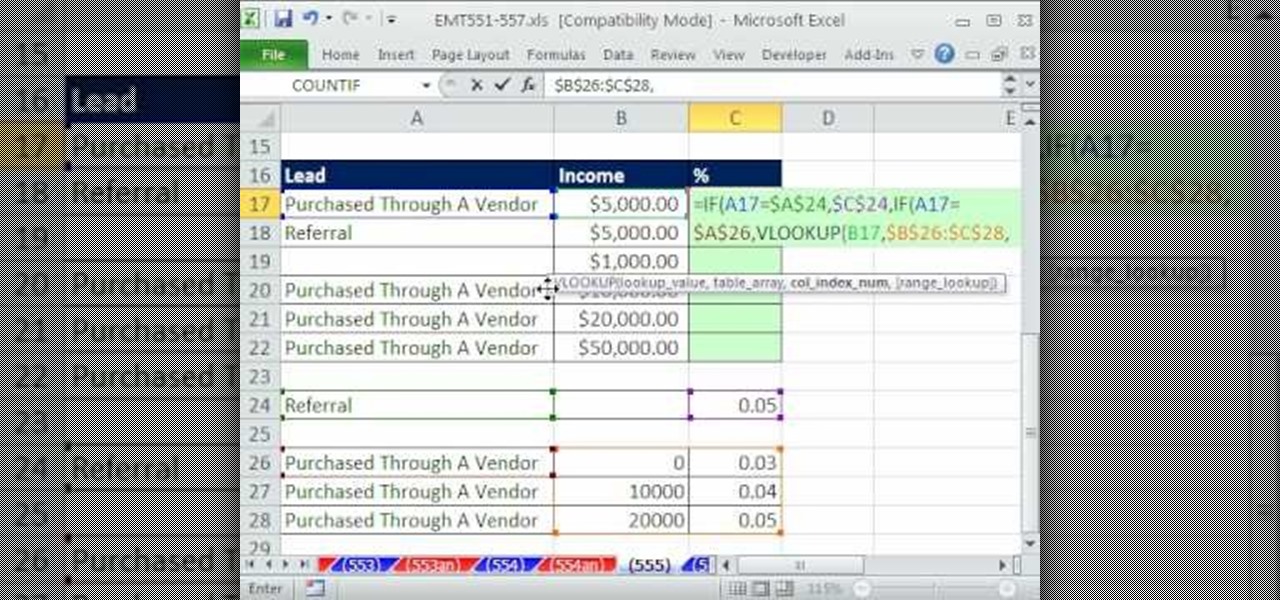
New to Microsoft Excel? Looking for a tip? How about a tip so mind-blowingly useful as to qualify as a magic trick? You're in luck. In this MS Excel tutorial from ExcelIsFun, the 555th installment in their series of digital spreadsheet magic tricks, you'll learn how to use the IF and VLOOKUP functions to make one of two types of commission calculations based on what is put in the referral column.

New to Microsoft Excel? Looking for a tip? How about a tip so mind-blowingly useful as to qualify as a magic trick? You're in luck. In this MS Excel tutorial from ExcelIsFun, the 258th installment in their series of digital spreadsheet magic tricks, you'll learn how to make charts from noncontiguous data in MS Excel.

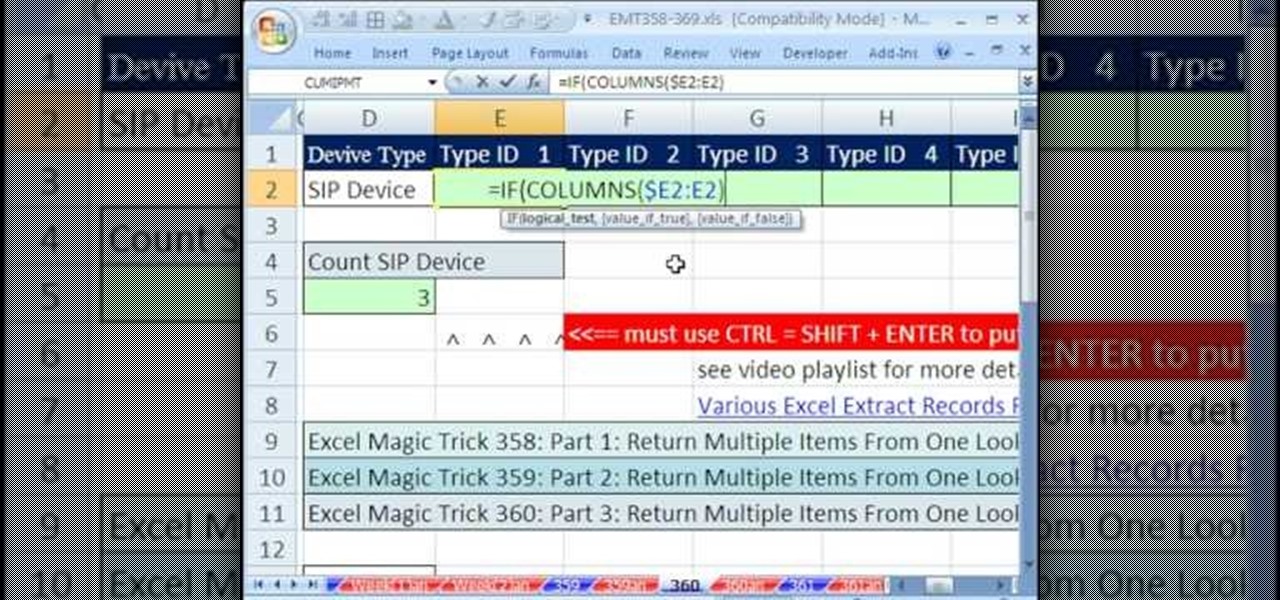
New to Microsoft Excel? Looking for a tip? How about a tip so mind-blowingly useful as to qualify as a magic trick? You're in luck. In this MS Excel tutorial from ExcelIsFun, the 360th installment in their series of digital spreadsheet magic tricks, you'll see an array formula that looks up one value and returns multiple items.

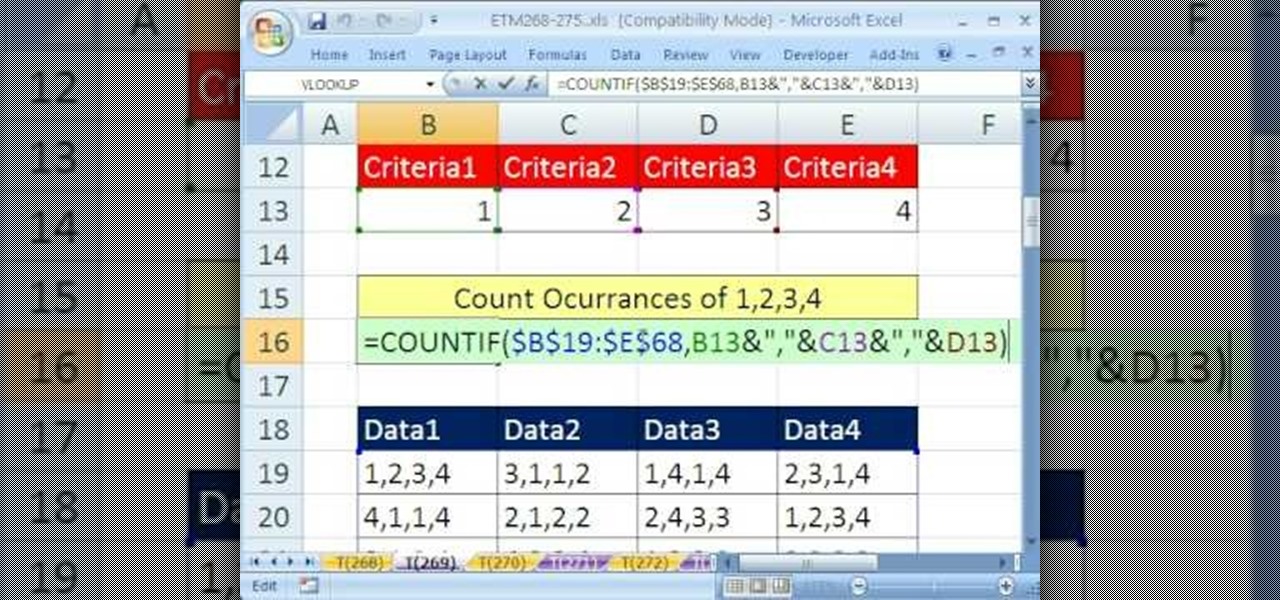
New to Microsoft Excel? Looking for a tip? How about a tip so mind-blowingly useful as to qualify as a magic trick? You're in luck. In this MS Excel tutorial from ExcelIsFun, the 269th installment in their series of digital spreadsheet magic tricks, you'll learn how to get criteria from four (4) different cells and combine (join) them into one criterion for the COUNTIF function.

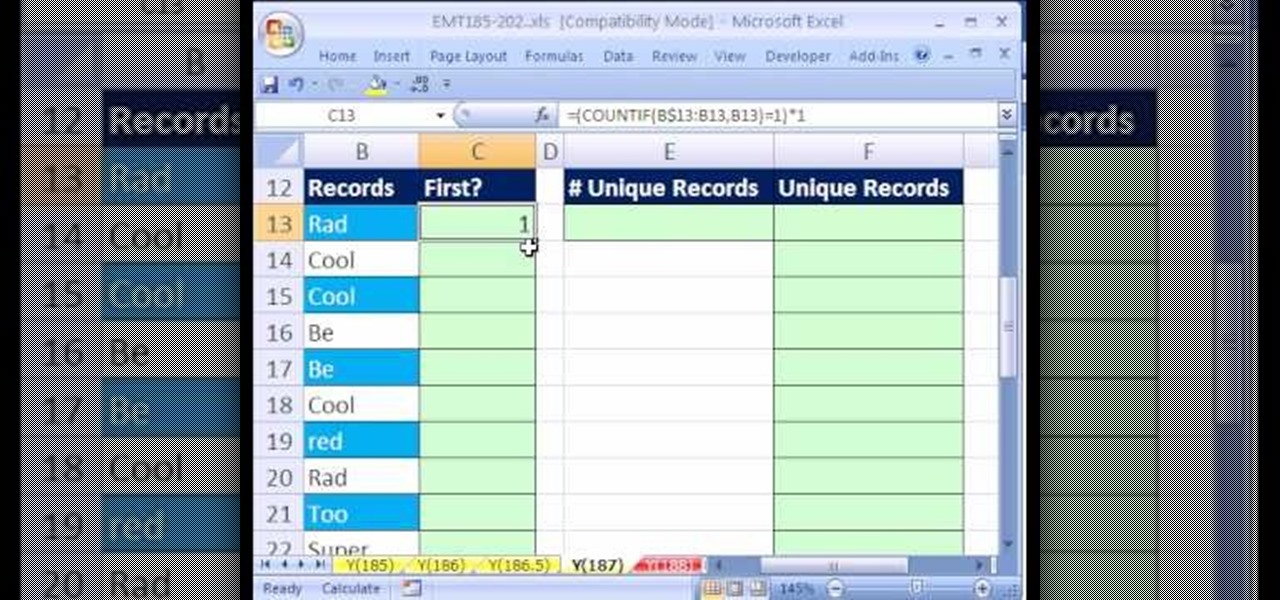
New to Microsoft Excel? Looking for a tip? How about a tip so mind-blowingly useful as to qualify as a magic trick? You're in luck. In this MS Excel tutorial from ExcelIsFun, the 187th installment in their series of digital spreadsheet magic tricks, you'll learn two different array formula types for creating a unique list of items for a large list containing duplicates.

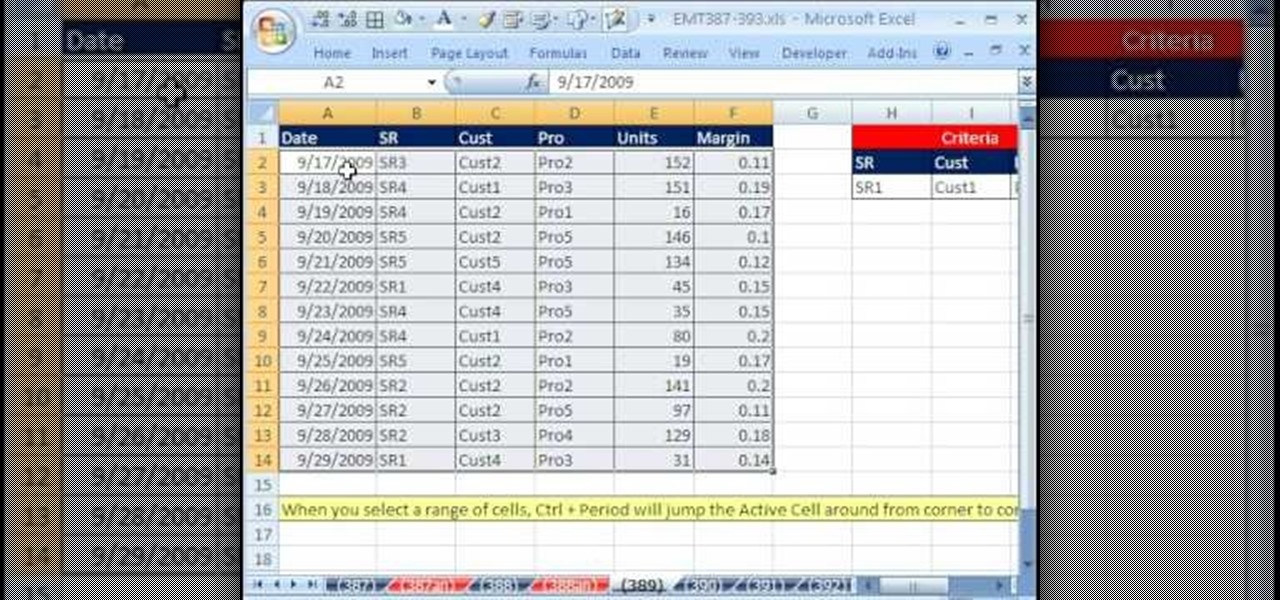
New to Microsoft Excel? Looking for a tip? How about a tip so mind-blowingly useful as to qualify as a magic trick? You're in luck. In this MS Excel tutorial from ExcelIsFun, the 389th installment in their series of digital spreadsheet magic tricks, you'll learn how to use a ctrl-period keyboard shortcut to quickly move the active cell in a selected range.

New to Microsoft Excel? Looking for a tip? How about a tip so mind-blowingly useful as to qualify as a magic trick? You're in luck. In this MS Excel tutorial from ExcelIsFun, the 384th installment in their series of digital spreadsheet magic tricks, you'll learn how to use an easy go-to/enter keyboard shortcut trip that will allow you to highlight 1000 (100x100) cells.

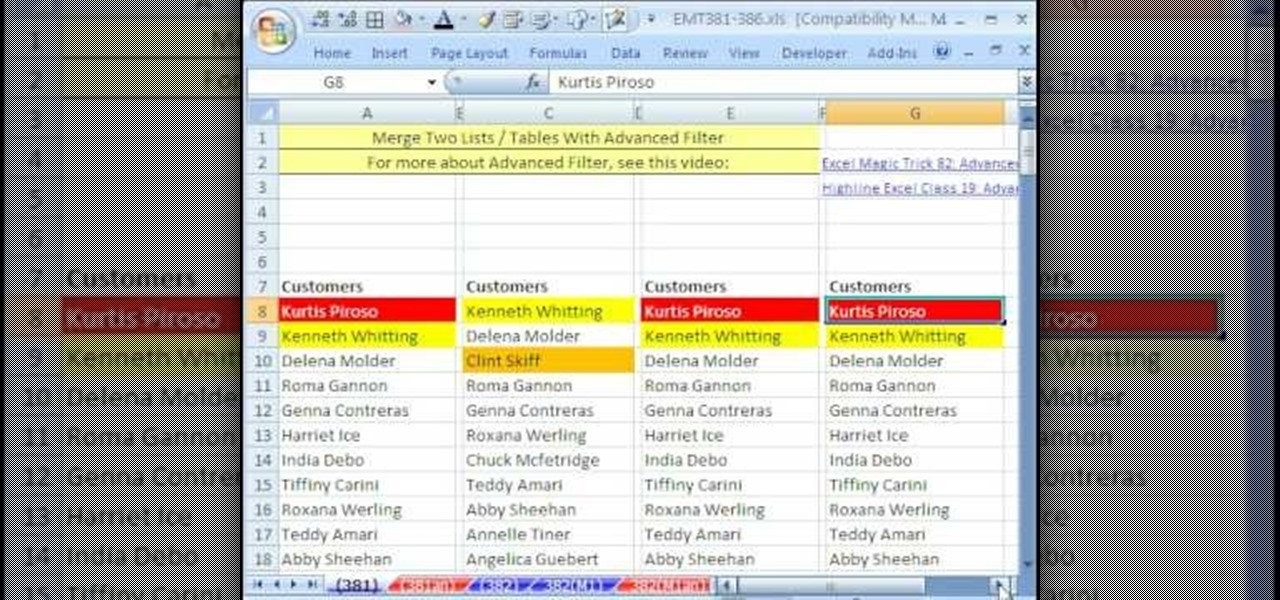
New to Microsoft Excel? Looking for a tip? How about a tip so mind-blowingly useful as to qualify as a magic trick? You're in luck. In this MS Excel tutorial from ExcelIsFun, the 381st installment in their series of digital spreadsheet magic tricks, you'll learn how to merge two lists into one list while keeping unique items from list 1 and list 2 and removing duplicates.

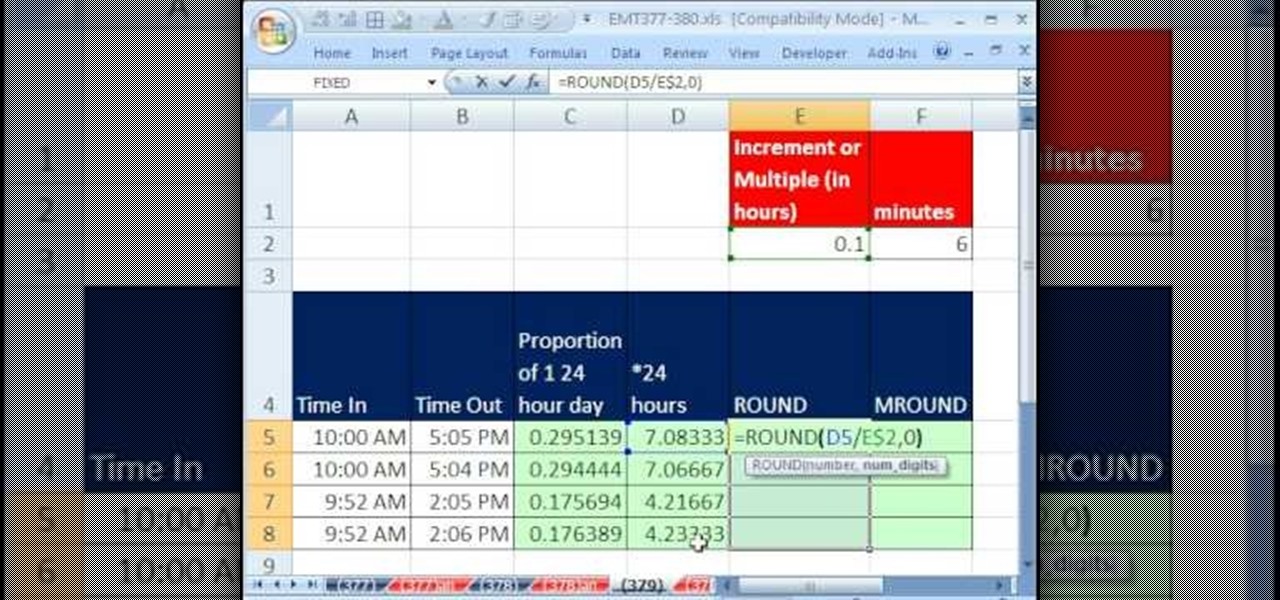
New to Microsoft Excel? Looking for a tip? How about a tip so mind-blowingly useful as to qualify as a magic trick? You're in luck. In this MS Excel tutorial from ExcelIsFun, the 379th installment in their series of digital spreadsheet magic tricks, you'll learn how to round hours worked to the 1/10th of an hour using ROUND and MROUND functions.

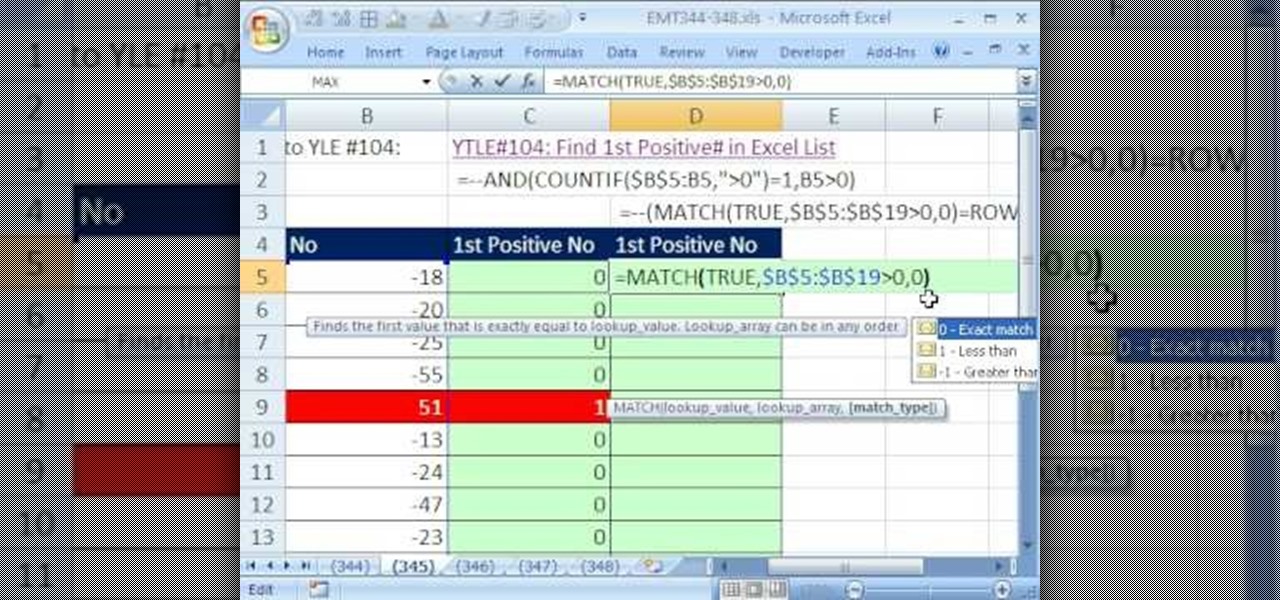
New to Microsoft Excel? Looking for a tip? How about a tip so mind-blowingly useful as to qualify as a magic trick? You're in luck. In this MS Excel tutorial from ExcelIsFun, the 345th installment in their series of digital spreadsheet magic tricks, you'll learn how to locate the first positive number in a list and assign it the number 1.

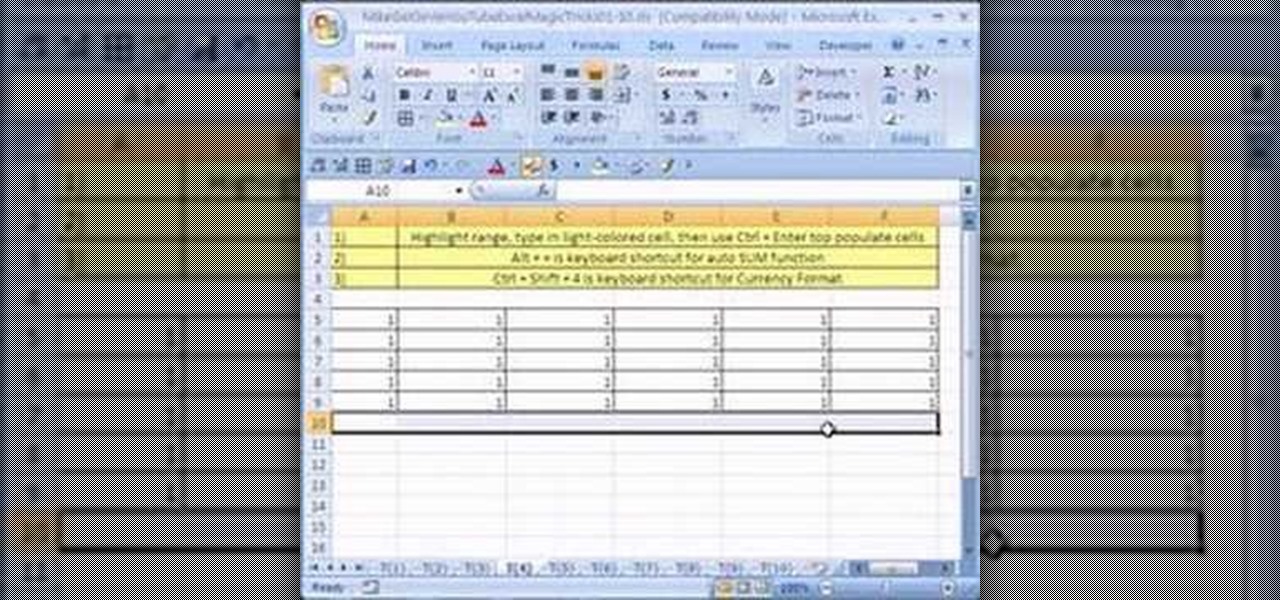
New to Microsoft Excel? Looking for a tip? How about a tip so mind-blowingly useful as to qualify as a magic trick? You're in luck. In this MS Excel tutorial from ExcelIsFun, the 4th installment in their series of digital spreadsheet magic tricks, you'll learn how to add data or a formula to a range of cells by using the Excel's ever-useful ctrl+enter keyboard shortcut.

New to Microsoft Excel? Looking for a tip? How about a tip so mind-blowingly useful as to qualify as a magic trick? You're in luck. In this MS Excel tutorial from ExcelIsFun, the 8th installment in their series of digital spreadsheet magic tricks, you'll learn how to take a column of text and break it apart into separate columns using Excel's text-to-column tool.

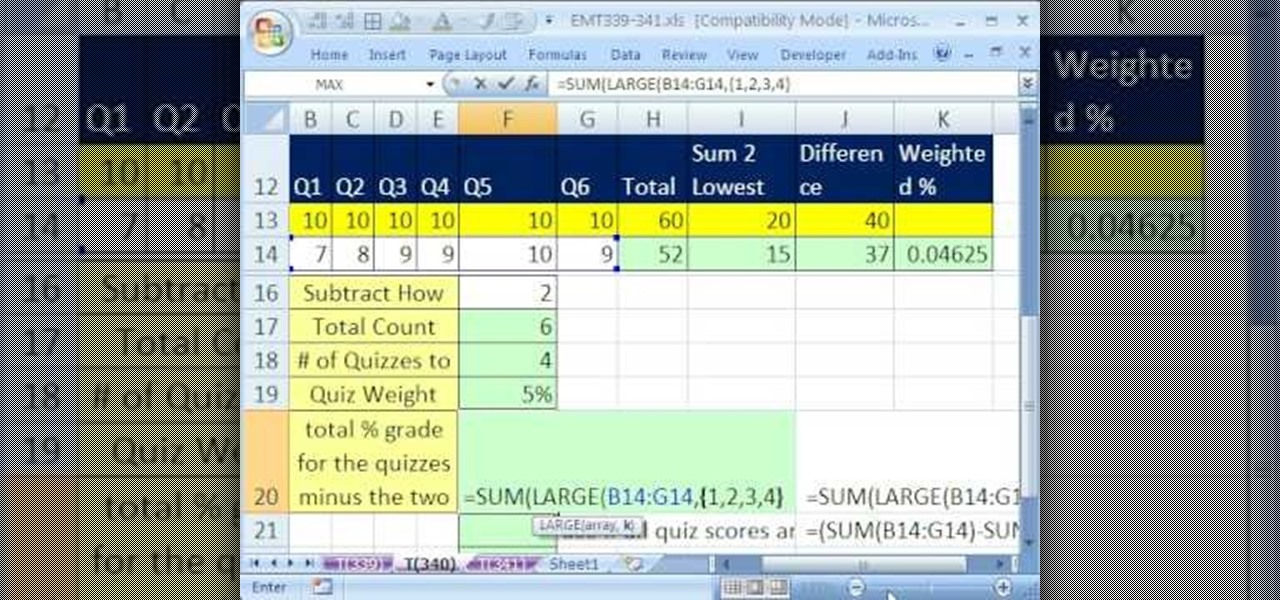
New to Microsoft Excel? Looking for a tip? How about a tip so mind-blowingly useful as to qualify as a magic trick? You're in luck. In this MS Excel tutorial from ExcelIsFun, the 340th installment in their series of digital spreadsheet magic tricks, you'll learn how to use the SMALL and LARGE functions and array syntax to retrieve more than one value.

New to Microsoft Excel? Looking for a tip? How about a tip so mind-blowingly useful as to qualify as a magic trick? You're in luck. In this MS Excel tutorial from ExcelIsFun, the 2nd installment in their series of digital spreadsheet magic tricks, you'll learn how to create charts via keyboard shortcut as well as how to create dynamic charts with cell references.

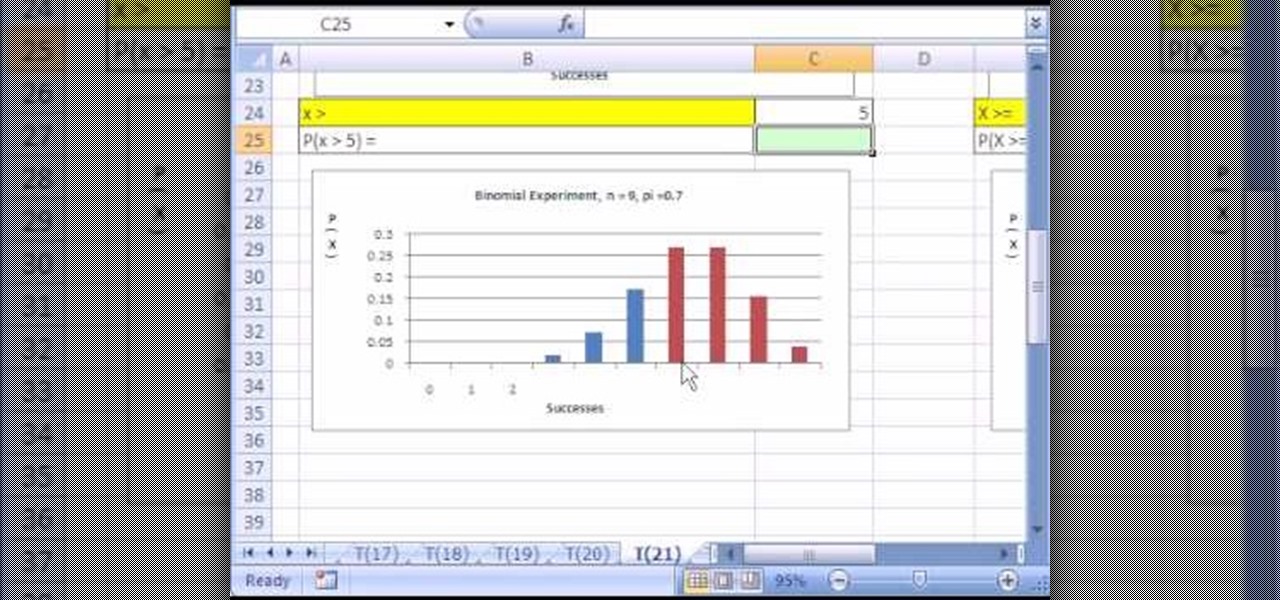
New to Microsoft Excel? Looking for a tip? How about a tip so mind-blowingly useful as to qualify as a magic trick? You're in luck. In this MS Excel tutorial from ExcelIsFun, the 21st installment in their series of digital spreadsheet magic tricks, you'll learn how to use the BINOMDIST function to calculate probabilities for a binomial experiment - binomial distribution!

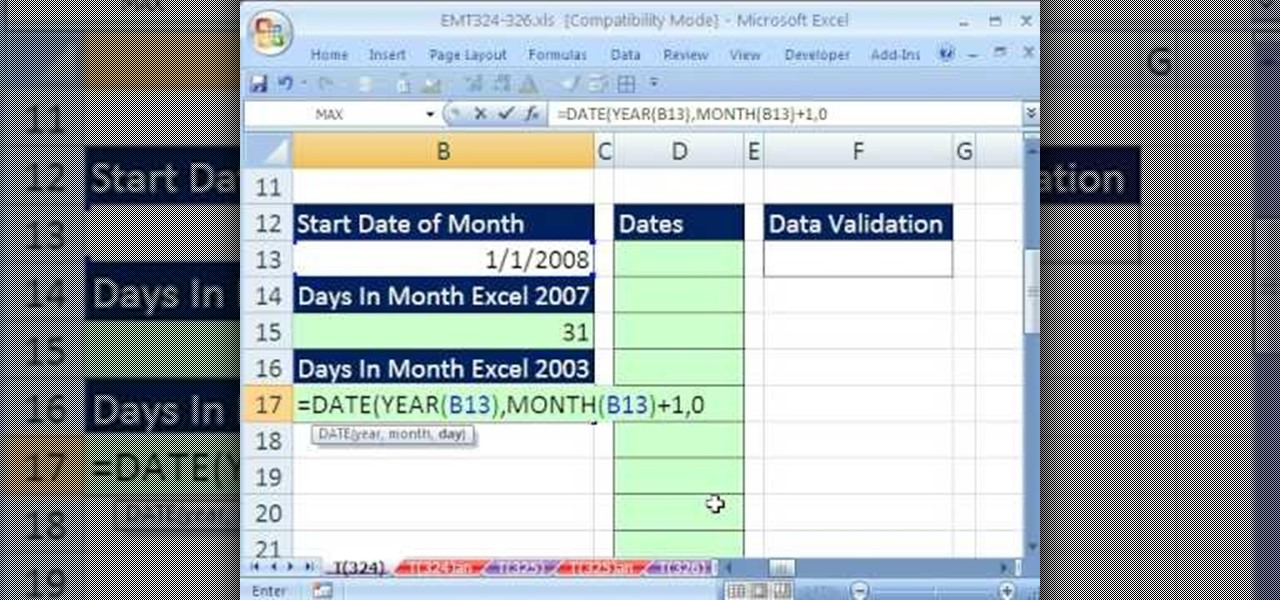
New to Microsoft Excel? Looking for a tip? How about a tip so mind-blowingly useful as to qualify as a magic trick? You're in luck. In this MS Excel tutorial from ExcelIsFun, the 324th installment in their series of digital spreadsheet magic tricks, you'll learn how to create a dynamic list of dates for a data validation drop-down list.

New to Microsoft Excel? Looking for a tip? How about a tip so mind-blowingly useful as to qualify as a magic trick? You're in luck. In this MS Excel tutorial from ExcelIsFun, the 322nd installment in their series of digital spreadsheet magic tricks, you'll learn how to create an advanced filter to extract with AND and NOT criteria.

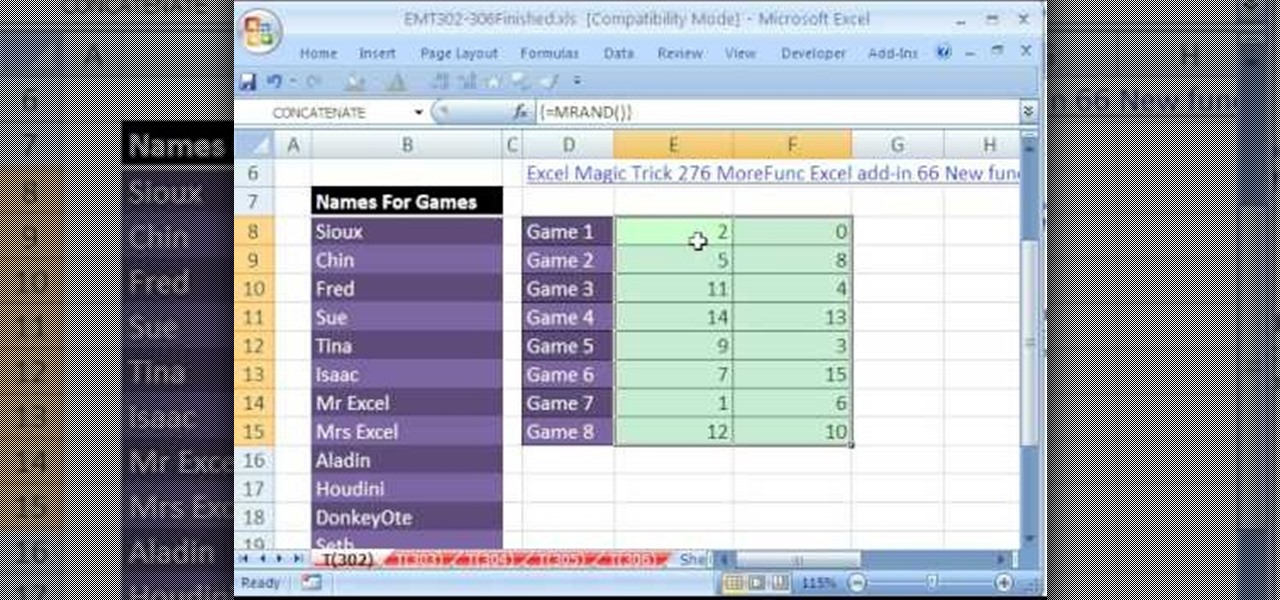
New to Microsoft Excel? Looking for a tip? How about a tip so mind-blowingly useful as to qualify as a magic trick? You're in luck. In this MS Excel tutorial from ExcelIsFun, the 302nd installment in their series of digital spreadsheet magic tricks, you'll learn how to use the INDEX & MRAND functions to randomly select names without repeats.


