If you use Microsoft Excel on a regular basis, odds are you work with numbers. Put those numbers to work. Statistical analysis allows you to find patterns, trends and probabilities within your data. In this MS Excel tutorial from everyone's favorite Excel guru, YouTube's ExcelsFun, the 25th installment in his "Excel Statistics" series of free video lessons, you'll learn how to create quantitative data percent & relative frequency distributions with pivot tables. Also see how to create a histo...

If you use Microsoft Excel on a regular basis, odds are you work with numbers. Put those numbers to work. Statistical analysis allows you to find patterns, trends and probabilities within your data. In this MS Excel tutorial from everyone's favorite Excel guru, YouTube's ExcelsFun, the 22nd installment in his "Excel Statistics" series of free video lessons, you'll learn how to create a percent (%) cumulative frequency distribution with formulas, a histogram and an ogive chart. See how to add ...
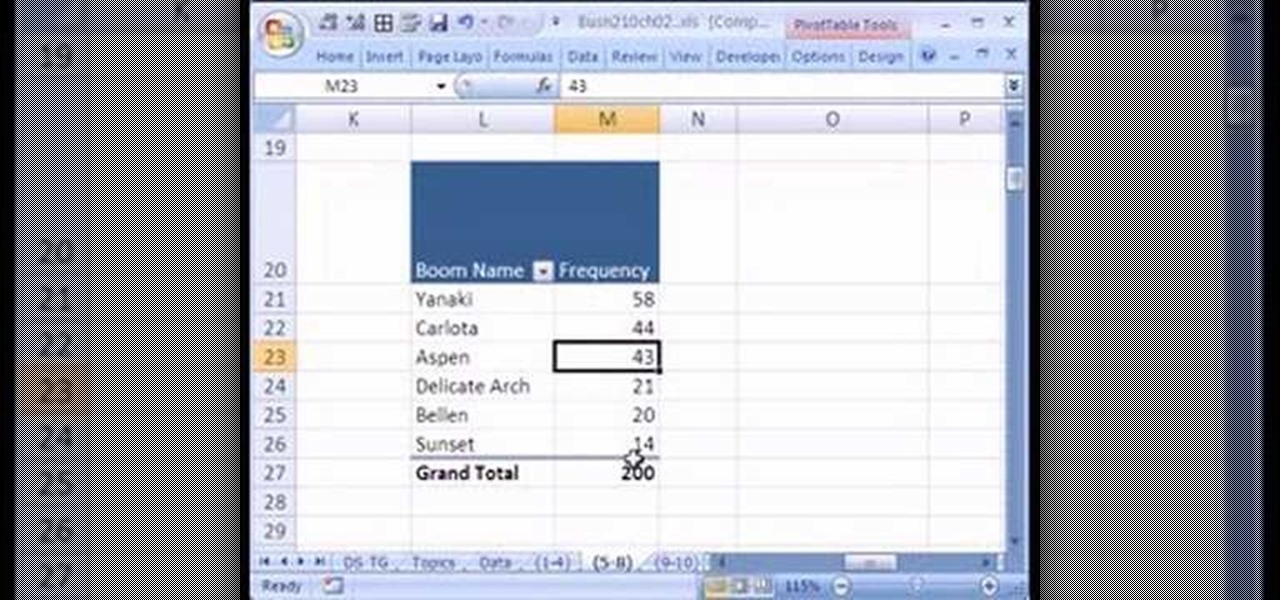
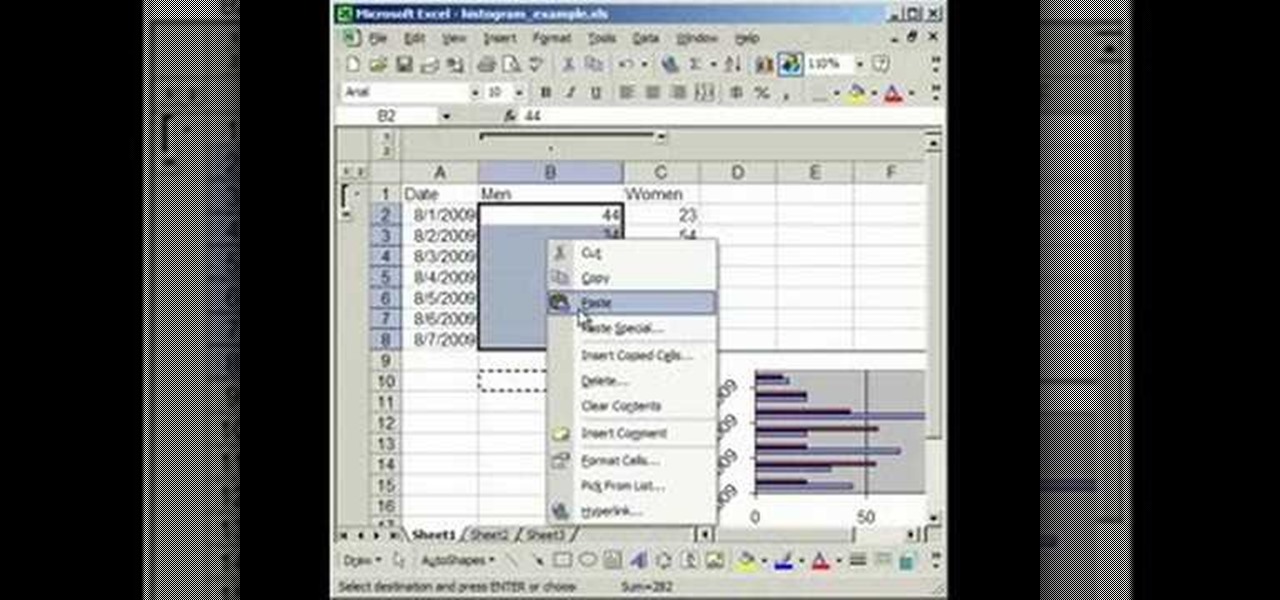
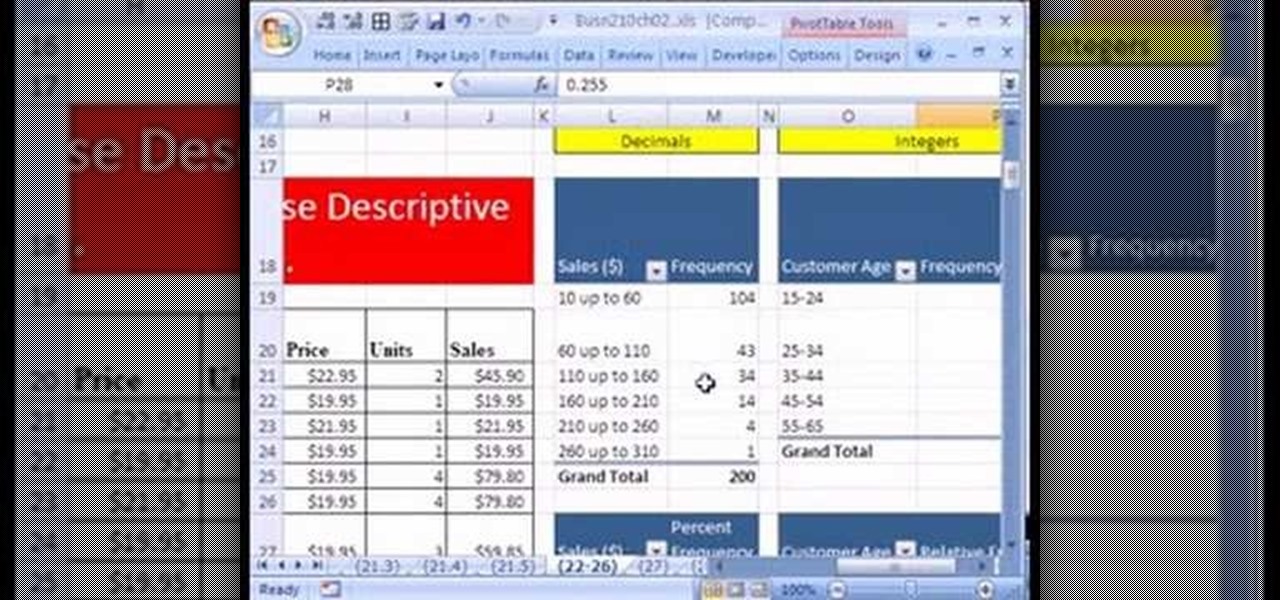
If you use Microsoft Excel on a regular basis, odds are you work with numbers. Put those numbers to work. Statistical analysis allows you to find patterns, trends and probabilities within your data. In this MS Excel tutorial from everyone's favorite Excel guru, YouTube's ExcelsFun, the 15th installment in his "Excel Statistics" series of free video lessons, you'll learn how to use create a frequency distribution, relative frequency distribution, percent frequency distribution and pie chart wi...

New to Microsoft Excel? Looking for a tip? How about a tip so mind-blowingly useful as to qualify as a magic trick? You're in luck. In this MS Excel tutorial from ExcelIsFun, the 351st installment in their series of digital spreadsheet magic tricks, you'll learn how to create an area chart for x and f(x) data as well as how to use the IF function to show a second data set plotted to show a specific area section.
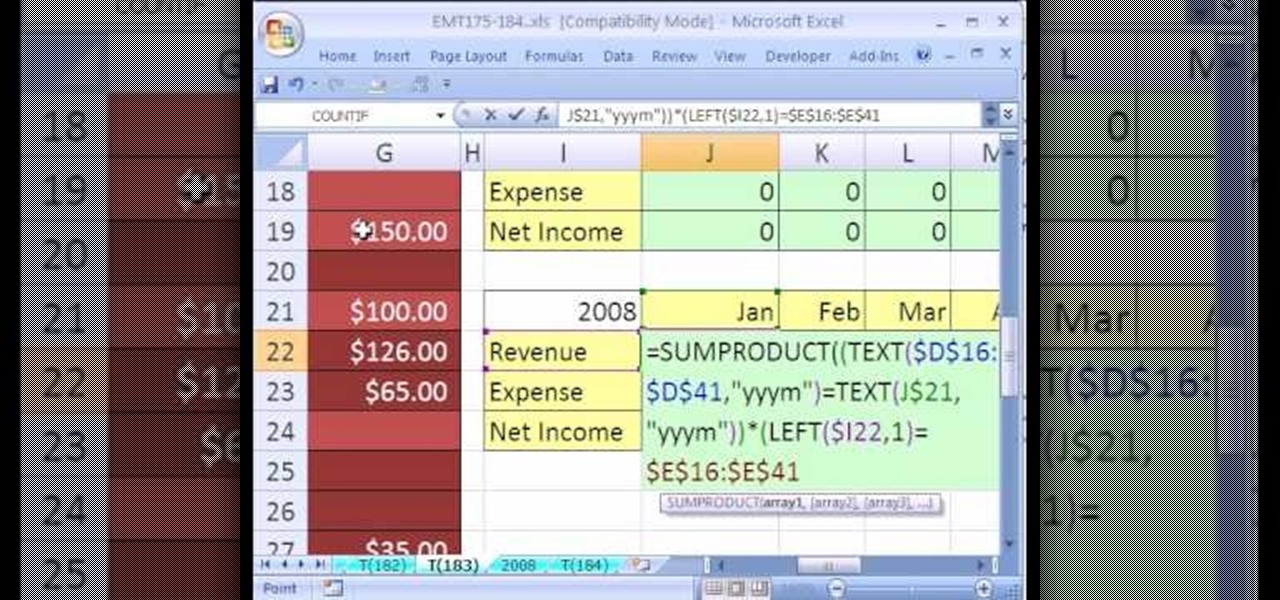
New to Microsoft Excel? Looking for a tip? How about a tip so mind-blowingly useful as to qualify as a magic trick? You're in luck. In this MS Excel tutorial from ExcelIsFun, the 183rd installment in their series of digital spreadsheet magic tricks, you'll learn how to sum revenue from a table of data by year and month using the SUMPRODUCT, TEXT, SUM, IF & LEFT functions in an array formula.
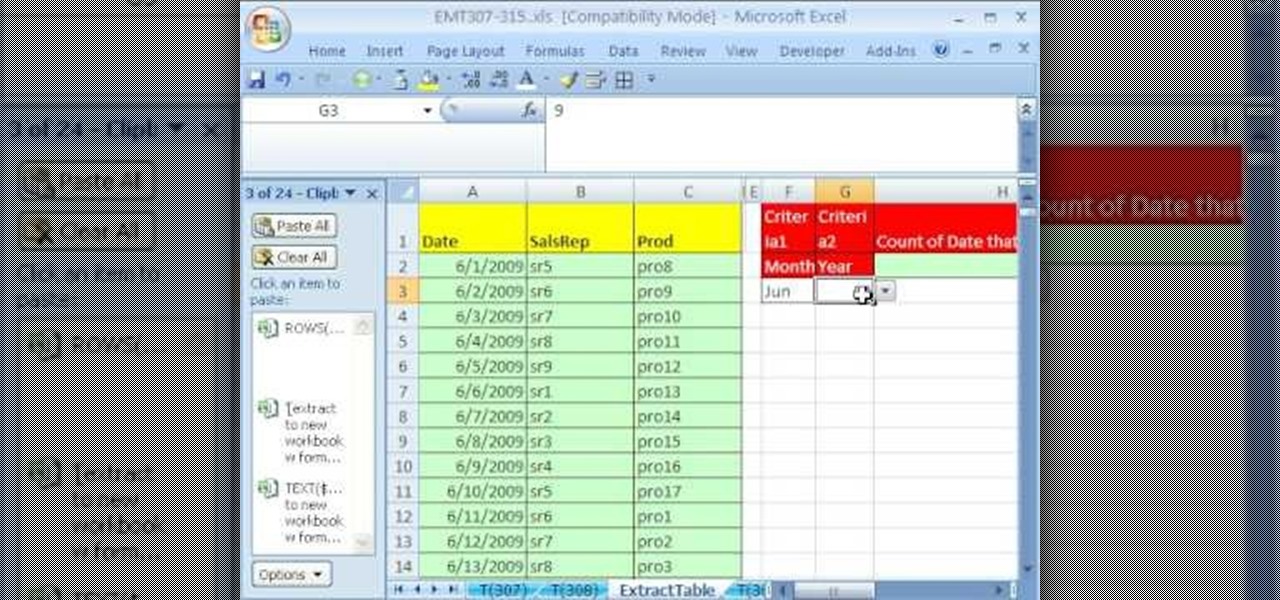
New to Excel? Looking for a tip? How about a tip so mind-blowingly useful as to qualify as a magic trick? You're in luck. With this video tutorial from ExcelIsFun, the 308th installment in their series of digital spreadsheet video tutorials, you'll learn how to extract data to a new workbook by array formula. Functions used include IF, ROWS, INDEX, TEXT, ROW and SUMPRODUCT.

In this video tutorial, Chris Pels shows how to create a custom profile provider to store and retrieve data associated with a user profile in SQL Server tables separate from the standard ASP.NET membership provider’s aspnet_Profile table. The principles covered in this video will apply to creating profile providers for other databases like Access and Oracle. After learning how to create the custom profile provider we learn how to install the provider in a web site and see a demonstration of l...
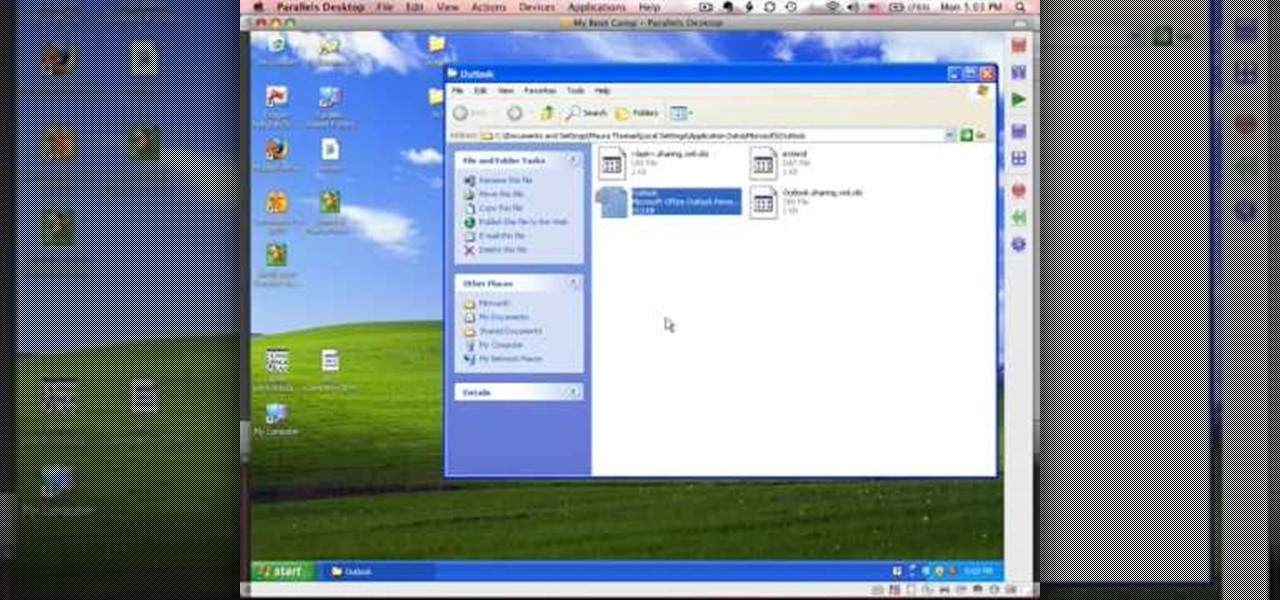
This tutorial describes how to backup the PST file of Outlook.
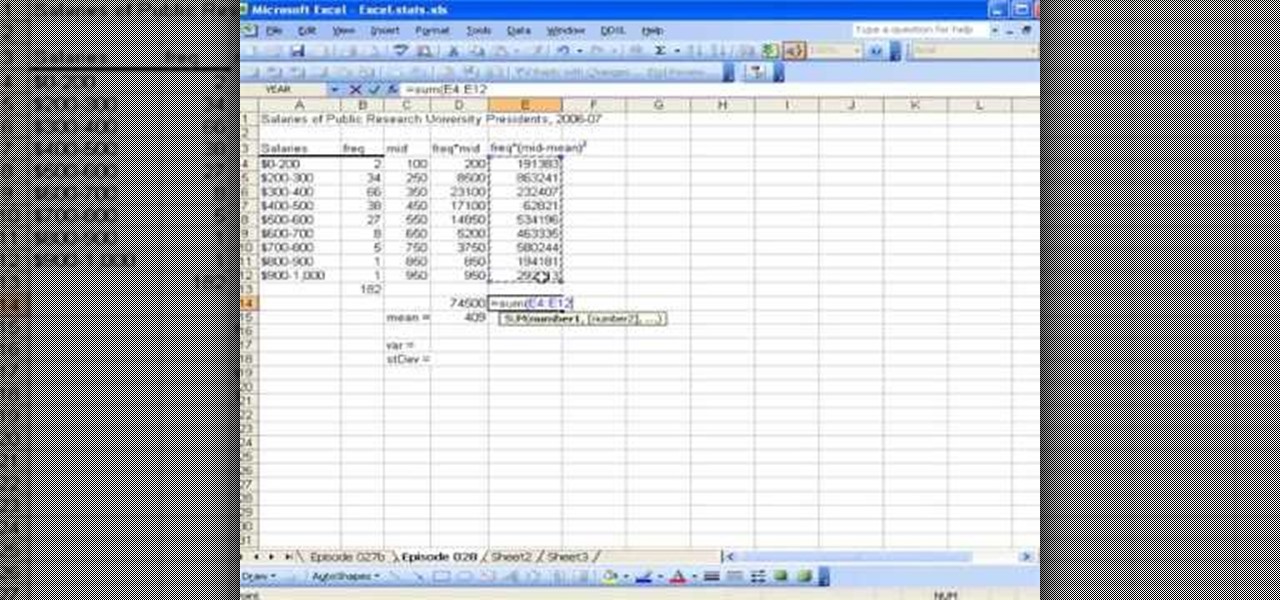
This video shows the method to find the variance and standard deviation using Excel. The variance shows the variability of the data points from the median. We find the difference of the median and the mean. We write the formula using '=' sign. The median and data points are put in it by selecting the appropriate cell. The median is made an absolute constant by pressing the F4 key. This is squared by using '^2'. This is multiplied to the frequency using '*'. The result is found for all the dat...
Simple steps on how to clear your cache on Firefox and Google Chrome. Clear Cache on Firefox:
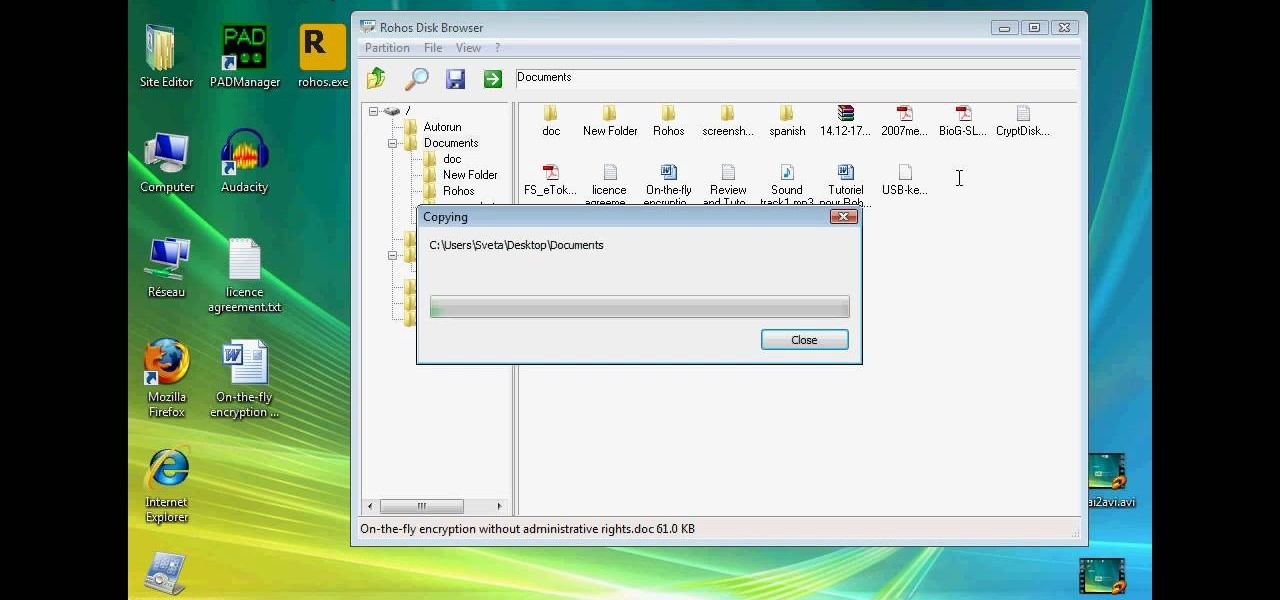
This technical video will show you all about the Rohos Mini Drive. See how you may work with an encrypted partition on a PC without admin rights using this free portable encryption solution. It securely protects your portable data on any USB device. Portable utility Rohos Disk Browser gives you opportunity to work with your sensitive data on a USB drive in the usual way on any PC (even at an internet cafe, where you don’t have admin rights).
Okay, so you might not need a how-to for this one, but nonetheless, just in case, here you go— plugging in the data cable to your Samsung Galaxy Tab. It's basically the same way you plug in all mobile devices these days, and it's just like any other Android tablet, so you should be able to do it with little difficulty. Just don't force it in, or you risk damaging it and your device.
In this tutorial, we learn how to use Eraser to permanently erase data. First, open up Internet Explorer and search for "eraser". Once you do this, click on the first link that you see. Then, go to the download section of the website and download the first version that you see, it will be the newer version. Choose the bit processor that you have, then wait for it to download on your computer. Now install it and go to your Start menu to find the application. After this, open up the Eraser, the...
A non-CPU lens is one which does not have contacts on the rear mount, meaning it communicates with the rest of the camera solely through the aperture. This tutorial shows you how to set up the lens data for your camera, so you can get the most out of your non-CPU lens.
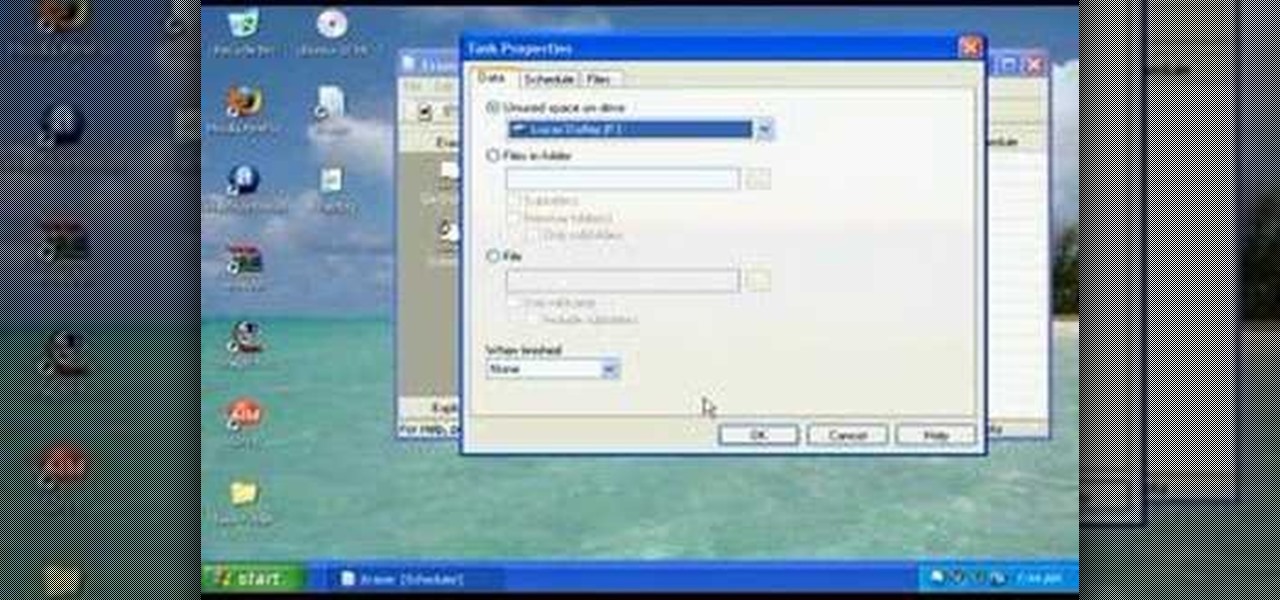
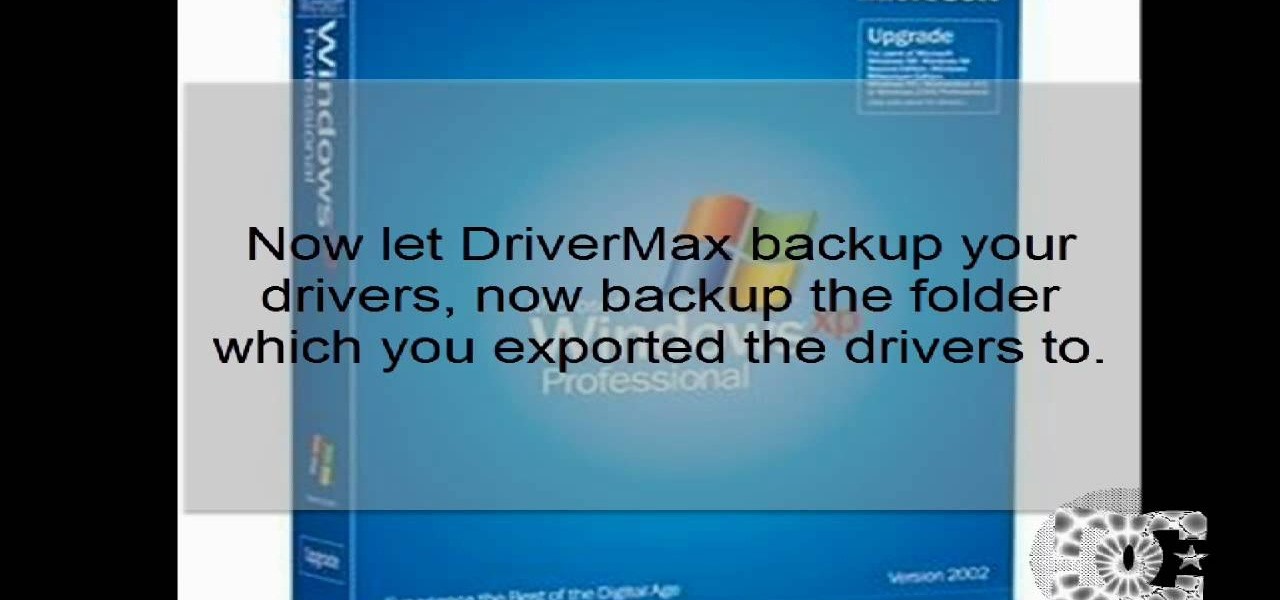
This video demonstrates how to reformat a hard drive and perform a clean installation of Windows XP operating system. The tutor first advises to make a back up of everything, including the drivers and my folders. He explains various methods by which one can take the backup of the data in a system. Now he shows how to format the C drive where you can now install Windows. He also shows software that is used to take the backup of important data before formatting. This video shows how to reformat...
Learn how to set up Internet on iPhone clones with this video. *First thing you need to do is to make an AT&T GPRS data account.
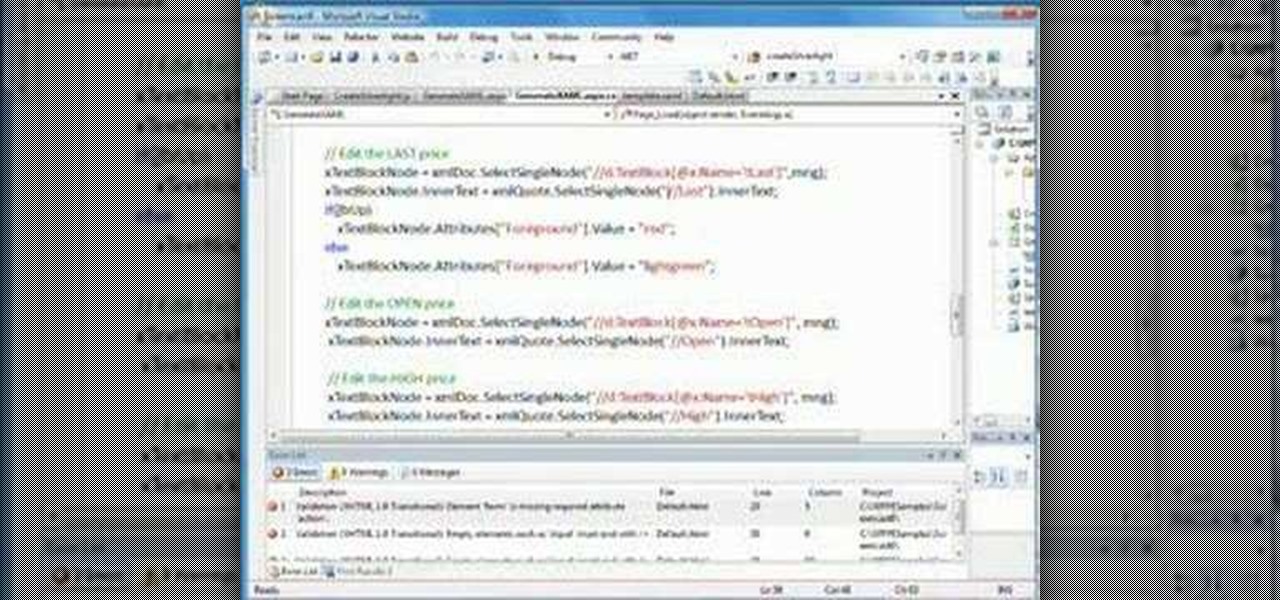
In this Silverlight web application tutorial you will learn how to create a basic stock quote application that updates in Realtime. You can apply this ASP.Net backend application to any realtime data update application you need to make. All you need is Silverlight to get you started.
If you've ever entered a lot of data into an Excel spreadsheet before, then you know that putting together even one spreadsheet is a pain in the butt. So if you are required to place all the data on one spreadsheet onto another spreadsheet, don't slave away for hours copying and pasting.
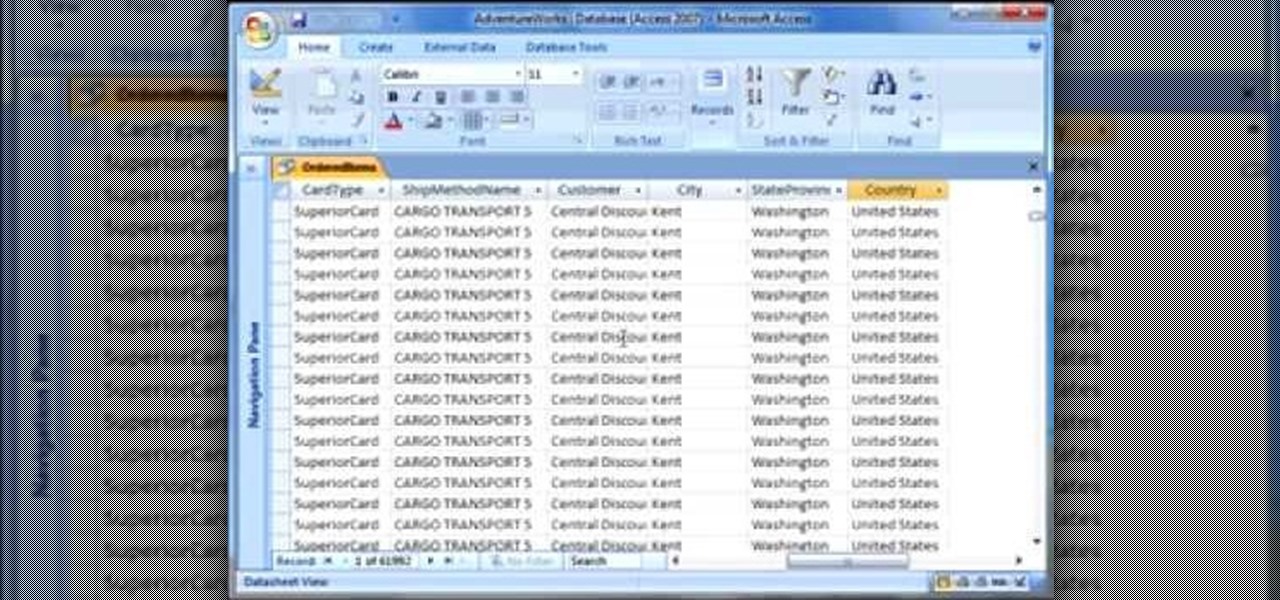
This screencast tutorial from Matthew MacDonald, author of Access 2007: The Missing Manual, shows you how to use pivot tables to analyze data in Microsoft Access 2007.
Are you 100% sure that all of your data is gone? Use Darik's Boot and Nuke to completely wipe a hard disk of all data.
This video shows you how to use Windows Task Manager to restart your computer without losing any data.
In this tutorial, we learn how to make a histogram chart in Excel. To create a vertical histogram, you will enter in data to the chart. Then, highlight all of the data and go to "insert", "chart", then choose a regular column chart. Grab a regular 2D column and then make sure your values are correct. Then, right click and go to "chart options", then take the legend off. Now, make these columns all touch each other by right clicking over the columns and formatting them. Go to "options" then ch...
In this video, we learn how to clear Firefox location bar and browsing history. To get rid of an individual one, use your keyboard to go to the one you don't want. Then, press shift+delete and that one will be deleted. To remove them all, go to tools then click on "clear private data". Check the box of the browsing history, then click on the button to clear all the data. If you still have items in the list on your browser, then that means you have those websites bookmarked. To remove those, y...
In this video, we learn how to clear browsing history and cache in Firefox and Internet Explorer. First, while in Firefox, go to the tools menu, then click on clear private data. In the new window, click on the items that you want to have cleared, then click "clear private data now". After this, the computer will clear out all the internet files. Next, while you're in Internet Explorer, go to the tools menu, then click on "internet options". Once in here, click the appropriate sections to cle...
In this video, we learn how to quickly copy and paste data in Microsoft Excel. First, if you have two columns that you want to add up, you will highlight the columns and then copy and paste them into the other cells. Another way is to select the cell and go to the bottom right hand corner, then drag it down. This will fill your formula in to every cell below it! This will save you a lot of time instead of having to type in formulas for the columns that you are trying to do equations with! Thi...
In order to format graphs and charts using Microsoft Word 2007, click on Chart Tools. The tabs at the top of the screen provides you with your options. You can change the type of chart or graph by clicking on Change Chart Type. If there is a particular type of chart that you would like to use again and again, then you can save it as a template via the Save As a Template icon. You can edit the data in your chart of graph by clicking on Edit Data. You can modify the chart layout by clicking on ...
New to Microsoft Excel? Looking for a tip? How about a tip so mind-blowingly useful as to qualify as a magic trick? You're in luck. In this MS Excel tutorial from ExcelIsFun, the 637th installment in their series of digital spreadsheet magic tricks, you'll learn how to create a dynamic two data series line chart for blood pressures — how to look up a chart using defined names, a data validation list, and a formula using the INDIRECT function inside a picture of a chart.
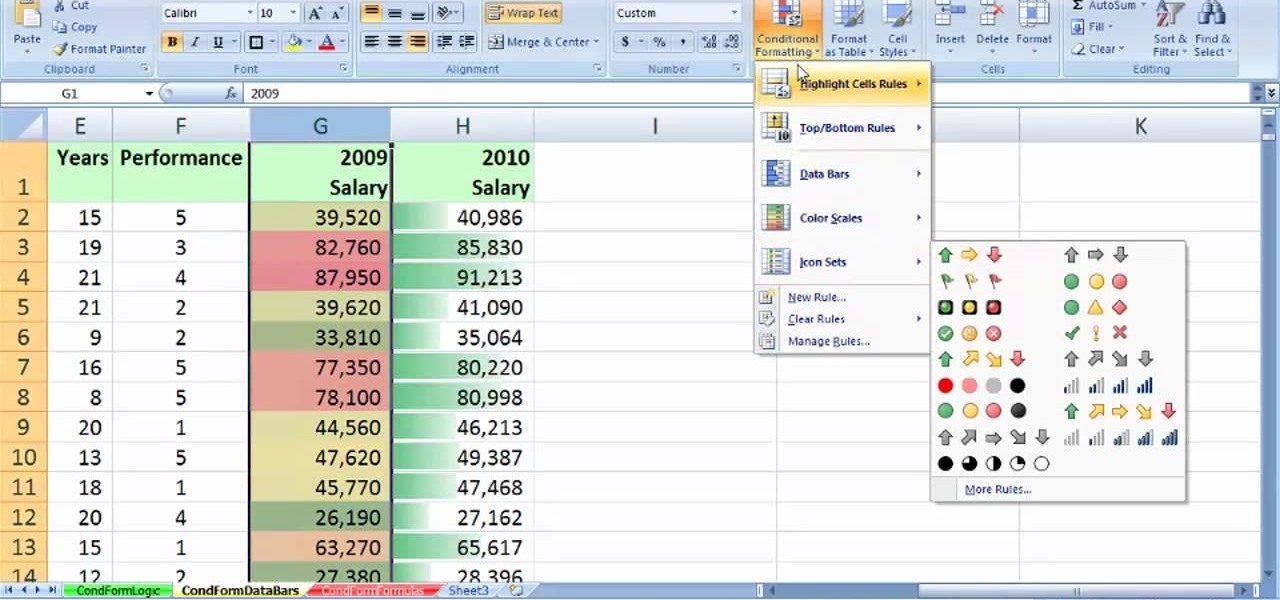
See how to create value-based formatting using data bars and color scales in Excel 2007. See how to use the Format Cells dialog box and the pop-up mini-toolbar in Microsoft Excel 2007. Whether you're new to Microsoft's popular digital spreadsheet application or a seasoned business professional just looking to better acquaint yourself with this particular iteration of the program, you're sure to be well served by this video tutorial. For more information, including step-by-step instructions, w...
New to Microsoft Excel? Looking for a tip? How about a tip so mind-blowingly useful as to qualify as a magic trick? You're in luck. In this MS Excel tutorial from ExcelIsFun and Mr. Excel, the 20th installment in their joint series of digital spreadsheet magic tricks, you'll learn how to summarize survey data with a pivot table (grouping & report filter), COUNTIFS function (4 criteria), SUMPRODUCTS formula, SUMPRODUCTS & TEXT functions and DCOUNT database function.
New to Microsoft Excel? Looking for a tip? How about a tip so mind-blowingly useful as to qualify as a magic trick? You're in luck. In this MS Excel tutorial from ExcelIsFun and Mr. Excel, the 5th installment in their joint series of digital spreadsheet magic tricks, you'll learn how to create horizontal subtotals for a data set using the IF, SUM and SUMIF functions. Also see conditional formatting for non-contiguous cell ranges using a TRUE/FALSE logical formula with the NOT symbols.
Whether you're interested in learning Microsoft Excel from the bottom up or just looking to pick up a few tips and tricks, you're in the right place. In this tutorial from everyone's favorite digital spreadsheet guru, ExcelIsFun, the 21st installment in his "Highline Excel Class" series of free video Excel lessons, you'll learn how to add conditional formatting to data bars and icons to show relative size, icons to show relative size, to highlight values within 1 standard deviation, to highli...
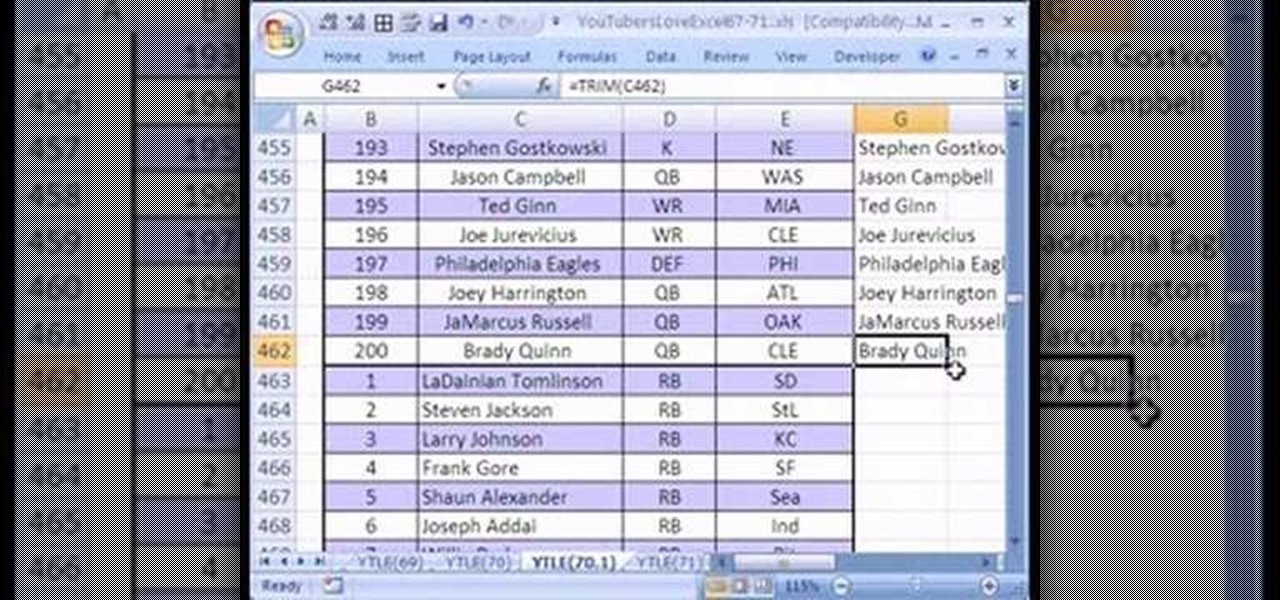
Love Microsoft Excel? This clip contains a tip that just might induce you to. With this free video tutorial from ExcelIsFun, the 70th installment of his "YouTubers Love Excel" or YTLE series of free video MS Excel lessons, you'll learn how to clean up a bad data set with the TRIM function before building a pivot table (PivotTable) to calculate an average. Learn to love digital spreadsheets more perfectly with the tricks outlined in this free Microsoft Office how-to.
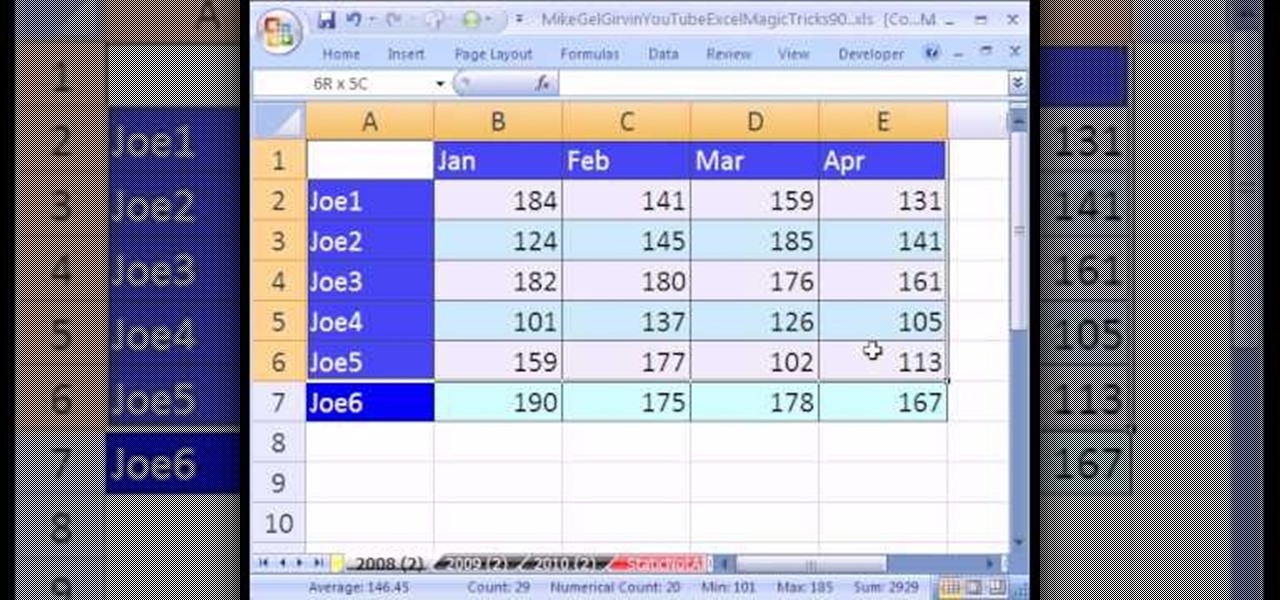
New to Microsoft Excel? Looking for a tip? How about a tip so mind-blowingly useful as to qualify as a magic trick? You're in luck. In this MS Excel tutorial from ExcelIsFun, the 90th installment in their series of digital spreadsheet magic tricks, you'll learn how to use the consolidation feature in Excel. Summarize data from a number of different tables quickly using consolidation.
New to Microsoft Excel? Looking for a tip? How about a tip so mind-blowingly useful as to qualify as a magic trick? You're in luck. In this MS Excel tutorial from ExcelIsFun, the 5th installment in their series of digital spreadsheet magic tricks, you'll learn how to name a cell range, use data validation to add a drop-down list, and how to use the VLOOKUP function to look up values.
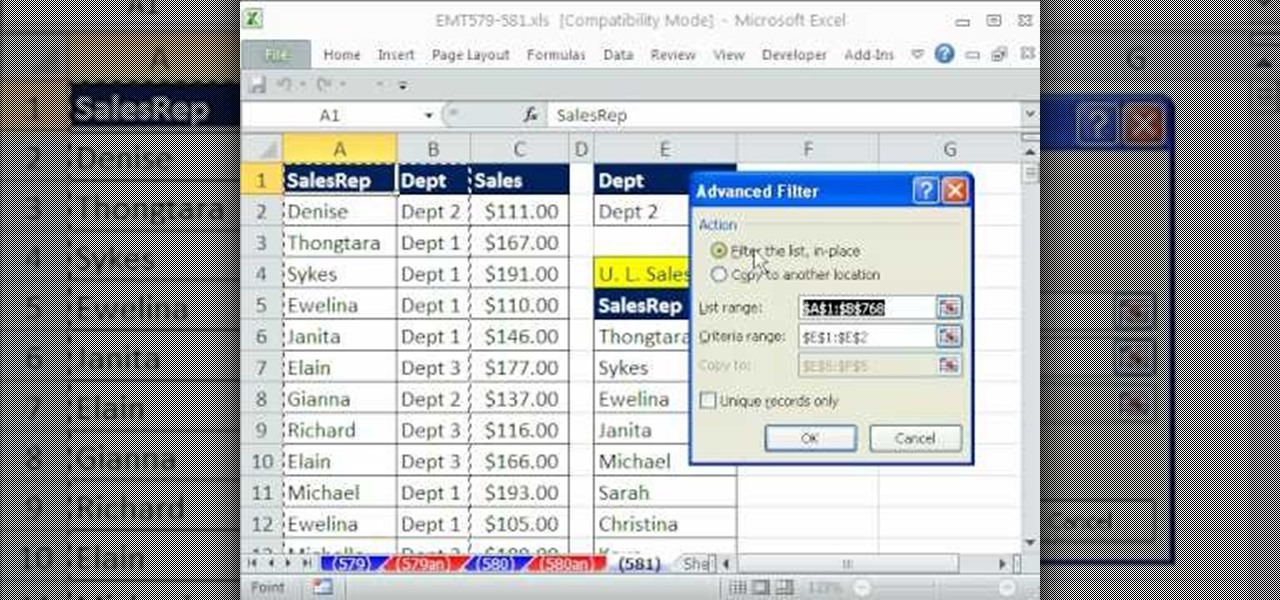
New to Microsoft Excel? Looking for a tip? How about a tip so mind-blowingly useful as to qualify as a magic trick? You're in luck. In this MS Excel tutorial from ExcelIsFun, the 581st installment in their series of digital spreadsheet magic tricks, you'll learn how to use the advanced filter tool with criteria to extract a unique list of employees for each department from a huge data set with transactional records.
Microsoft Excel is used to store and work on data by storing them in rows and columns in tables. You can use a macros to check if a cell is empty. To do this you have to know two short cuts. The first is the VBA Window short cut which is Alt + F11 and the other one is View Macros short cut which is Alt + F8. So open an Excel spread sheet and insert some data into a small table. Now create a macro for this tutorial. You can use and IsEmpty() functions to check if a cell is empty. Use this func...
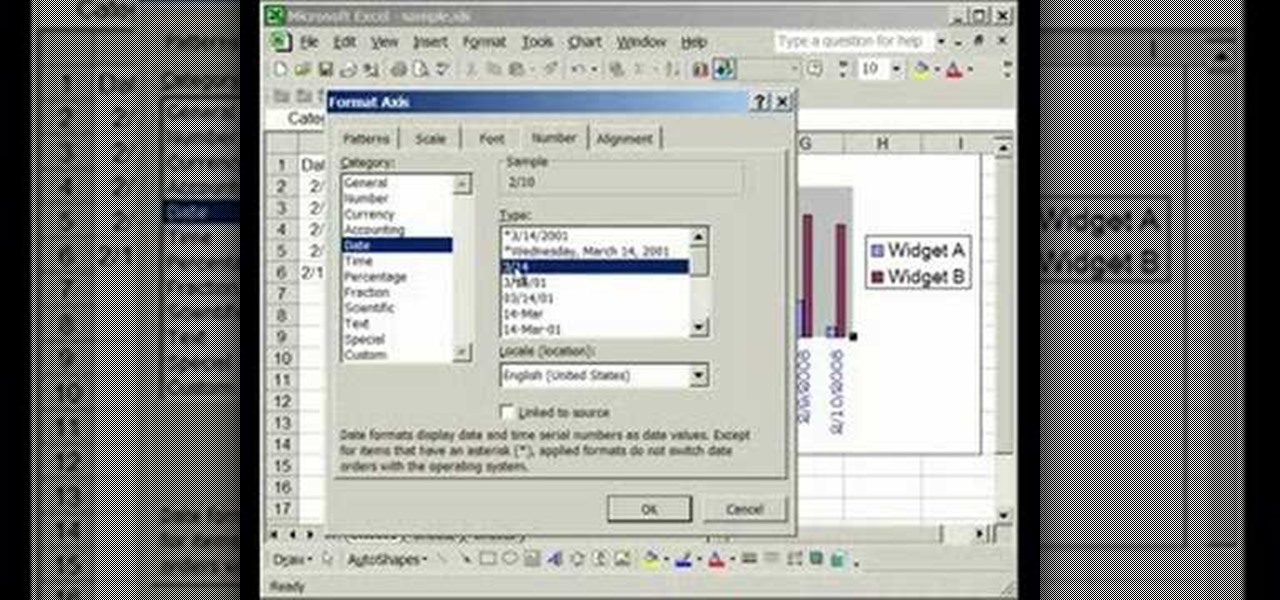
This video is about formatting the charts in Excel especially the x and y axes. The video begins by selecting a chart and right clicking the dates at the bottom of the data points. The format axis window pops up and by making changes to the style, color and the weight of lines given in the patterns tab, you can change the way the x-axis looks like. You can also change appearance of characters appearing close to the x-axis by selecting options in the font menu. You can also change the format o...
RAID, or Redundant Array of Independent Disks, lets you divide and replicate data among multiple hard disk drives for information storage security. This video tutorial demonstrates how to install Ubuntu in a RAID 0 array. Before starting, you'll need at least 2 hard drives and an Ubuntu alternate installation CD. RAID 0, or striped disks, let's you install an operating system, such as Ubuntu, on a partition, while using others for data storage, as illustrated in this instructional segment.
Open Microsoft Office Excel. Across the top notice letters (columns), along the sides are numbers (rows). The columns and rows can be extended by highlighting sections and right clicking and choosing the high of the row. You can also select to add a border, and change the orientation of your cells.