In this video tutorial, viewers learn how to reveal hidden MySpace profile content using Mozilla Firefox. Begin by clicking on View, go to Page Style and select No Style. This will take out all the styles that are applied on the page, and reveal all of it's data. Now users will be able to view the specific content on the profile page such as friends and page comments. This video will benefit those viewers who use both MySpace and Firefox Mozilla, and would like to learn how to access hidden M...

In this software video tutorial you will learn how to use Form Tracker in Adobe Acrobat 9 Pro. The forms tracker window can be opened by clicking on the 'forms' on the toolbar, or 'forms' in the menu bar or, if Acrobat is not open, by double clicking on the notification button in the tray. Here you are taken to the latest update category. On the left hand side, you will find the response file location. Check its status; whether it is active or not by clicking on 'view responses'. This will gi...
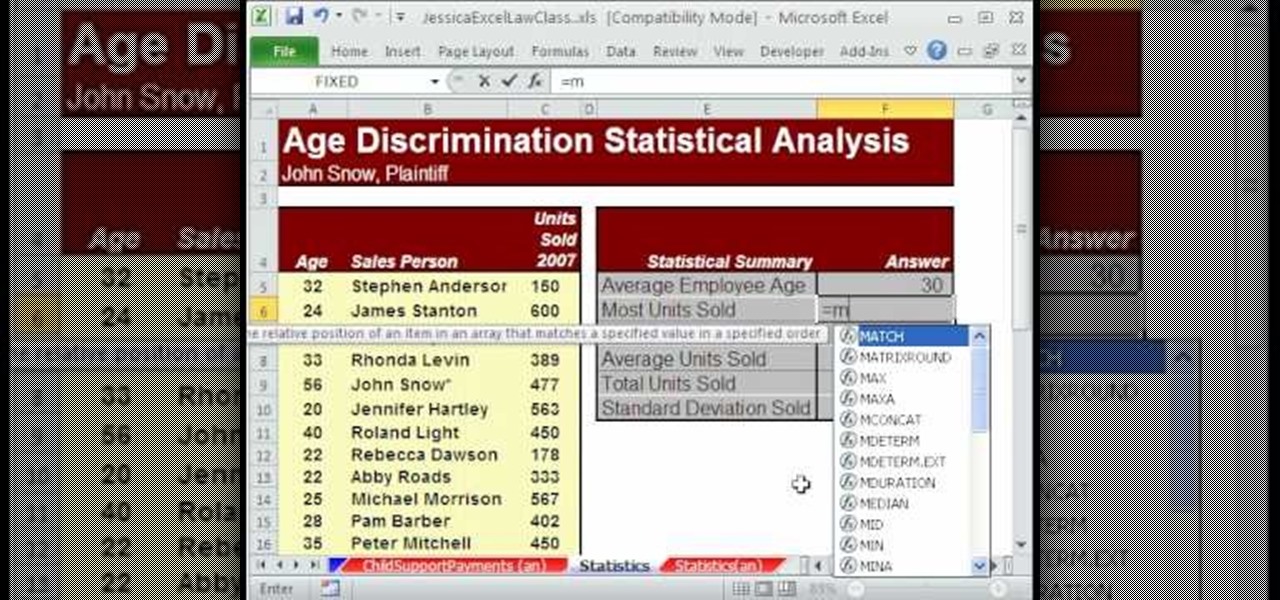
New to Microsoft Excel? Looking for a tip? How about a tip so mind-blowingly useful as to qualify as a magic trick? You're in luck. In this MS Excel tutorial from ExcelIsFun, the 532nd installment in their series of digital spreadsheet magic tricks, you'll learn how to use the AVERAGE, STDEV, MAX, MIN and SUM function to add statistical data. Specifically, this video lesson discusses how to sum and average evidence in an age discrimination case.
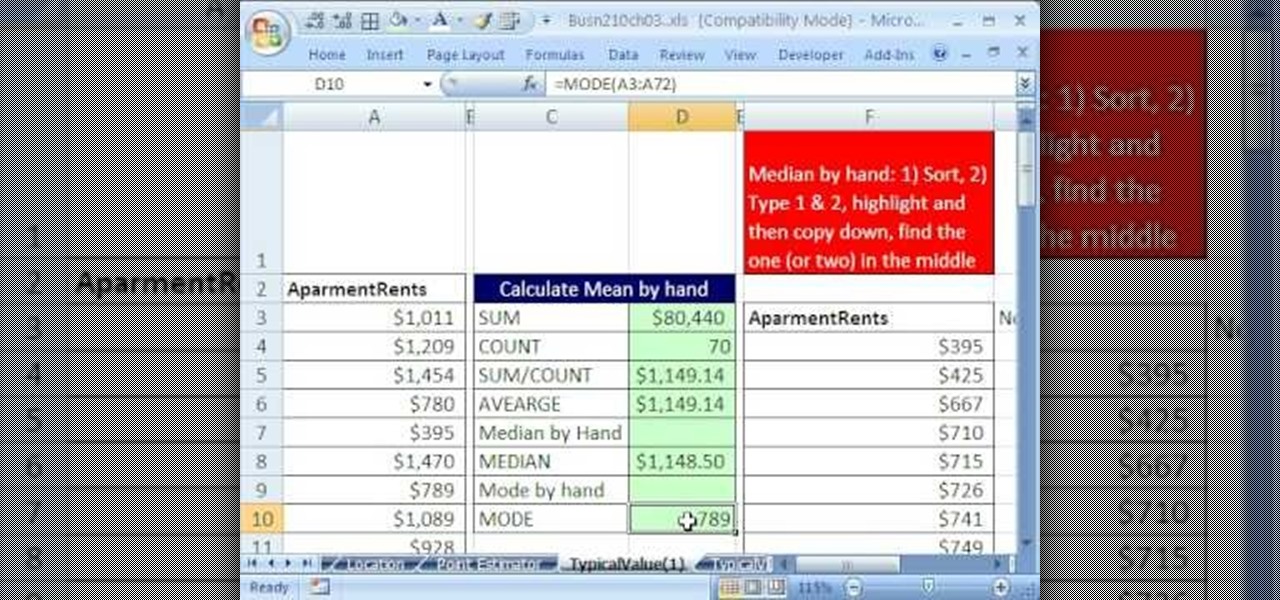
If you use Microsoft Excel on a regular basis, odds are you work with numbers. Put those numbers to work. Statistical analysis allows you to find patterns, trends and probabilities within your data. In this MS Excel tutorial from everyone's favorite Excel guru, YouTube's ExcelsFun, the 34th installment in his "Excel Statistics" series of free video lessons, you'll learn how to use MEAN, MEDIAN, MODE. These measures give us a typical value, a measure of central tendency one value that can repr...
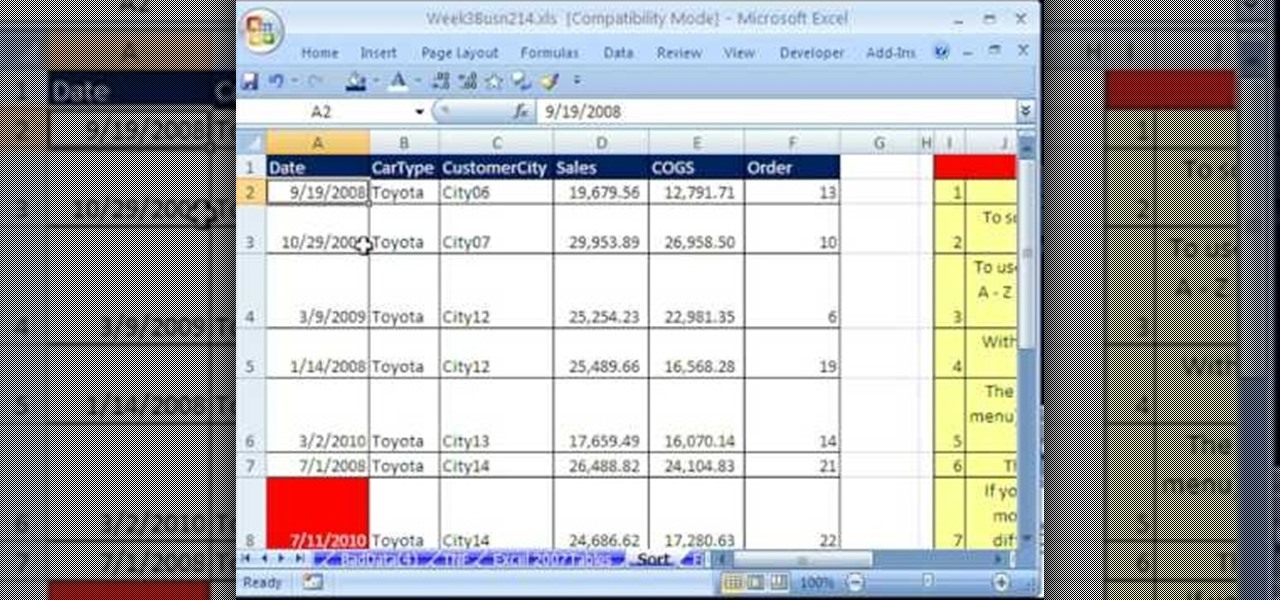
Whether you're interested in learning Microsoft Excel from the bottom up or just looking to pick up a few tips and tricks, you're in the right place. In this tutorial from everyone's favorite digital spreadsheet guru, ExcelIsFun, the 16th installment in his "Highline Excel Class" series of free video Excel lessons, you'll learn how to sort data in MS Excel. Specifically, you'll see the following:
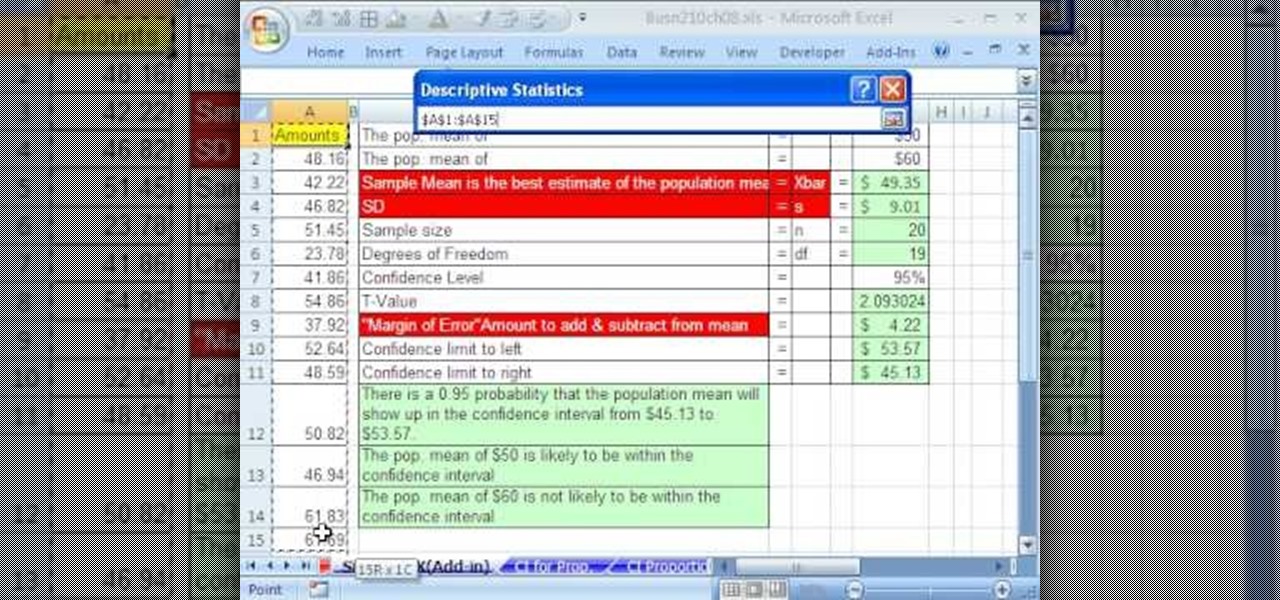
If you use Microsoft Excel on a regular basis, odds are you work with numbers. Put those numbers to work. Statistical analysis allows you to find patterns, trends and probabilities within your data. In this MS Excel tutorial from everyone's favorite Excel guru, YouTube's ExcelsFun, the 84th installment in his "Excel Statistics" series of free video lessons, you'll learn how to construct confidence intervals when the sigma is NOT known using the Descriptive Statistics data analysis add-in.

If you use Microsoft Excel on a regular basis, odds are you work with numbers. Put those numbers to work. Statistical analysis allows you to find patterns, trends and probabilities within your data. In this MS Excel tutorial from everyone's favorite Excel guru, YouTube's ExcelsFun, the 38th installment in his "Excel Statistics" series of free video lessons, you'll learn how to use the RANK and PERCENTRANK functions as well as the Data Analysis add-in's Rank & Percentile tools.
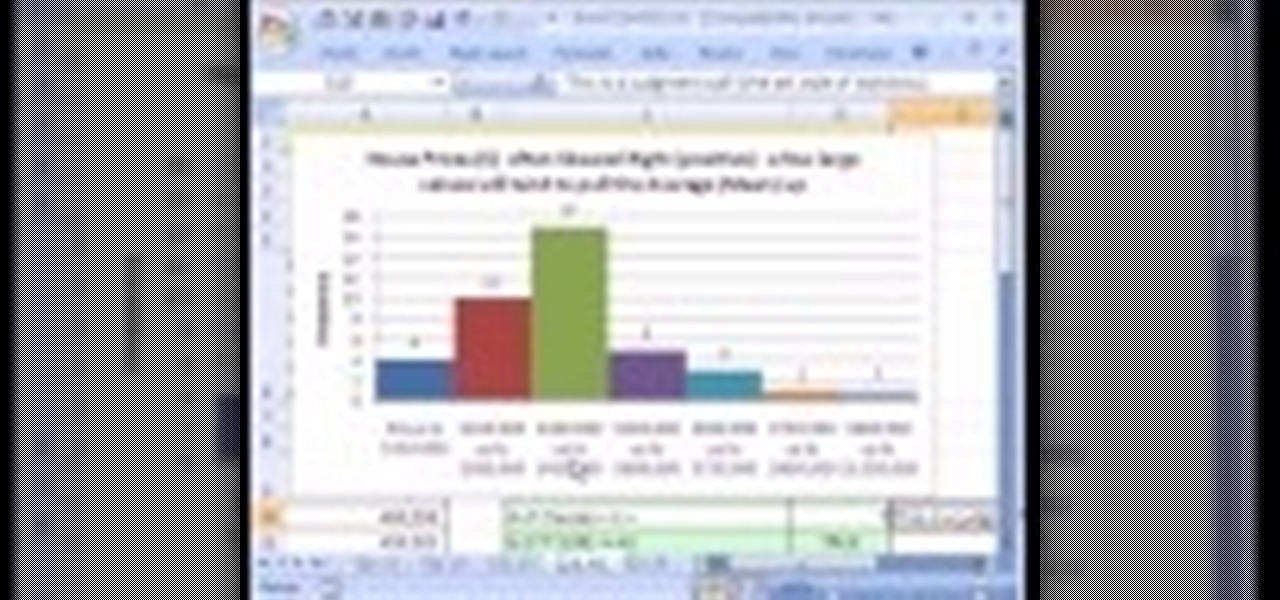
If you use Microsoft Excel on a regular basis, odds are you work with numbers. Put those numbers to work. Statistical analysis allows you to find patterns, trends and probabilities within your data. In this MS Excel tutorial from everyone's favorite Excel guru, YouTube's ExcelsFun, the 23rd installment in his "Excel Statistics" series of free video lessons, you'll learn how to work with skew in histograms for quantitative Data. Learn how to skew left (negative) and skew right (positive) with ...
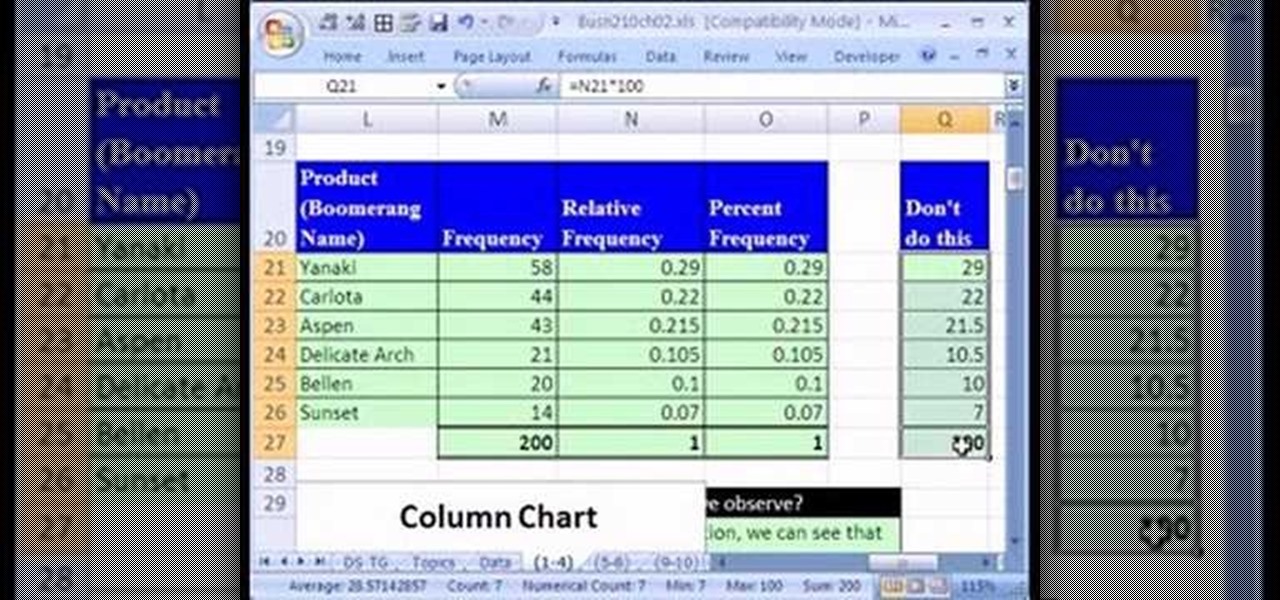
If you use Microsoft Excel on a regular basis, odds are you work with numbers. Put those numbers to work. Statistical analysis allows you to find patterns, trends and probabilities within your data. In this MS Excel tutorial from everyone's favorite Excel guru, YouTube's ExcelsFun, the 14th installment in his "Excel Statistics" series of free video lessons, you'll learn how to create relative & percent & frequency distributions with formulas for categorical data. See, too, how to create a per...
New to Microsoft Excel? Looking for a tip? How about a tip so mind-blowingly useful as to qualify as a magic trick? You're in luck. In this MS Excel tutorial from ExcelIsFun, the 552nd installment in their series of digital spreadsheet magic tricks, you'll learn how to look up and retrieve a row of data from a table and display it vertically using the VLOOKUP and ROWS functions.
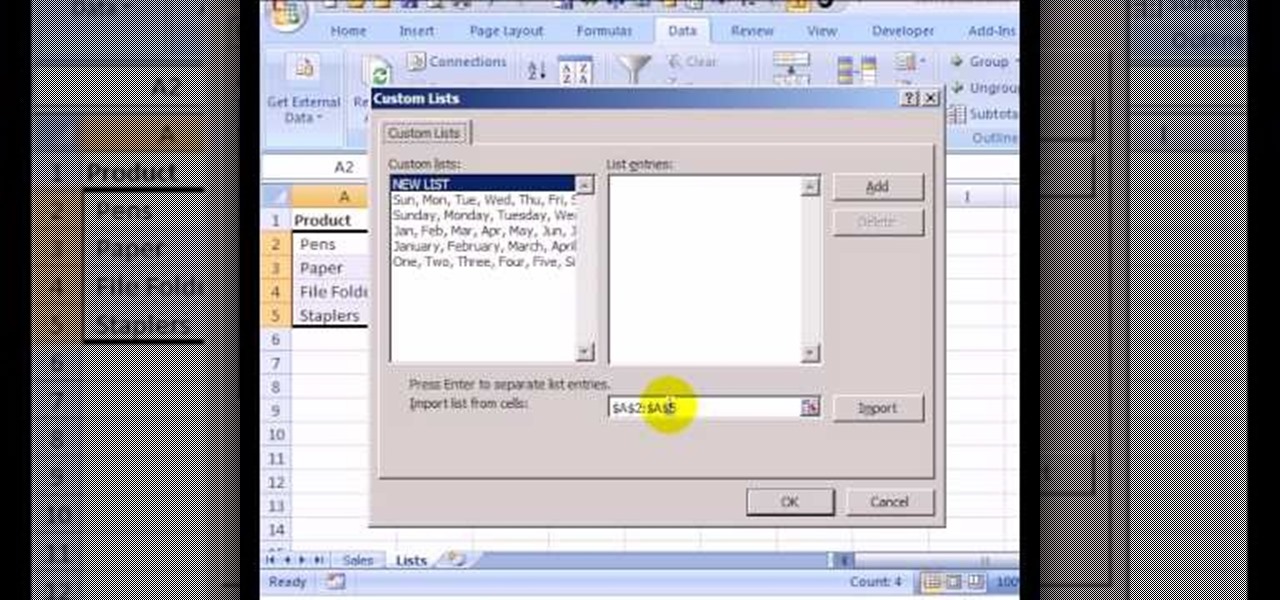
This how to video shows you how to sort data in Excel in a custom order. First, open a spread sheet in Excel. Select a column of cells with words that you want sorted. Click the office button and select Excel options. Go to edit custom list. You will see different custom lists. Click import to import your selection as a custom list. Next, you can go back to a sheet with those words that you want sorted and click the sort command. Select custom list on the order tab and select your new custom ...
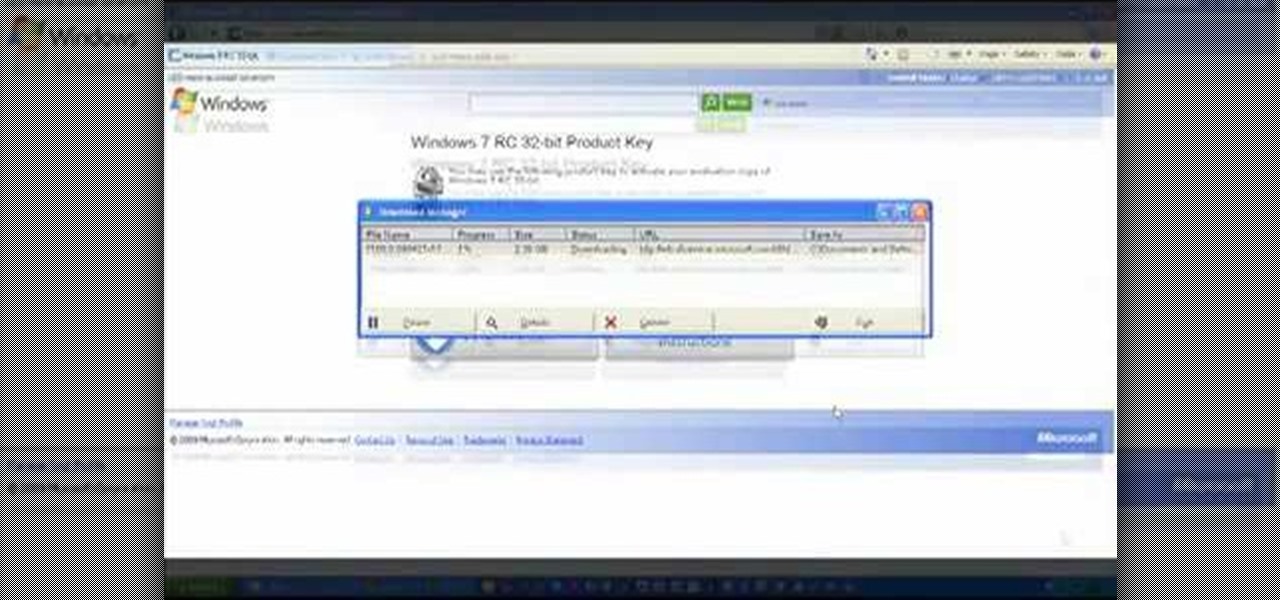
Microsoft has released its latest rendition of the Windows operating system, Windows 7. Windows 7 succeeds Windows Vista and comes with many improvements and useful updates. To install the update one a personal computer running Windows, a backup of the user's personal files and data onto a detachable hard drive is recommended to prevent data loss during the update process. The ISO image of the Windows 7 OS is burned onto a DVD. A partition is optionally created on the user's computer to allow...
Insert DVD containing Mac OS software into system drive. Reboot system. Confirm installation and agree with license. When prompted to select drive, select disk utility from menu bar. Select hard drive and click on erase button. Select Mac OS extended file system. Confirm erasing all data. Once drive formatted, close disk utility. Select to install in hard drive that was erased. After installation completes and system reboots, select Language and Keyboard for your country. When asked if alread...
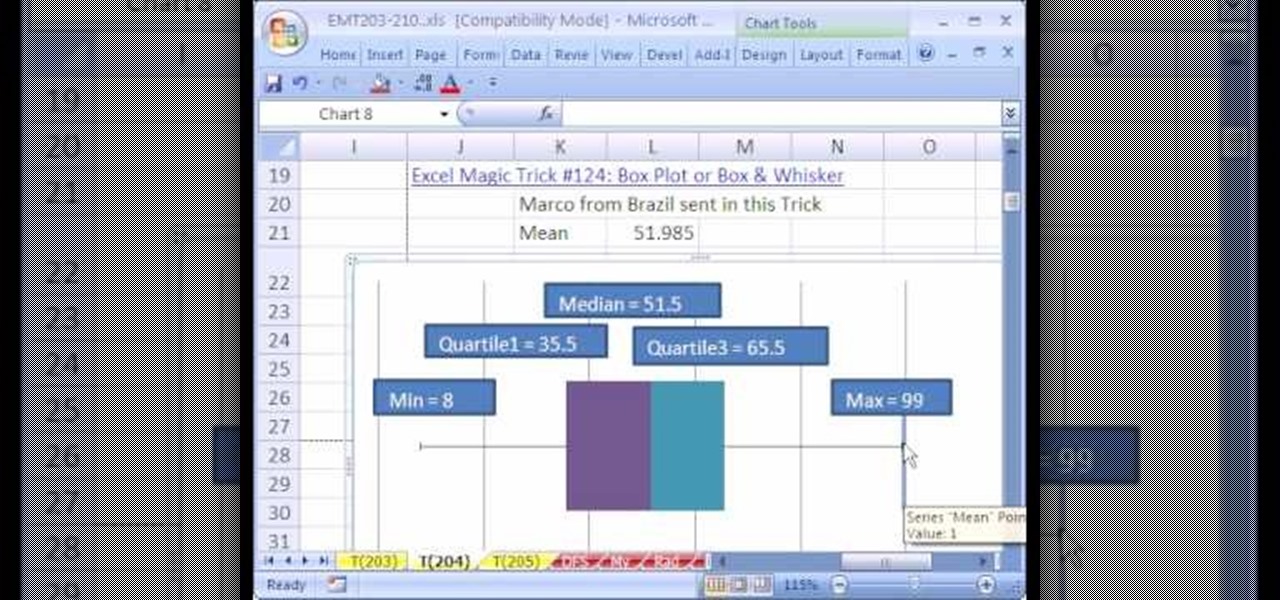
New to Microsoft Excel? Looking for a tip? How about a tip so mind-blowingly useful as to qualify as a magic trick? You're in luck. In this MS Excel tutorial from ExcelIsFun, the 204th installment in their series of digital spreadsheet magic tricks, you'll learn how to add a mean value as a scatter diagram data series to a box plot or box & whisker that is set up as a bar chart.
Reformatting a flash drive will update its drivers and rid it of all data. This can help in a lot of occurances. This tutorial will show you exactly how to format flash drive properly.
In this video the instructor shows how to solve mixture problems using two variables. Usually in these kind of questions the problem statement goes like, if A costs $x for a pound and B costs $y for a pound, in what ratio should they be mixed such that one pound of the new mixture sells for $z a pound. So, in these kind of problems start with a box where you list down all the given data in the form of a table as shown in the video. Now denote the unknown quantity of A and B by two variables a...
New to Excel? Looking for a tip? How about a tip so mind-blowingly advanced as to qualify as a magic trick? You're in luck.
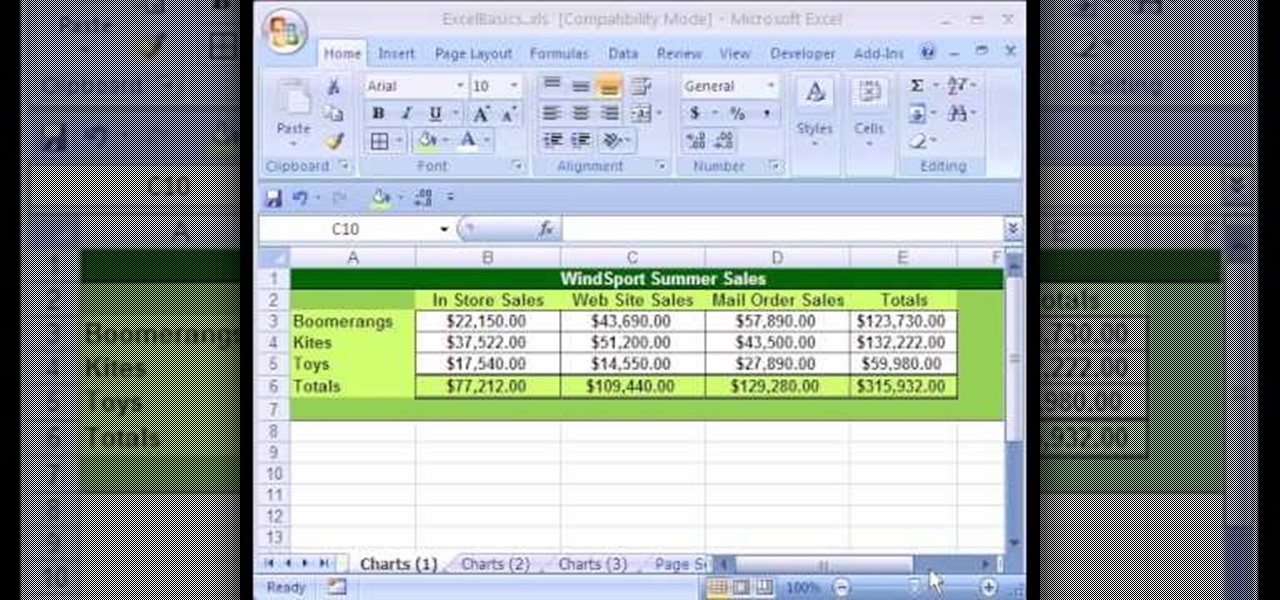
In this Excel basics video, the instructor talks about the basics of charts. There is an enormous difference in how you make charts between Microsoft Excel 2003 and 2007. In both the versions, to make charts the first thing you do is highlight the data cells in your workspace. Now use the toolbar and click on the charts button there. Now Excel automatically generates the charts based on the data and the column and row names. But there are various changes between the charts produced in the dif...
In this tutorial the instructor explains the percentile formula. He says that the percentile formula is used to find the percentile rank of a data point in a group of data. He takes an example that consists of the lengths of puppies. Now he intends to find out the percentile rank of any puppy in the group. He shows that the formulate to compute a percentile rank of a particular puppy is rank R = 100 * (N< + (1/2)N= )/ Nt, where N< is the number of puppies whose length is less that the length ...
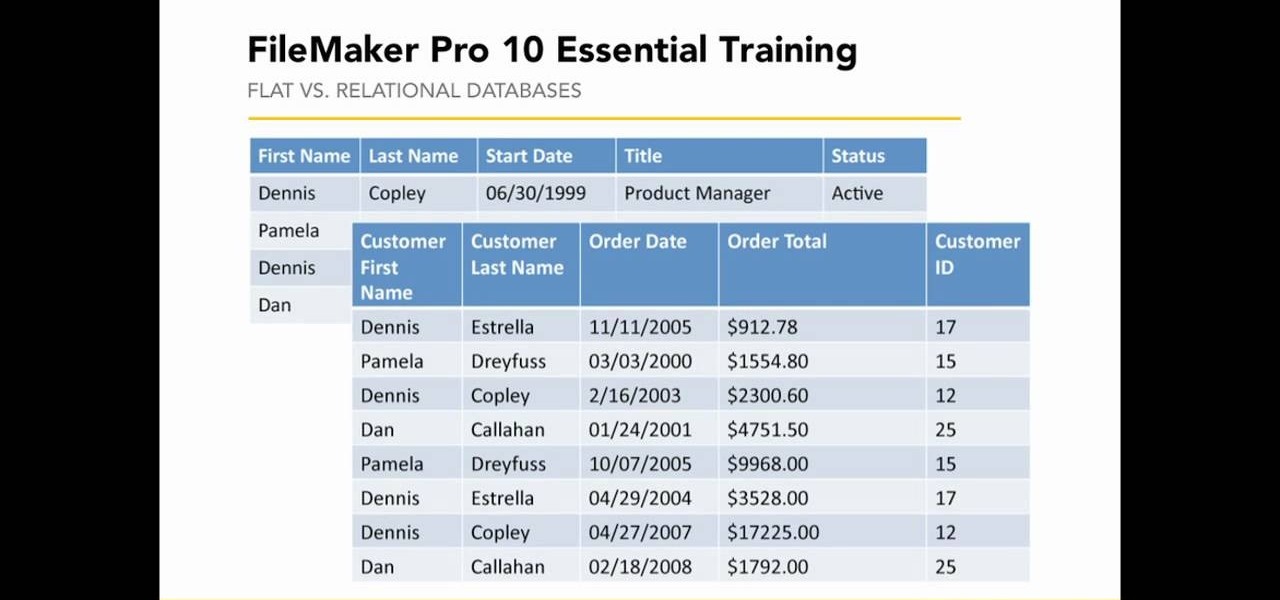
This video presented by Cris Ippolite makes a comparison between flat files and relational databases made with FileMaker Pro 10. It starts by showing flat files, which programs like Microsoft Excel use. Flat files have a big disadvantage: they cannot communicate with other files, even those with related data. If you wish to make your job easier, you should use relational databases. With databases, the tables communicate between one another. Once you store an entry in a table, you can use it i...
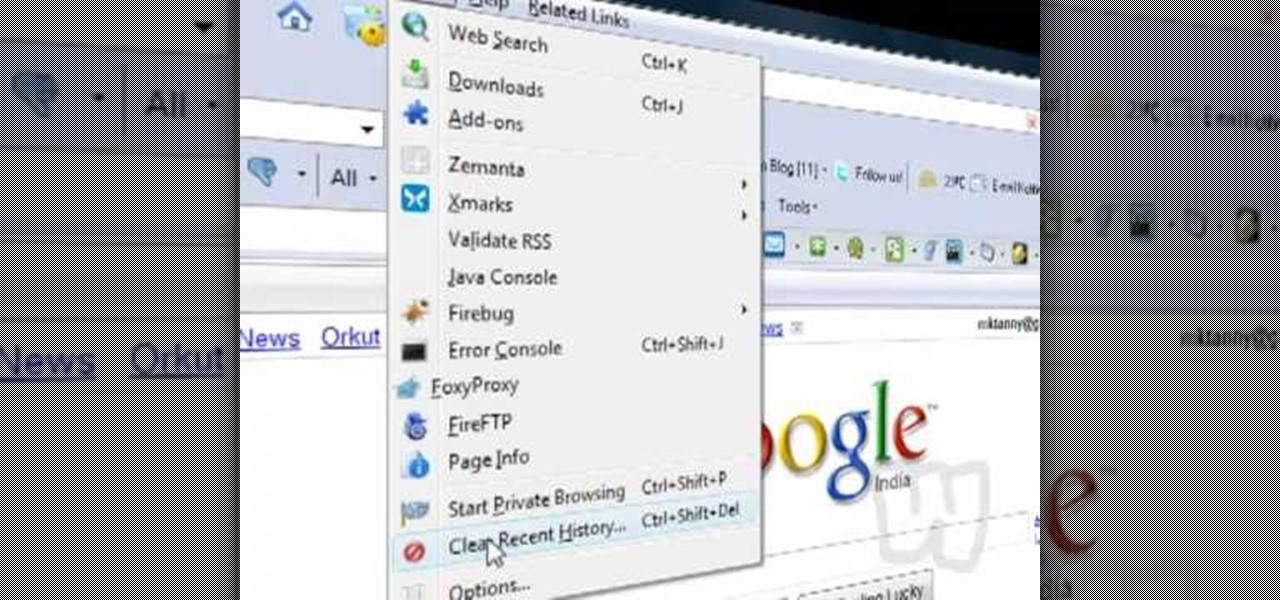
This video shows you how to easily delete cookies from your browser. First thing you have to do is open the web browser you usually use (the video shows how to delete cookies from Firefox) and go to the Options tab in the upper menu. Then choose the Clear Private Data or Clear Recent History item. In the pop-up window, check Cookies and Cache and then press the Clear Now button. The Clear Private Data/ Clear Recent History window also can be opened by pressing CTRL+SHIFT+DEL. That's it! Good ...
This video, presented by Cris Ippolite, makes a comparison between flat files and relational databases made with FileMaker Pro 10. It starts by showing that programs like Microsoft Excel uses, what in the databases circles, are called flat files. This flat files have a big disadvantage: it cannot communicate with other files even those have related data. So, instead of using those, if you want to ease your job, you should use relational databases. With databases, the tables communicate betwee...
Learn how to set up the Internet for T-Mobile on an iPhone clone. First you need to create a GPRS data account and a WAP profile for T mobile to bring up the service icon. Then click the data account button, then the GPRS button, then chose the correct account for you, change the APN to Link (all lower case). Before you finish this process make sure the user name and password fields are blank.
We know, we know: How many people actually burn stuff onto CDs these days? Well, while external hard drives that hold several terrabytes of data and flash drives have kind of replaced our reliance on CDs, every now and then they're good for quickly compiling a "Pop Hits of the '80s" CD for your girlfriend or simply for storing your illegal version of Microsoft Office.
Microsoft ASP.NET is a free technology that allows programmers to create dynamic web applications. ASP.NET can be used to create anything from small, personal websites through to large, enterprise-class web applications. All you need to get started with ASP.NET is the free .NET Framework and the free Visual Web Developer. Generally, the DataPager control is used with the ListView control. The ListView control is data driven. First create a ListView control and provide it some data. Next drop ...
In this video tutorial, Chris Pels will show how information can be passed from one page to another using a query string. First, see how to construct a query string including variable names and values from information on a data entry form. Next, see how to access the query string information when the page is posted including how multiple query string variables are handled. As part of the server side processing of query string information, see how to implement validation for existence of query...
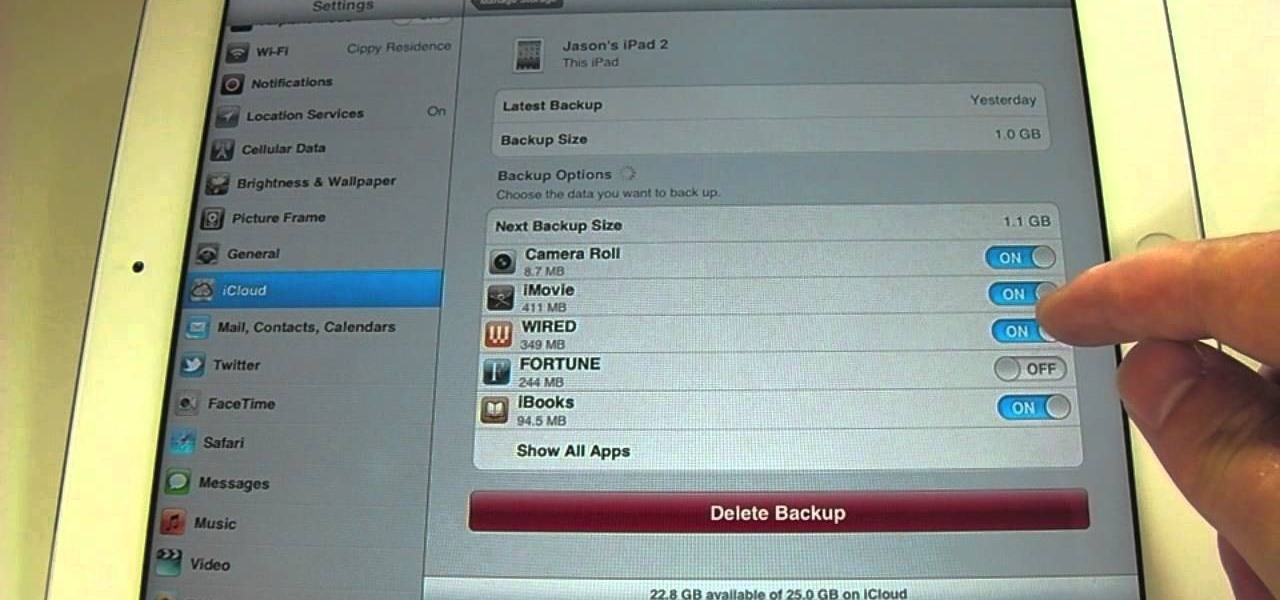
If you want to clear up some extra space in iCloud with iOS 5, take a look at this guide to learn how to manage your data on an iPad or iPhone running the service. You will need to access the iCloud panel under "Settings" to do so.
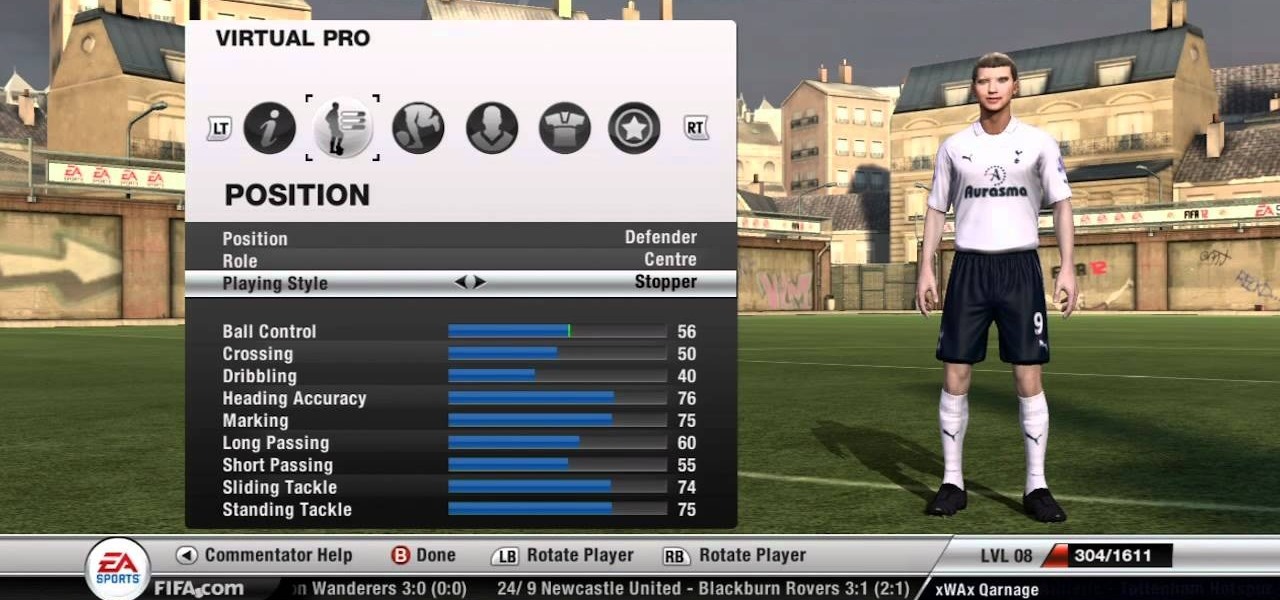
There are several methods in this guide that will help you earn the Boost Defense and Goalkeeper accomplishments in Fifa 12. Be sure not to change the formation of the BYA boosting team during step 3, otherwise the team data will become corrupt. This may be resolved in the future.
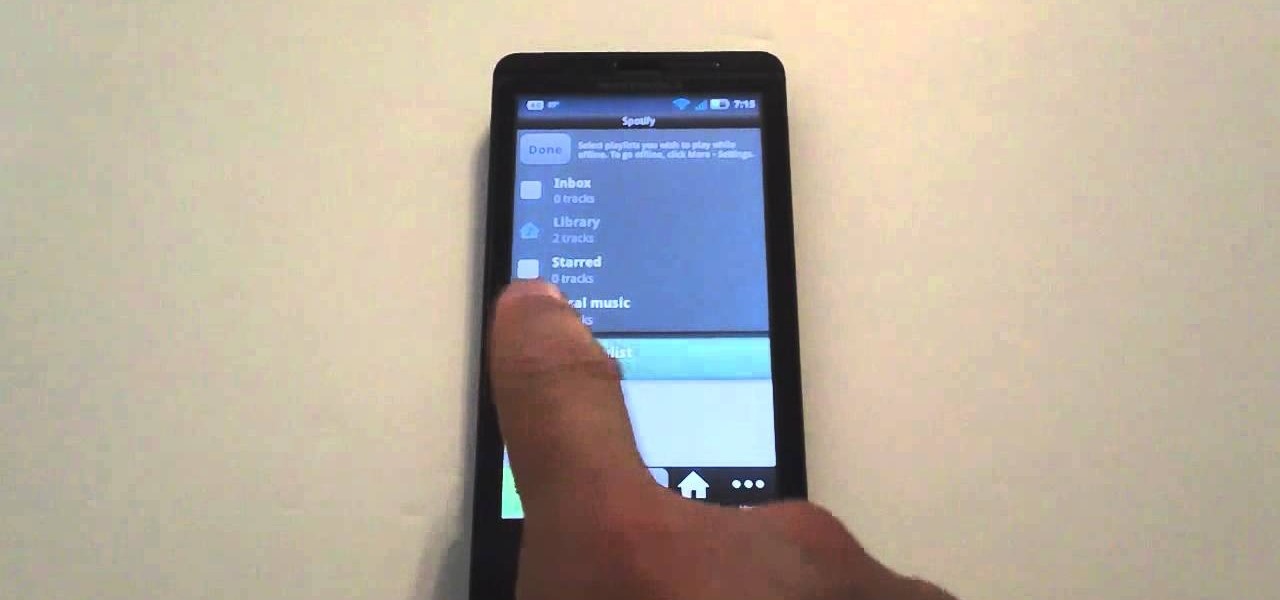
If you want to keep listening to music on your Android smartphone or tablet using the Spotify app, take a look at this video guide from Cnet on how to use Spotify in offline mode. This will let you keep listening to music while in an elevator or when you lose a data connection.
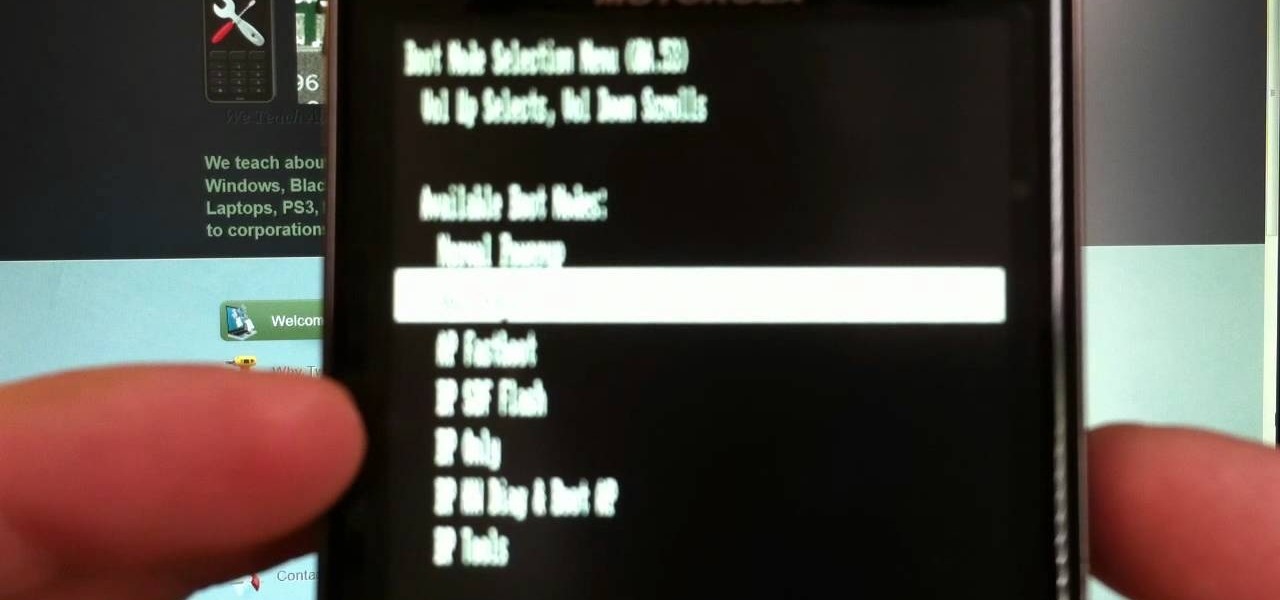
If your phone won't boot or you need to dig deeper into the Android operating system on your Motorola Droid Bionic, this tutorial on booting the Bionic into recovery mode should help you out. Just be careful, because a factory reset on the Verizon Wireless smartphone will cause you to lose all of your data.
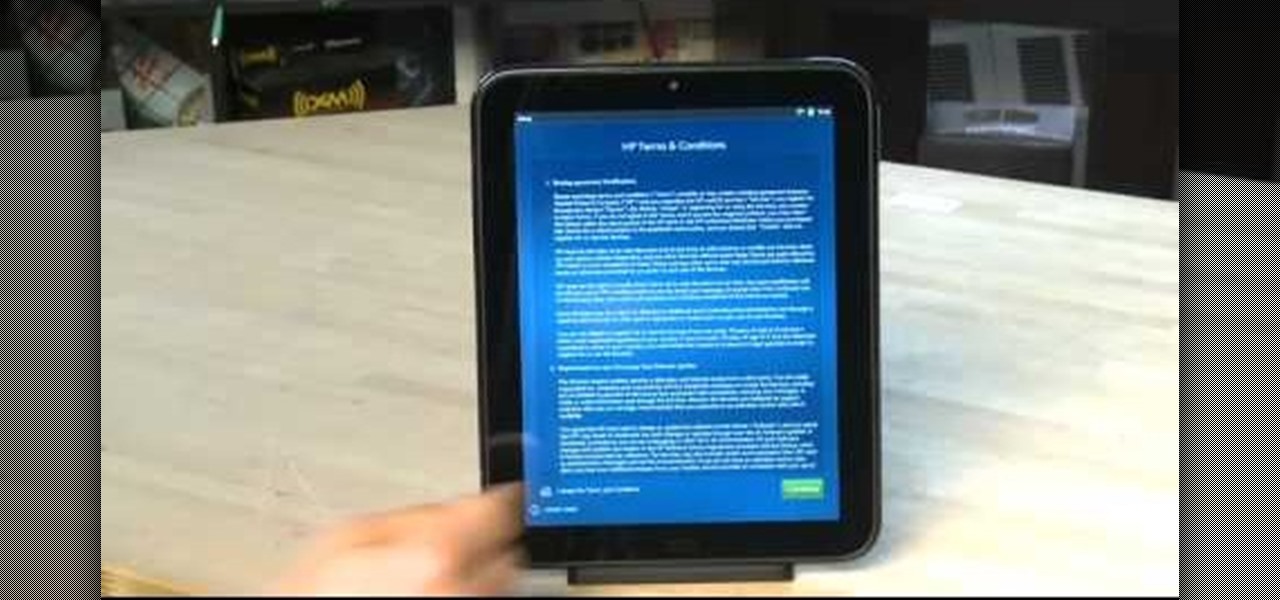
If you were one of the lucky individuals to score a TouchPad before HP discountinued them, you will need to proceed through the initial setup wizard when you turn on the device for the first time, or after performing a data wipe and reset on the tablet. This guide will walk you through everything from accepting the terms & conditions, connecting to a Wi-Fi network, and creating a webOS account for the first time.
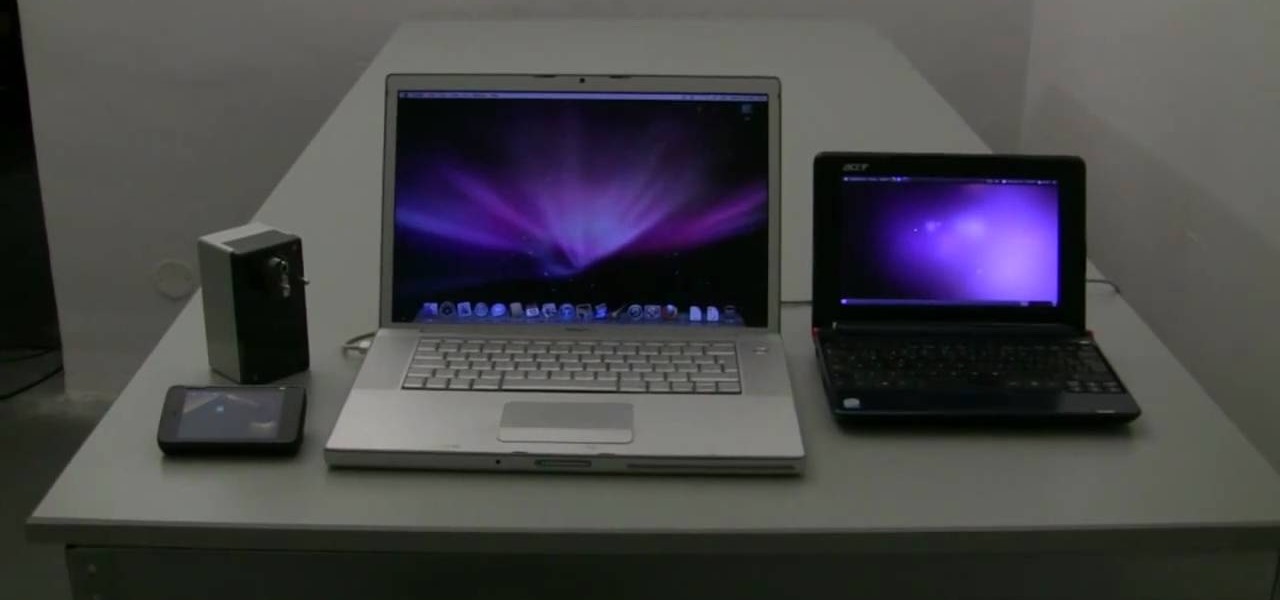
The Newstweek might be the coolest new device of 2011 that no one is talking about. It's a pocket-sized device that allows you to access the data streaming through a wireless internet access point and change the news being read by fellow users at the hotspot, from any site, however you want. It allows you to do some amazingly inspiring and sinister things, like any really progressive technology, and this video will show you how to use it.
This half-hour episode of Hak5 covers several topics: Using a DSLR camera to create HD footage, building your own Google TV, unlocking & copying locked files with Lock Hunter, using PicPick for screen capture, using WinDirStat for analyzing & cleaning your hard drive, setting up a secure FTP server with Ubuntu Server, and secretly copying data from USB drives with USB Dumper.
In this clip, you'll learn how to extract serial data from the $80 Mattel Mindflex or Star Wars Force Trainer. For more information, including detailed, step-by-step instructions, and to get started creating your own working EEG/BCI, watch this very-neat hacker's how-to.
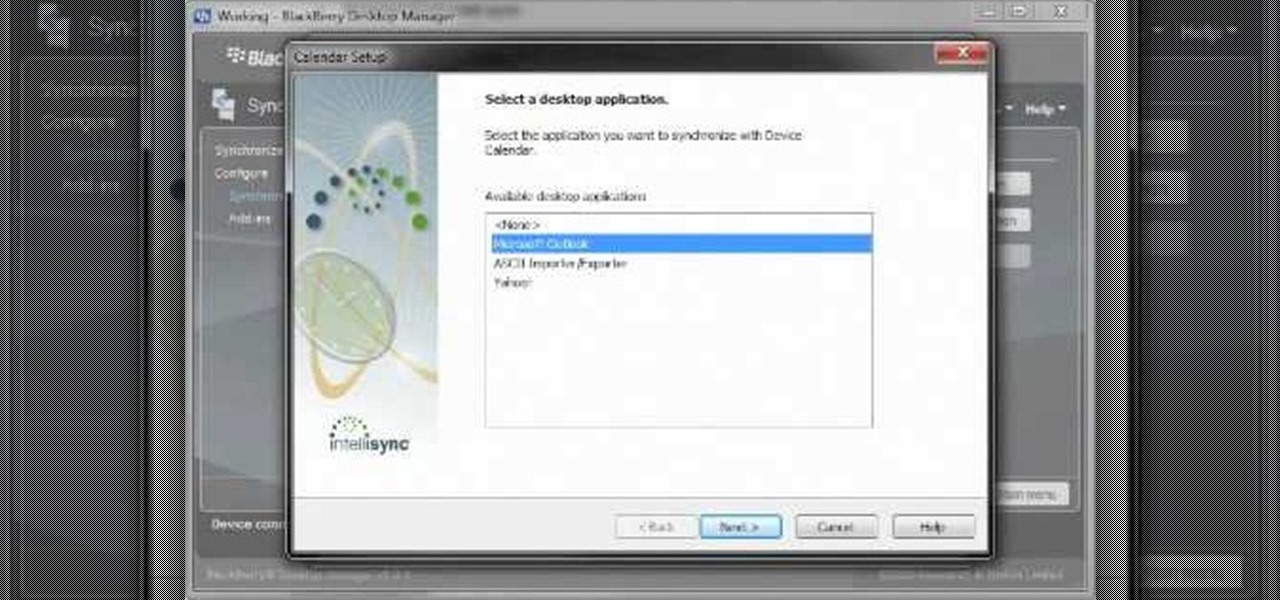
Want to know how to synch information between your BlackBerry smartphone and your computer? Connect your BlackBerry to your computer with a USB cable and launch BlackBerry Desktop Manager. Configure to taste, then click Next. For a complete video overview of the process, watch this BlackBerry owner's guide.
In this clip, learn how to use the Swype Key while texting with Swype on your cell phone. The Swype key is where all of your options are like dictionaries, tips and tricks, help menus and everything else you may need.
In this tutorial, learn how to access your phone's data network to enable free tethering on your new HTC EVO 4G. By tethering with your EVO you can connect up to eight other devices to your phone and use it as a wireless modem. This hack works with any EVO and will allow you to connect regardless of whether your city offers 3G or 4G signals.
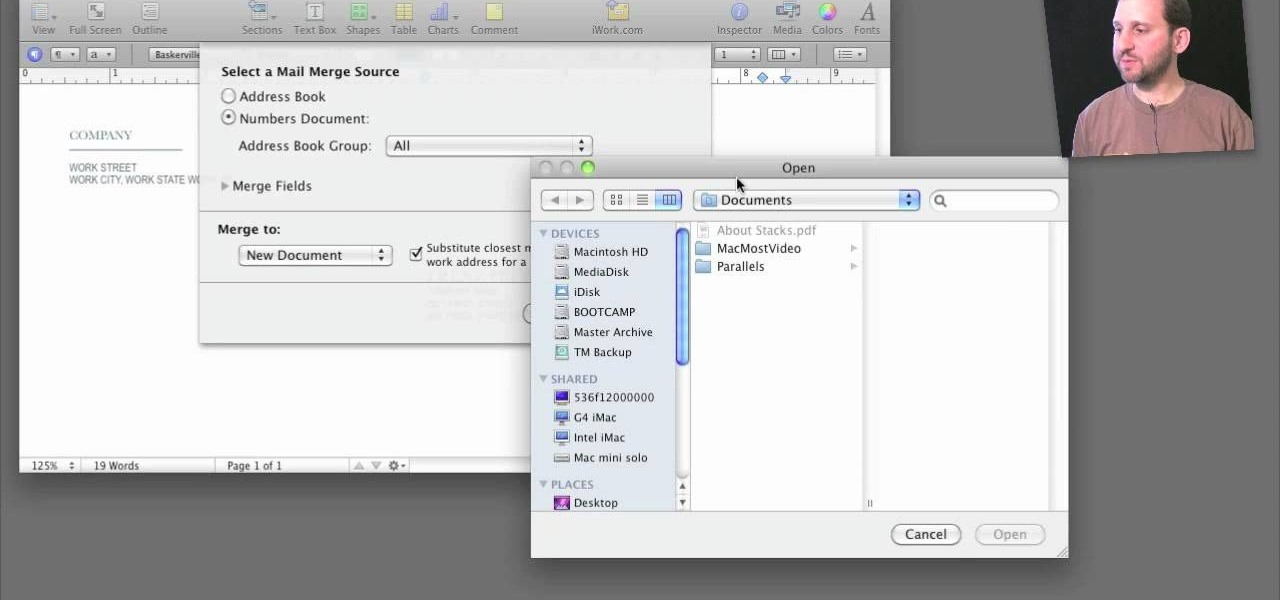
A step-by-step guide that will walk you through Mail Merge on a Mac computer. You will gain how to prep and print envelopes, letters or any document that you need to send to different names and addresses on each item. You can pull the data from your address book or from a Numbers Spreadsheet and will see how to modify and merge the information you will need to successfully set up your documents.
If you have a circular or semicircular protractor like the one used in this video, making a pie chart is as easy as – well — pie. This will teach you how to use your protractor to measure out each individual slice in your pie chart. Learn how to visualize statistical data through hand-drawn pie charts with this free video math lesson.
Whether you're new to Adobe Photoshop or a seasoned graphic design professional after a general overview of CS5's most vital new features, you're sure to be well served by this official video tutorial from the folks at Adobe TV. In it, you'll learn how to automatically correct lens distortions and fix chromatic aberration and vignetting with Photoshop CS5 and Photoshop CS5 Extended, which use an image file’s EXIF data to make precise adjustments based on the type of camera and lens you used.