The half updo is a perennial favorite in fantasy and period pieces, from Lord of the Rings to Mysts of Avalon to the Renaissance Faire or any other event for which you want a period hairstyle. Even if you're all thumbs, you'll be able to replicate this popular hairstyle.

Have you always thought of Excel's grid system as kind of limited? Too small for what you need? Well, now in Excel 2008 for Mac, its grid might be too big for its own good! It's huge with plenty of room for all your data. The Microsoft Office for Mac team shows you just how to explore the bigger grid in this how-to video.

Oh, no! Visual Basic macros are no longer supported in Excel 2008 for Mac, which might make things a little difficult for you if you're used them a lot in the past, or if somebody else gives you spreadsheets using them. The Microsoft Office for Mac team shows you just how to deal with Visual Basic macros in this how-to video.

Excel is great, and if you're a Mac user, Excel 2008 for Mac has a lot of new and useful great features you can use to maximize efficiency in your spreadsheets. Excel doesn't have to be the boss anymore, you can! The Microsoft Office for Mac team shows you all the great features in this how-to video.
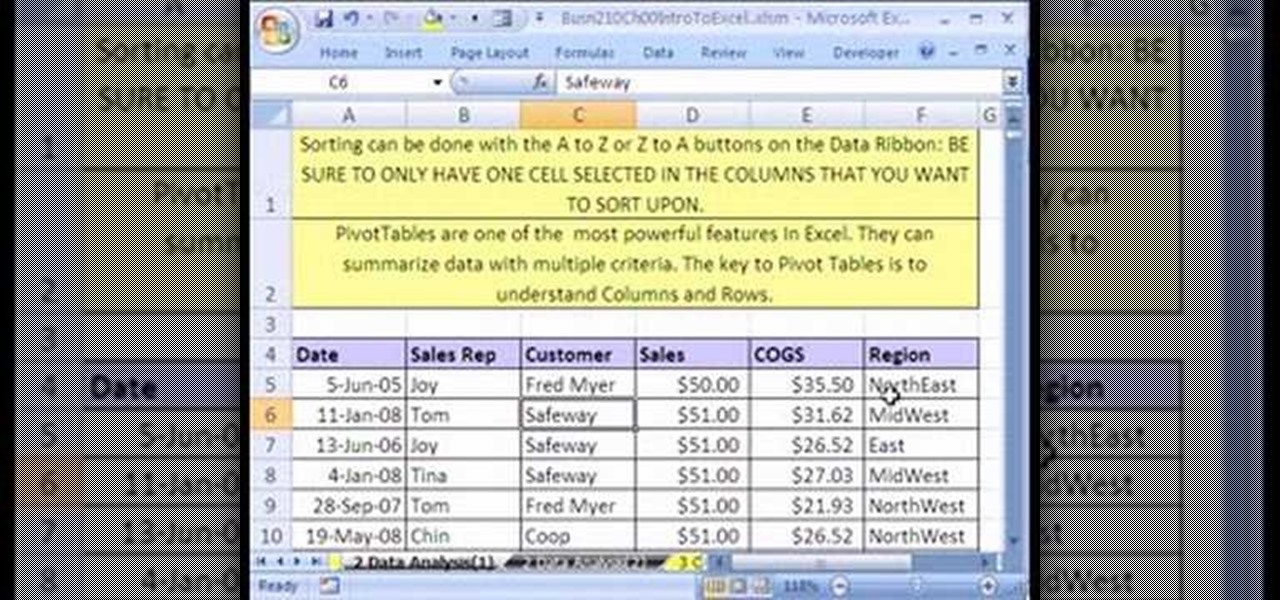
If you use Microsoft Excel on a regular basis, odds are you work with numbers. Put those numbers to work. Statistical analysis allows you to find patterns, trends and probabilities within your data. In this MS Excel tutorial from everyone's favorite Excel guru, YouTube's ExcelsFun, the 3rd installment in his "Excel Statistics" series of free video lessons, you'll learn how to use Excel's sorting and pivot tables (PivotTables) data analysis tools.
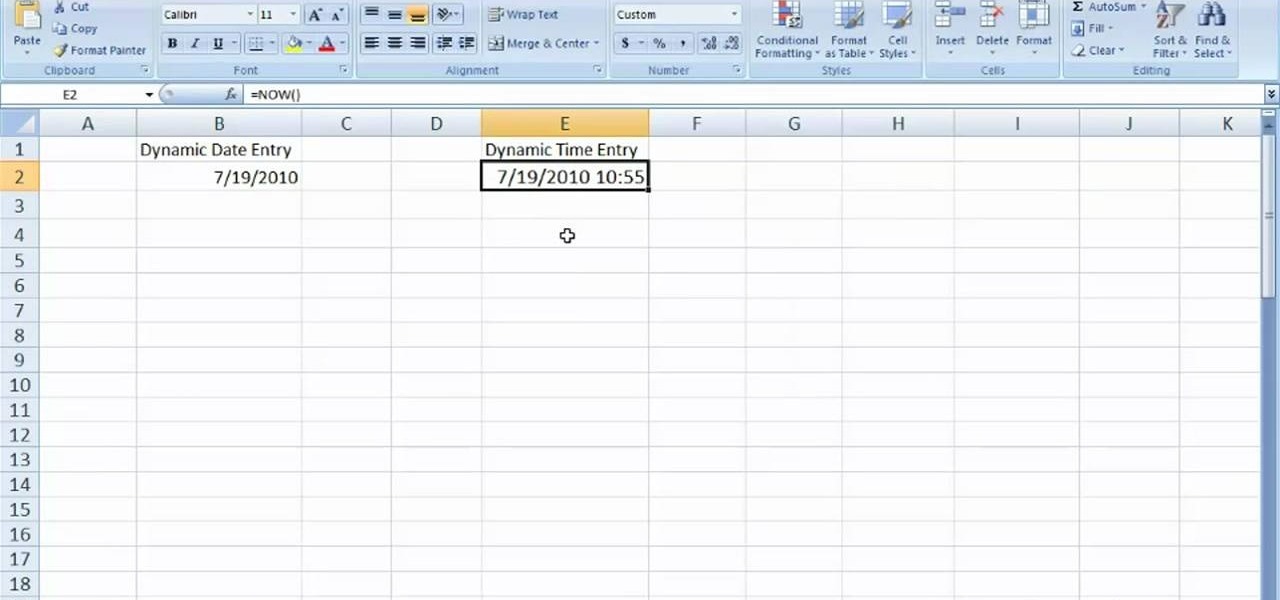
Need an introduction to Excel's useful TODAY & NOW time functions? You're in luck as this clip provides just that. Whether you're new to Microsoft's popular digital spreadsheet application or a seasoned business professional just looking to better acquaint yourself with the Excel 2007 workflow, you're sure to be well served by this video tutorial. For more information, including step-by-step instructions, take a look.

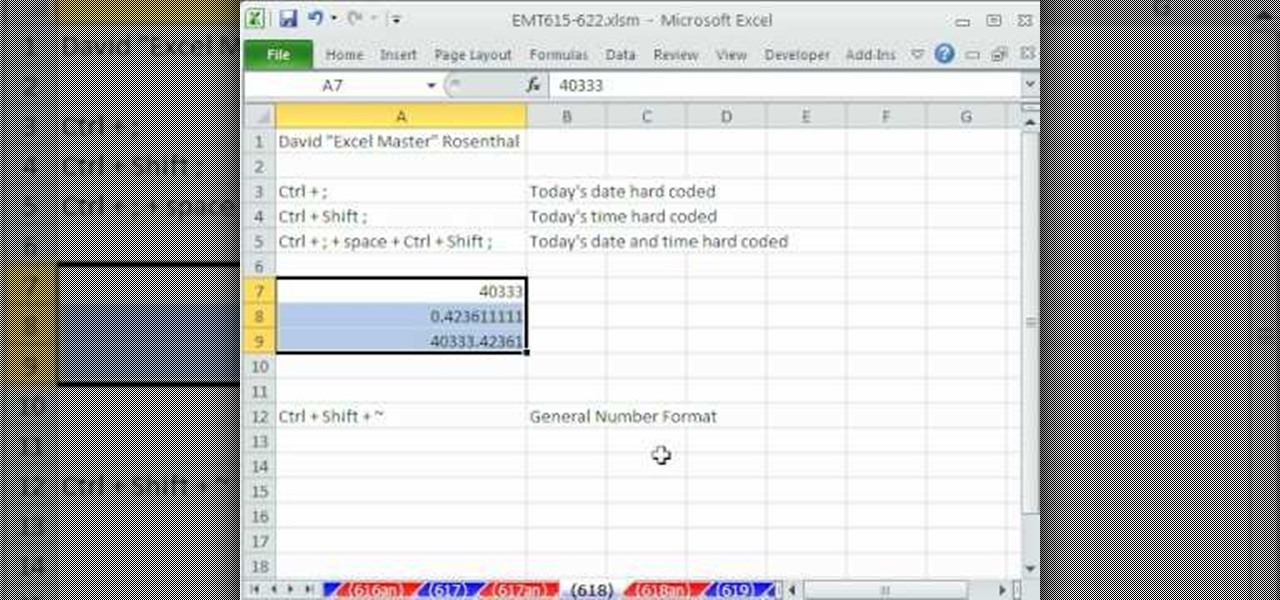
New to Microsoft Excel? Looking for a tip? How about a tip so mind-blowingly useful as to qualify as a magic trick? You're in luck. In this MS Excel tutorial from ExcelIsFun, the 618th installment in their series of digital spreadsheet magic tricks, you'll learn about a handy key command that will allow you to enter both today's time and date into a single Excel cell.

Whether you're interested in learning Microsoft Excel from the bottom up or just looking to pick up a few tips and tricks, you've come to the right place. In this tutorial from everyone's favorite digital spreadsheet guru, ExcelIsFun, the 37th installment in his "Highline Excel Class" series of free video Excel lessons, you'll learn how to work with MS Excel's SUMPRODUCT function.

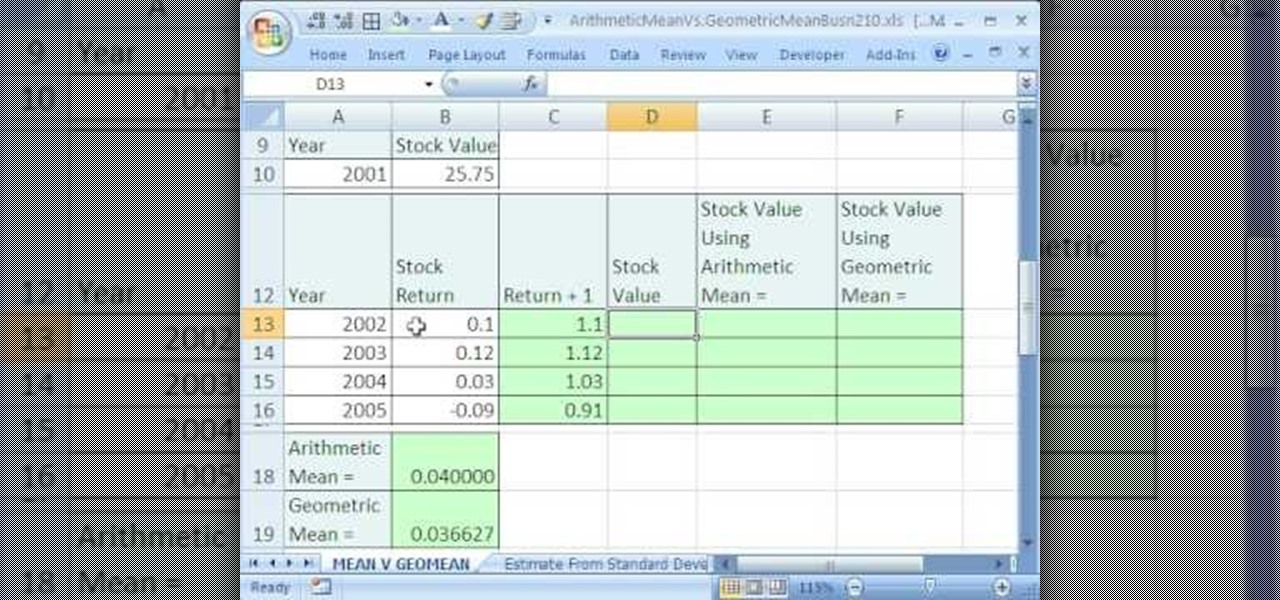
If you use Microsoft Excel on a regular basis, odds are you work with numbers. Put those numbers to work. Statistical analysis allows you to find patterns, trends and probabilities within your data. In this MS Excel tutorial from everyone's favorite Excel guru, YouTube's ExcelsFun, the 35.2nd installment in his "Excel Statistics" series of free video lessons, you'll learn how to use Excel's GEOMEAN function to find geometric mean.

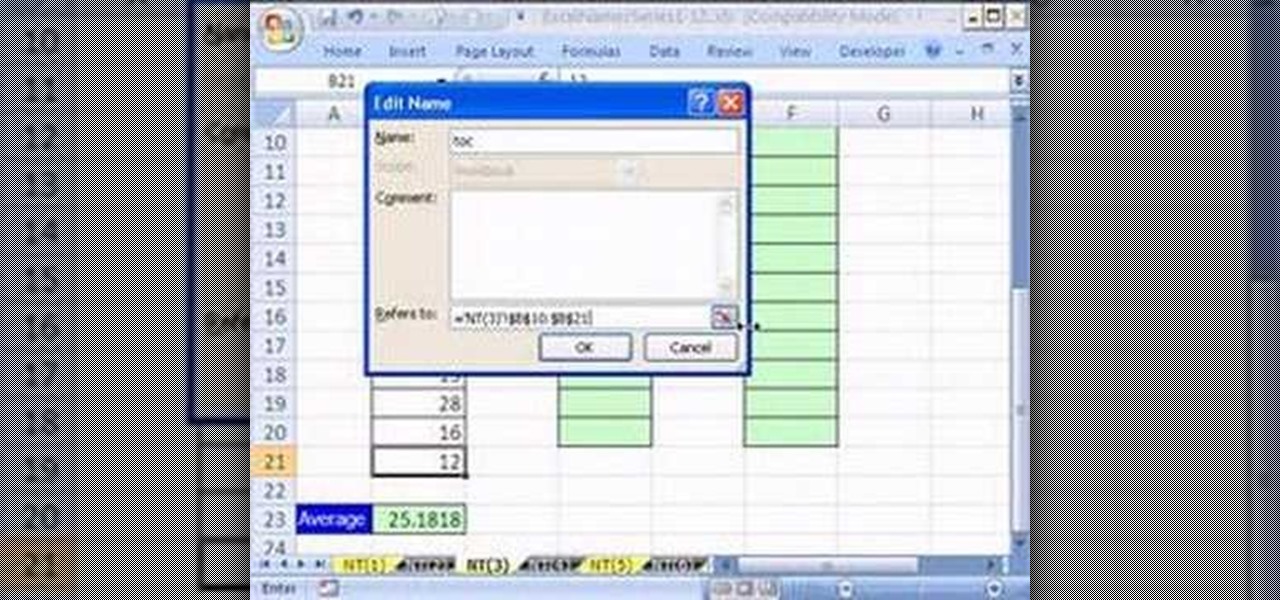
Looking for a primer on how to create and work with names in Microsoft Office Excel? You've come to the right place. In this free video tutorial from everyone's favorite MS Excel guru, YouTube's ExcelIsFun, the 1st installment in his series of Excel name tricks, you'll learn to use names in formulas and functions as well as how to edit them. See how to name a cell or range of cells with this free video lesson.

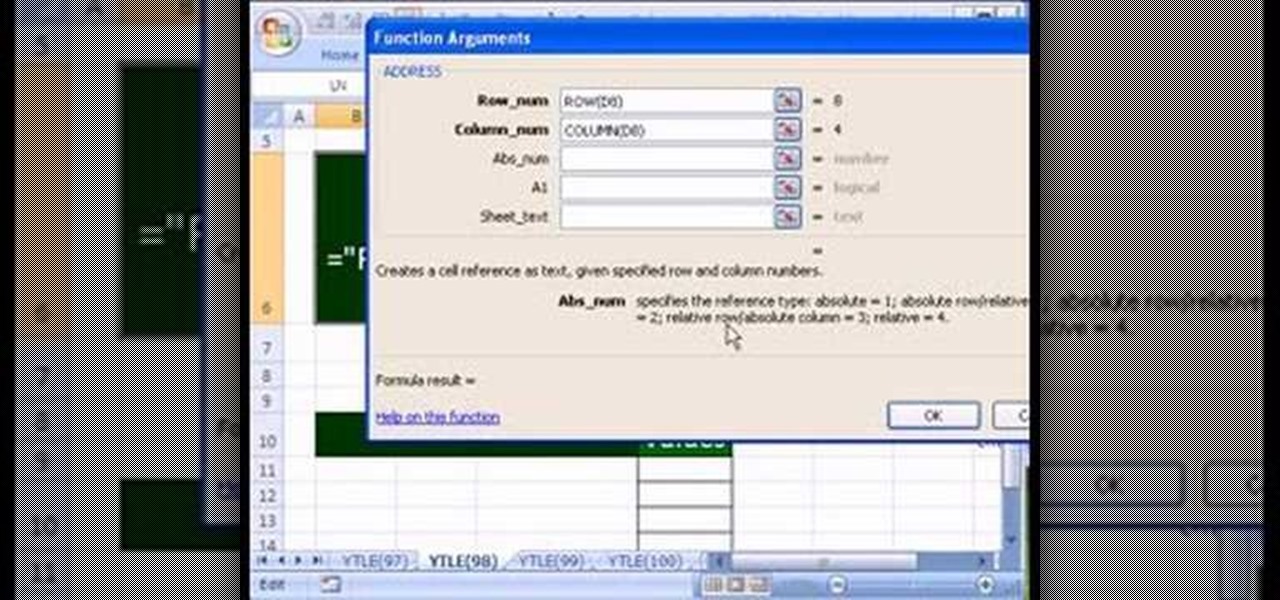
Love Microsoft Excel? This clip contains a tip that just might induce you to. With this free video tutorial from ExcelIsFun, the 98th installment of his "YouTubers Love Excel" or YTLE series of free video MS Excel lessons, you'll learn how to use the ADDRESS function to make labels in templates easier for users to understand.

New to Microsoft Excel? Looking for a tip? How about a tip so mind-blowingly useful as to qualify as a magic trick? You're in luck. In this MS Excel tutorial from ExcelIsFun, the 255th installment in their series of digital spreadsheet magic tricks, you'll learn how to create a two-variable data table in Excel for what-if analysis. See the PMT function and learn about the formula equivalent to a data table.

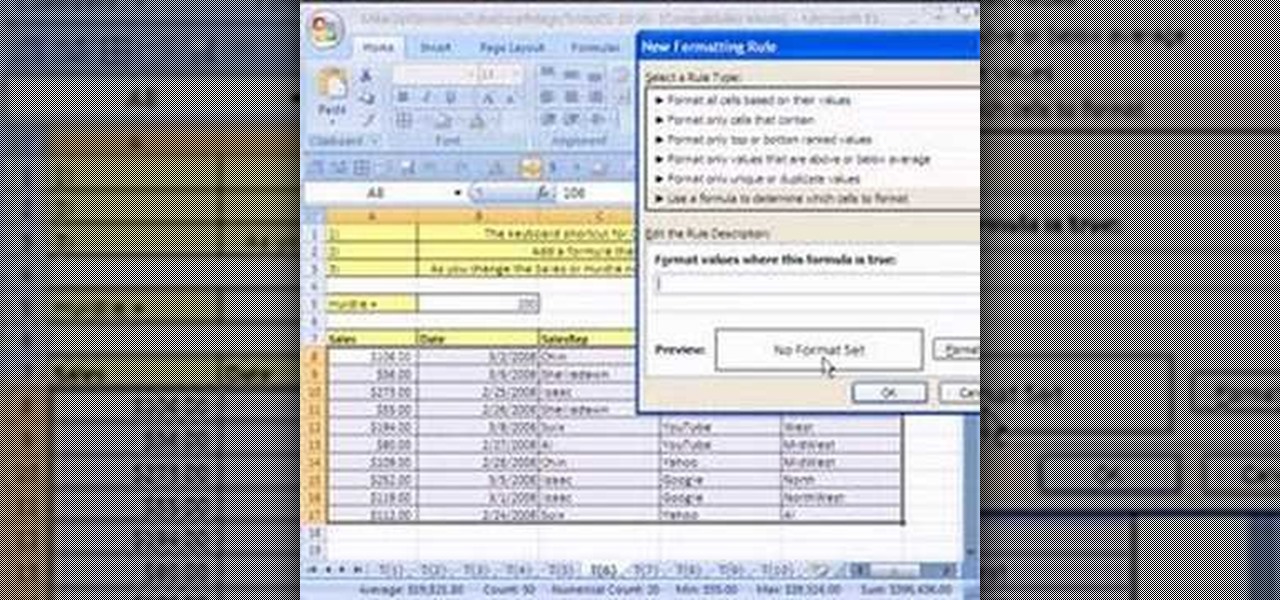
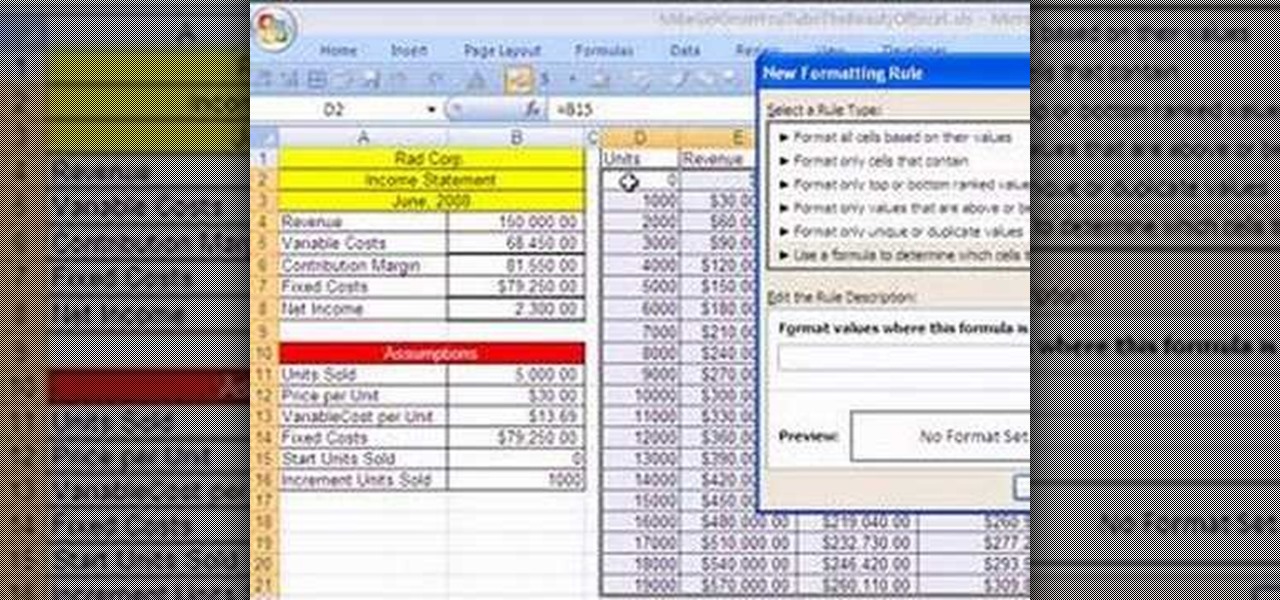
New to Microsoft Excel? Looking for a tip? How about a tip so mind-blowingly useful as to qualify as a magic trick? You're in luck. In this MS Excel tutorial from ExcelIsFun, the 6th installment in their series of digital spreadsheet magic tricks, you'll learn how to add conditional formatting to a whole row of data in an Excel sheet.

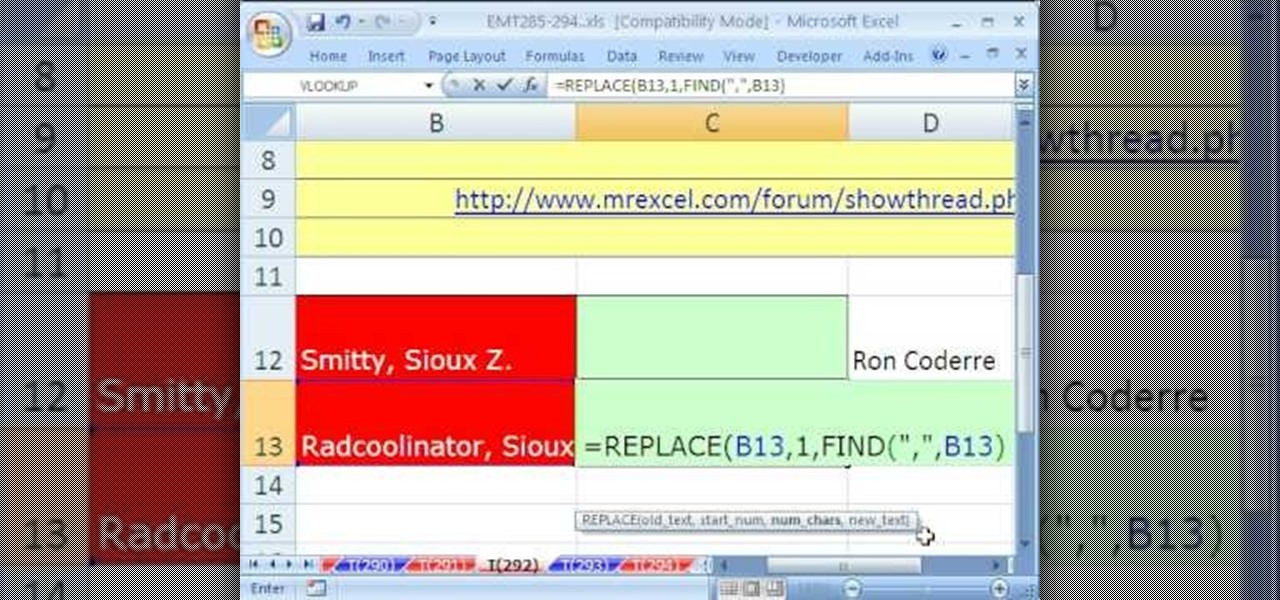
New to Microsoft Excel? Looking for a tip? How about a tip so mind-blowingly useful as to qualify as a magic trick? You're in luck. In this MS Excel tutorial from ExcelIsFun, the 292nd installment in their series of digital spreadsheet magic tricks, you'll learn how to extract first and last names from an Excel spreadsheet and rearrange them using a formula.

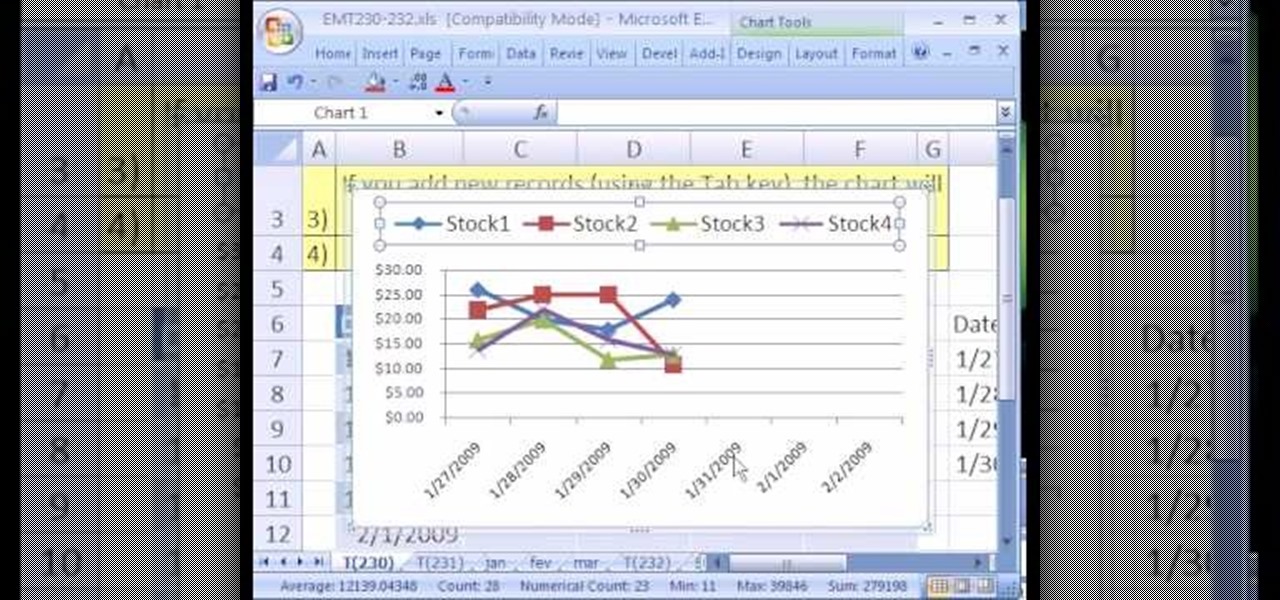
New to Microsoft Excel? Looking for a tip? How about a tip so mind-blowingly useful as to qualify as a magic trick? You're in luck. In this MS Excel tutorial from ExcelIsFun, the 230th installment in their series of digital spreadsheet magic tricks, you'll learn how to use the Excel List Table feature to make a dynamic stock price line chart.

Data can be troubling, especially if there's a ton of it plaguing your Excel worksheet. But Excel 2008 for Mac makes life a little easier and less confusing thanks to a few worksheet tips and features you can utilize to work with your data in worksheet cells. The Microsoft Office for Mac team shows you just how to work with worksheets in this how-to video.

Not every client or coworker likes to mine through a spreadsheet to find all the important data. So, with Excel 2008 for Mac, you can easily share that data without sending the entire Excel spreadsheet. To do this, all you need to do is to use the "copy as picture" option. The Microsoft Office for Mac team shows you just how to insert a spreadsheet snippet in this how-to video.

Learn how to make your Excel 2010 spreadsheets compatible with Excel 2003. Whether you're new to Microsoft's popular digital spreadsheet application or a seasoned business professional just looking to better acquaint yourself with the Excel 2010 workflow, you're sure to be well served by this video tutorial. For more information, including step-by-step instructions, take a look.

New to Microsoft Excel 2010? Looking for a few good tips and tricks? Look no further. In this free video tutorial from everyone's favorite MS Excel guru, YouTube's ExcelIsFun, the 8th installment in his series of Excel 2010 video tutorials, you'll learn how to use the Excel's new T functions — namely, T.INV, T.INV.2T, T.DIST, T.DIST.RT and T.DIST.2T.

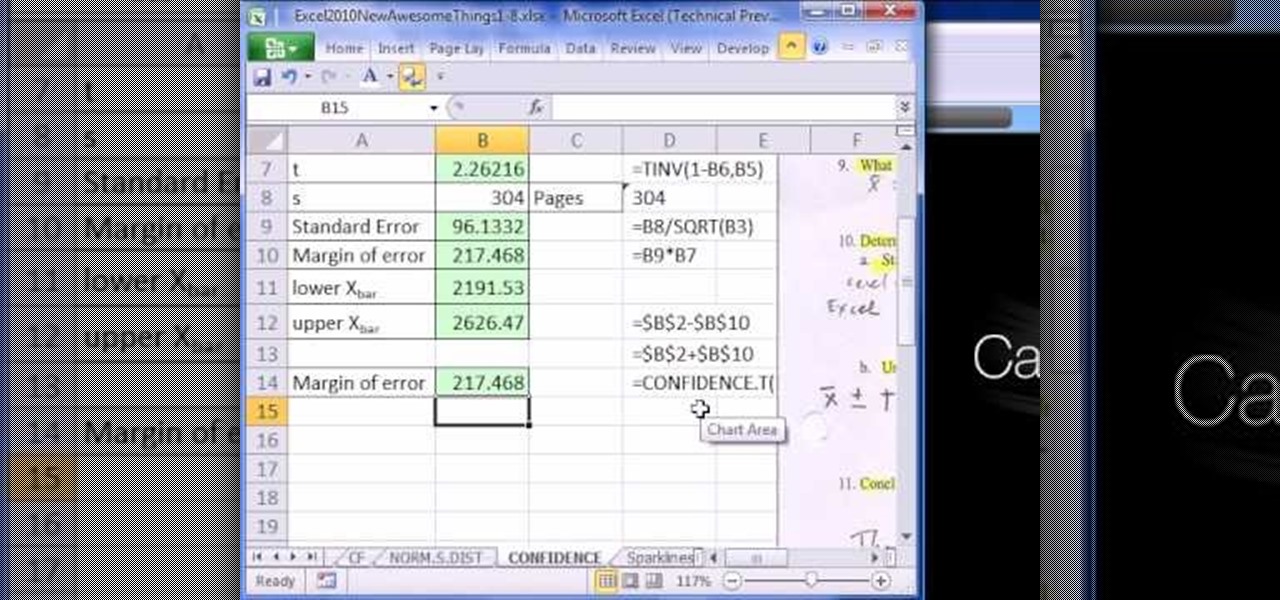
New to Microsoft Excel 2010? Looking for a few good tips and tricks? Look no further. In this free video tutorial from everyone's favorite MS Excel guru, YouTube's ExcelIsFun, the 7th installment in his series of Excel 2010 video tutorials, you'll learn how to use Excel's new CONFIDENCE.T function to calculate the margin of error for a T distribution confidence interval.

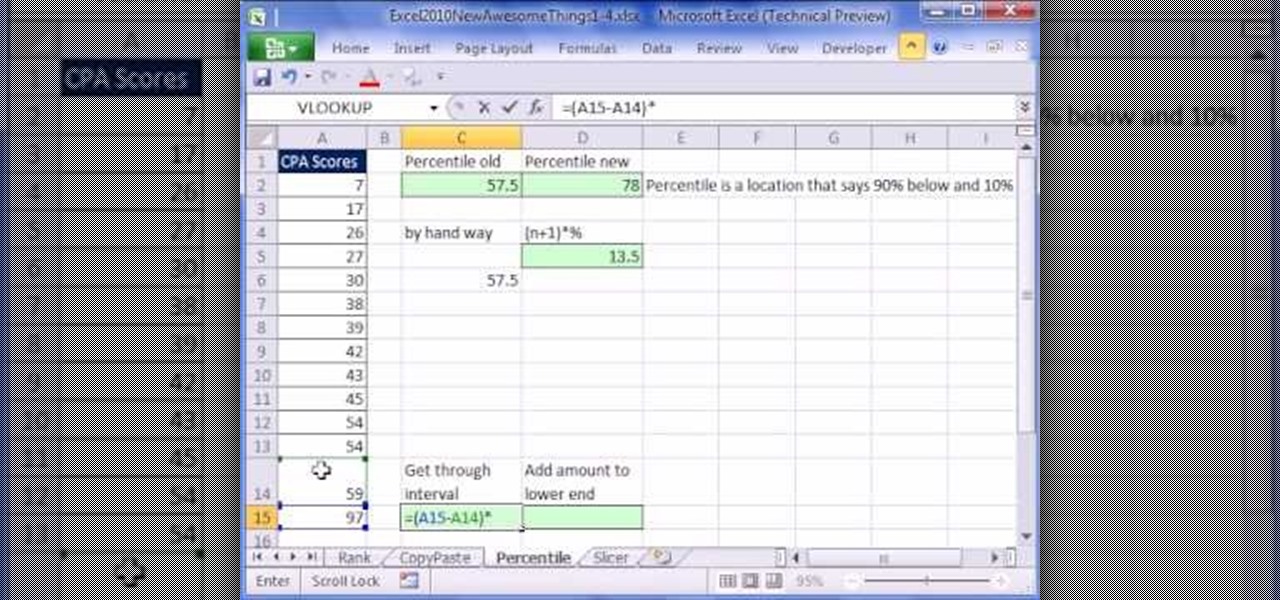
New to Microsoft Excel 2010? Looking for a few good tips and tricks? Look no further. In this free video tutorial from everyone's favorite MS Excel guru, YouTube's ExcelIsFun, the 3rd installment in his series of Excel 2010 video tutorials, you'll learn how to use Excel's new percentile function, PERCENTILE.EXC.

New to Microsoft Excel 2010? Looking for a few good tips and tricks? Look no further. In this free video tutorial from everyone's favorite MS Excel guru, YouTube's ExcelIsFun, the 2nd installment in his series of Excel 2010 video tutorials, you'll learn how to use Excel 2010's new copy and paste options.

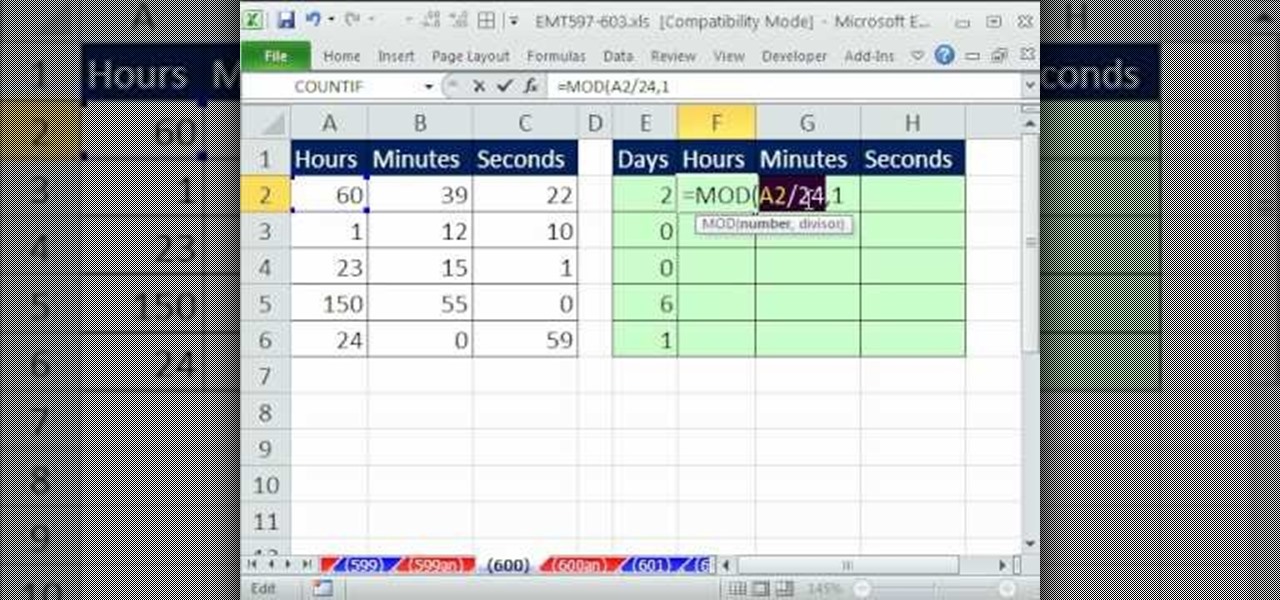
New to Microsoft Excel? Looking for a tip? How about a tip so mind-blowingly useful as to qualify as a magic trick? You're in luck. In this MS Excel tutorial from ExcelIsFun, the 600th installment in their series of digital spreadsheet magic tricks, you'll learn how to convert between days and hours using Excel's MOD & INT functions.

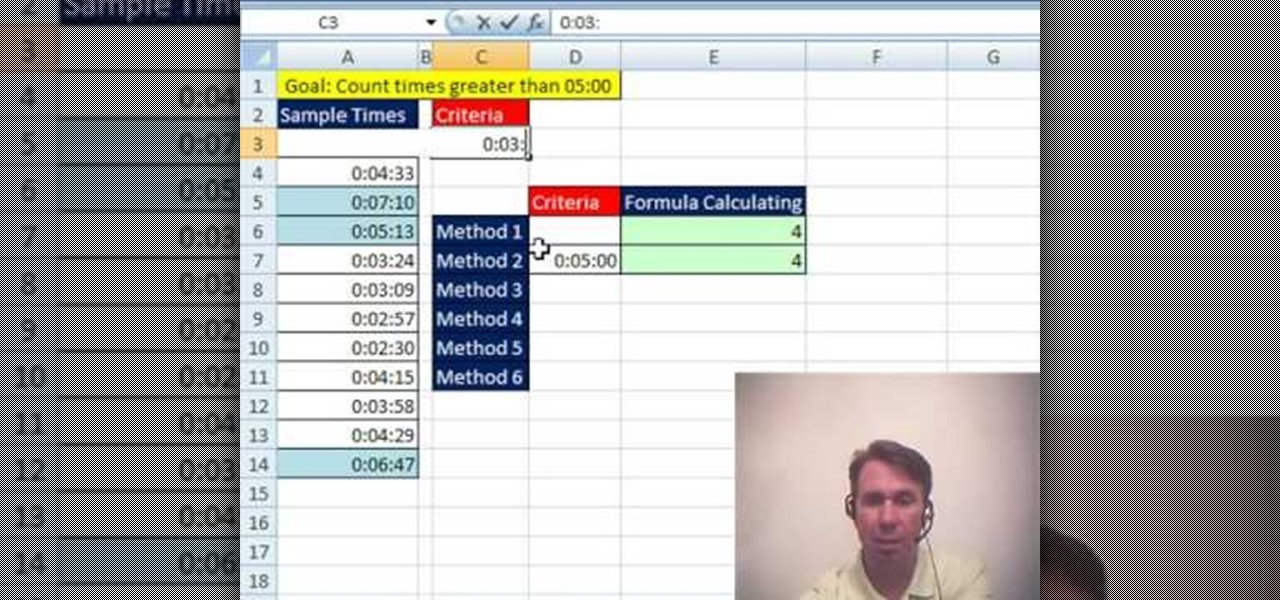
New to Microsoft Excel? Looking for a tip? How about a tip so mind-blowingly useful as to qualify as a magic trick? You're in luck. In this MS Excel tutorial from ExcelIsFun and Mr. Excel, the 17th installment in their joint series of digital spreadsheet magic tricks, you'll learn how to create 5 formulas to count times greater than five minutes using Excel's COUNTIF and TIME functions.

As you might guess, one of the domains in which Microsoft Excel really excels is business math. Brush up on the stuff for your next or current job with this how-to. In this tutorial from everyone's favorite digital spreadsheet guru, YouTube's ExcelIsFun, the 60th installment in his "Excel Business Math" series of free video lessons, you'll learn how to use the Excel functions FV and PMT to make a future value calculation for an annuity.

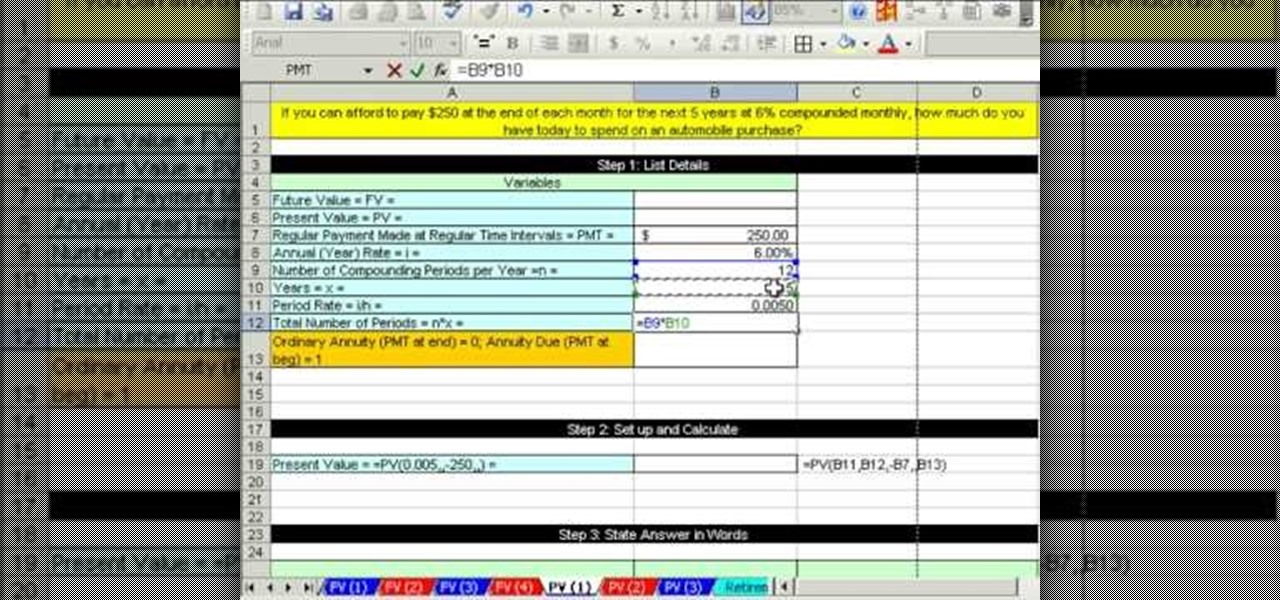
As you might guess, one of the domains in which Microsoft Excel really excels is business math. Brush up on the stuff for your next or current job with this how-to. In this tutorial from everyone's favorite digital spreadsheet guru, YouTube's ExcelIsFun, the 61st installment in his "Excel Business Math" series of free video lessons, you'll learn how to use the Excel functions PV and PMT to make a present value calculation for an annuity.

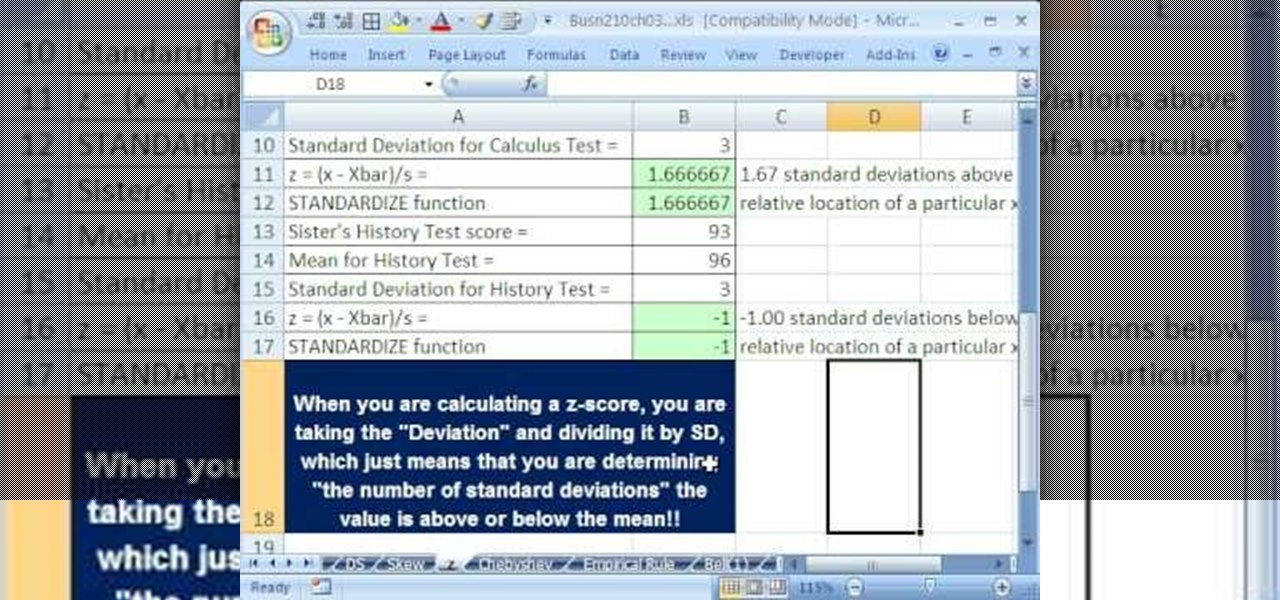
If you use Microsoft Excel on a regular basis, odds are you work with numbers. Put those numbers to work. Statistical analysis allows you to find patterns, trends and probabilities within your data. In this MS Excel tutorial from everyone's favorite Excel guru, YouTube's ExcelsFun, the 45th installment in his "Excel Statistics" series of free video lessons, you'll learn how to see how to calculate a z-score.

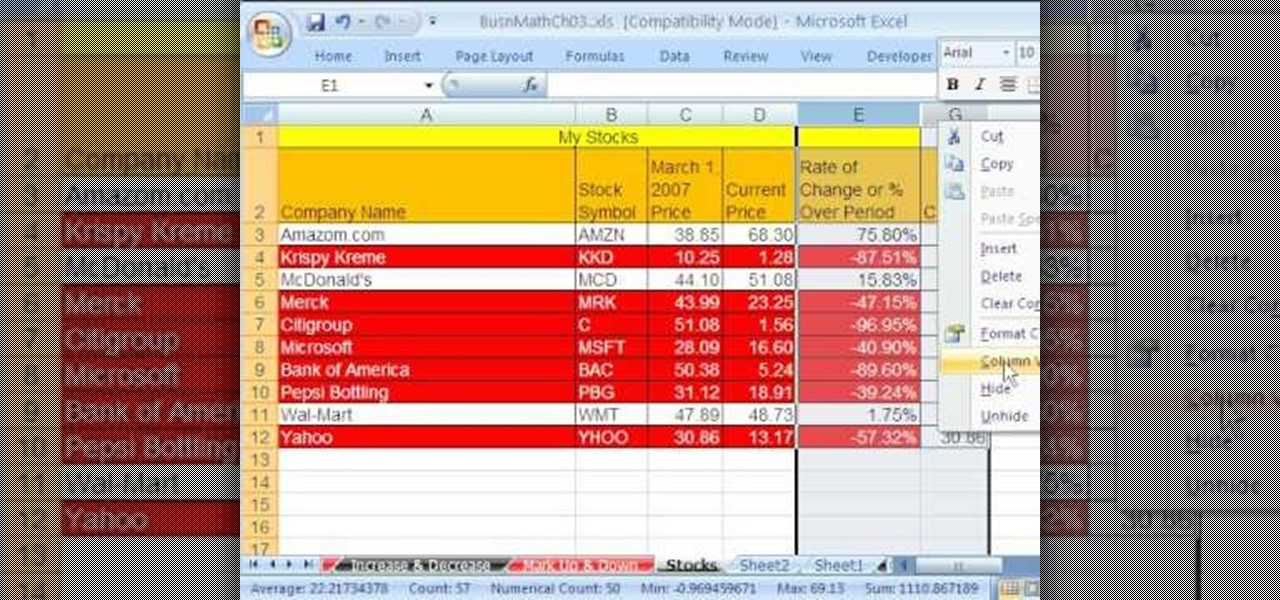
As you might guess, one of the domains in which Microsoft Excel really excels is business math. Brush up on the stuff for your next or current job with this how-to. In this tutorial from everyone's favorite digital spreadsheet guru, YouTube's ExcelIsFun, the 33rd installment in his "Excel Business Math" series of free video lessons, you'll learn how to add current stock prices to a stock analysis table in Excel using a web query.

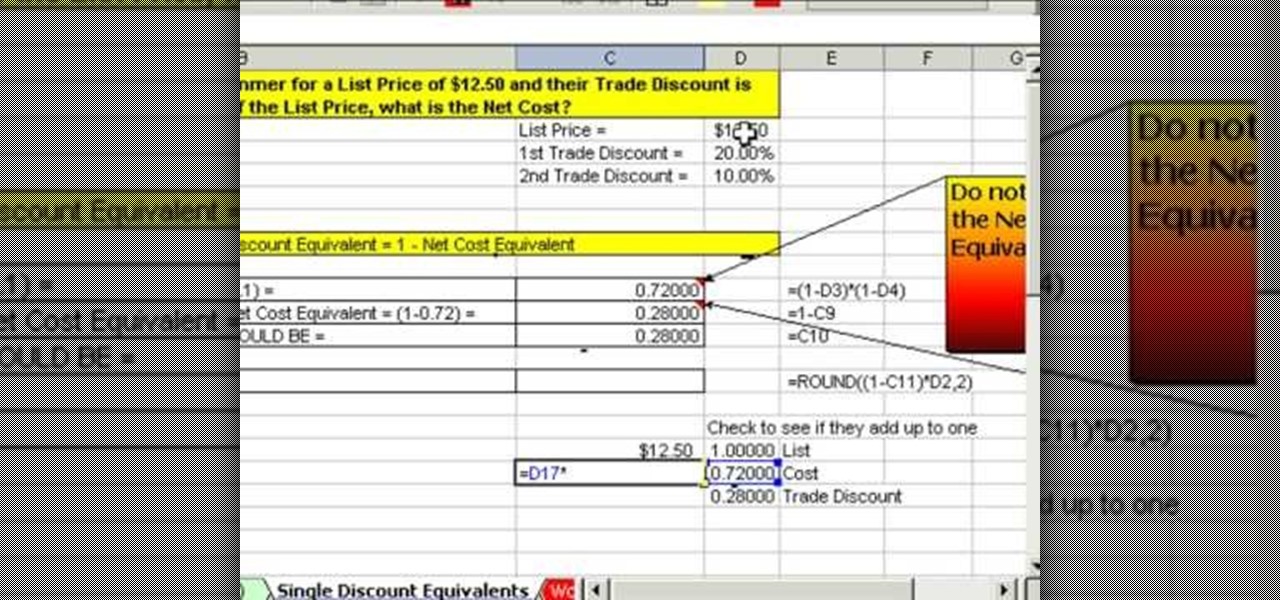
As you might guess, one of the domains in which Microsoft Excel really excels is business math. Brush up on the stuff for your next or current job with this how-to. In this tutorial from everyone's favorite digital spreadsheet guru, YouTube's ExcelIsFun, the 44th installment in his "Excel Business Math" series of free video lessons, you'll learn how to work with series trade discounts in MS Excel.

As you might guess, one of the domains in which Microsoft Excel really excels is business math. Brush up on the stuff for your next or current job with this how-to. In this tutorial from everyone's favorite digital spreadsheet guru, YouTube's ExcelIsFun, the 38th installment in his "Excel Business Math" series of free video lessons, you'll learn how to calculate gross and overtime pay in MS Excel.

As you might guess, one of the domains in which Microsoft Excel really excels is business math. Brush up on the stuff for your next or current job with this how-to. In this tutorial from everyone's favorite digital spreadsheet guru, YouTube's ExcelIsFun, the 2nd installment in his "Beauty of Excel" series of free video lessons, you'll learn how to set up the input/assumption area for formulas so that subsequent formulas, functions and charts update beautifully. Learn how to build Excel spread...

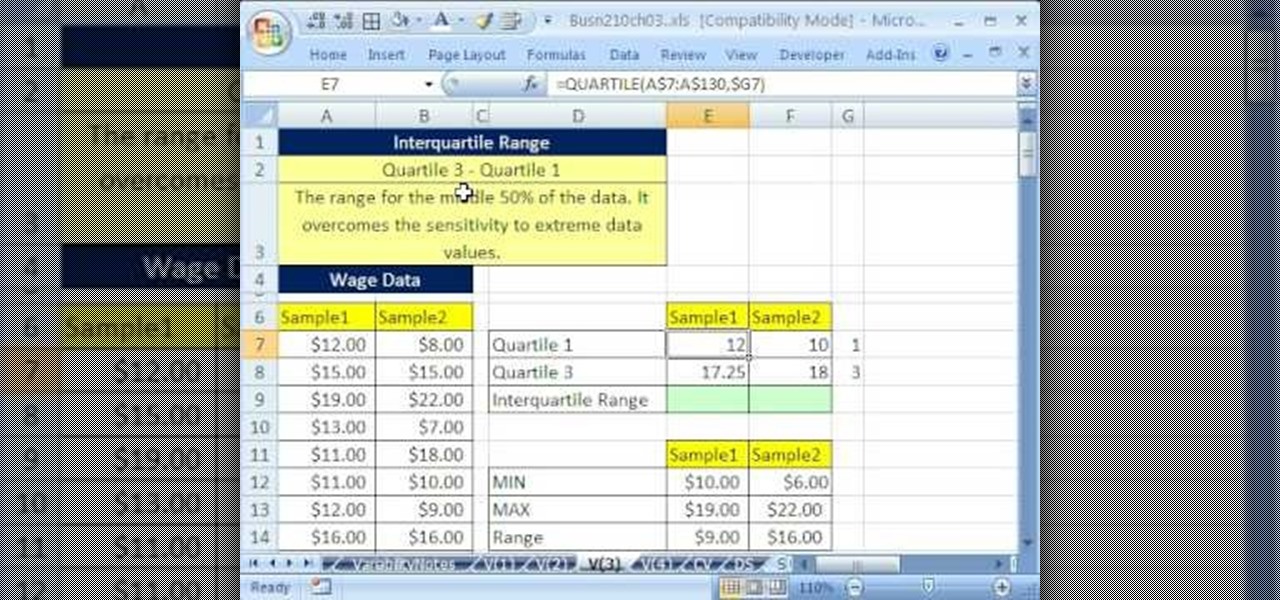
If you use Microsoft Excel on a regular basis, odds are you work with numbers. Put those numbers to work. Statistical analysis allows you to find patterns, trends and probabilities within your data. In this MS Excel tutorial from everyone's favorite Excel guru, YouTube's ExcelsFun, the 40th installment in his "Excel Statistics" series of free video lessons, you'll learn how to calculate range & interquartile range for variability using the MAX, MIN, QUARTILE functions.

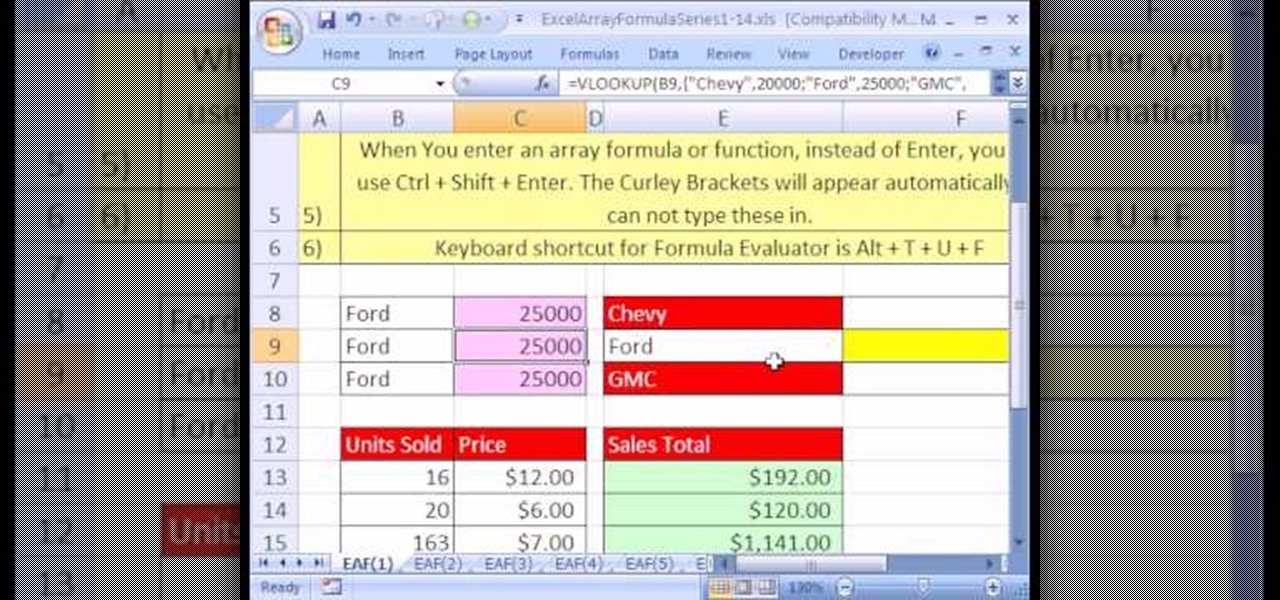
Looking for a primer on how to create and work with arrays in Microsoft Office Excel? You've come to the right place. In this free video tutorial from everyone's favorite MS Excel guru, YouTube's ExcelIsFun, the very first installment in his series of Excel array formula series, you'll learn how to create a basic array formula. Learn about the syntax, the Ctrl + Shift + Enter method of formula entry and the curly brackets that get entered automatically by Excel.

Looking for a primer on how to create and work with names in Microsoft Office Excel? You've come to the right place. In this free video tutorial from everyone's favorite MS Excel guru, YouTube's ExcelIsFun, the 12th installment in his series of Excel name tricks, you'll learn how to use the built-in dynamic range names in Excel 2007 Tables.

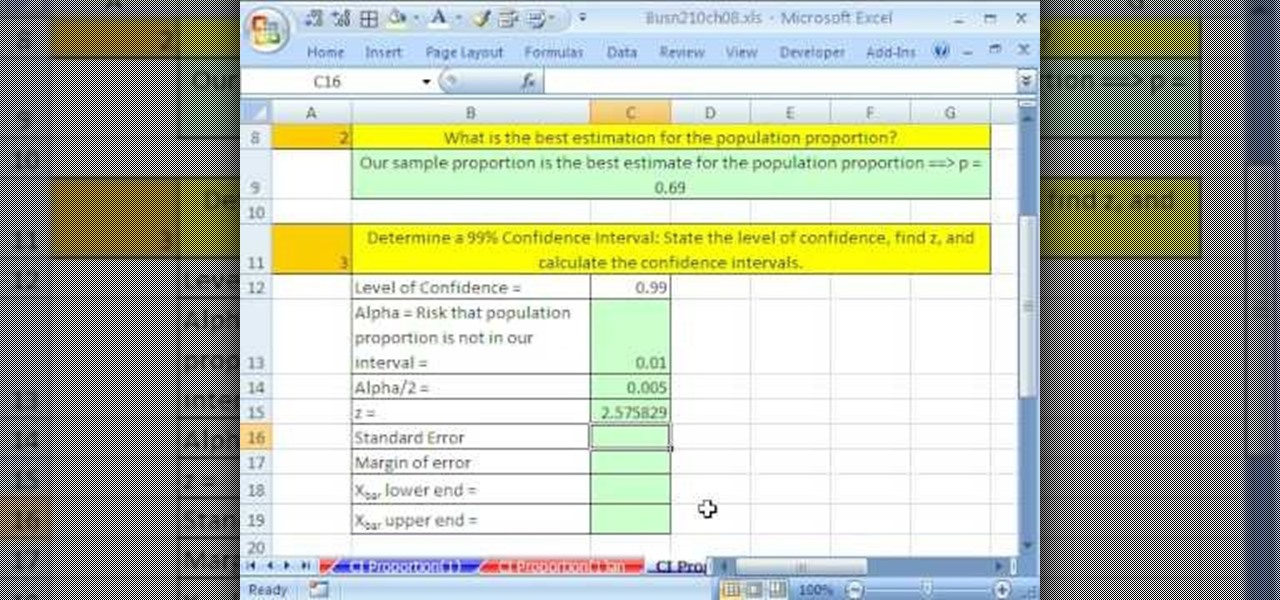
If you use Microsoft Excel on a regular basis, odds are you work with numbers. Put those numbers to work. Statistical analysis allows you to find patterns, trends and probabilities within your data. In this MS Excel tutorial from everyone's favorite Excel guru, YouTube's ExcelsFun, the 86th installment in his "Excel Statistics" series of free video lessons, you'll learn how to construct confidence intervals for proportions using NORMSINV function and other formulas.

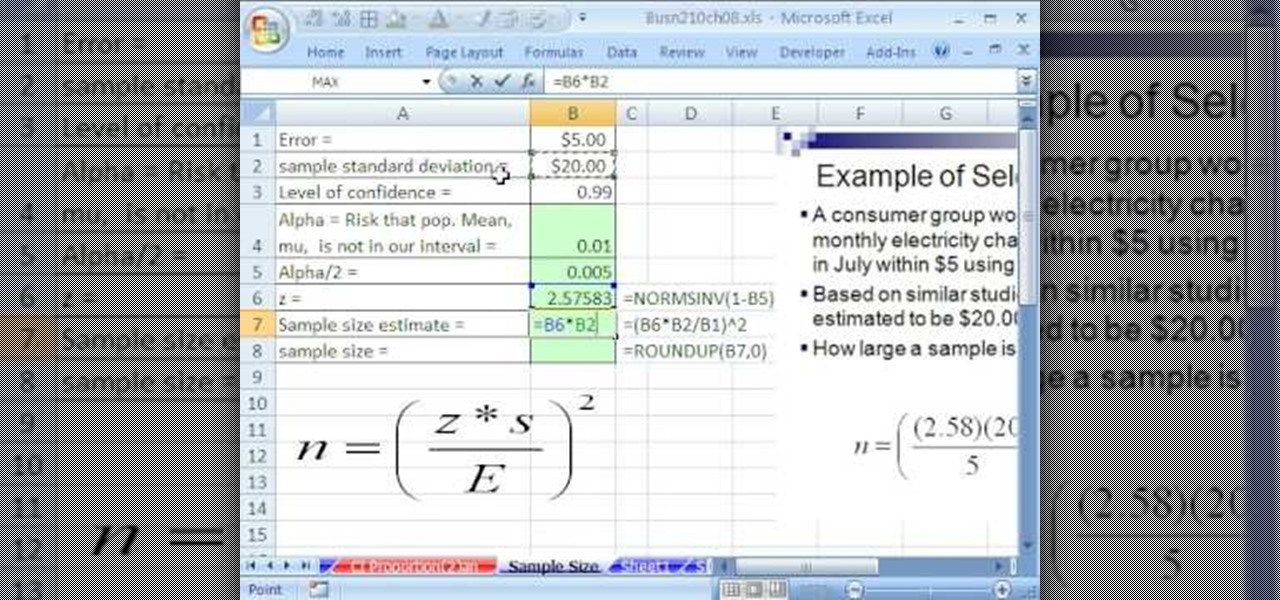
If you use Microsoft Excel on a regular basis, odds are you work with numbers. Put those numbers to work. Statistical analysis allows you to find patterns, trends and probabilities within your data. In this MS Excel tutorial from everyone's favorite Excel guru, YouTube's ExcelsFun, the 87th installment in his "Excel Statistics" series of free video lessons, you'll learn how to calculate sample size (n) for confidence intervals.

If you use Microsoft Excel on a regular basis, odds are you work with numbers. Put those numbers to work. Statistical analysis allows you to find patterns, trends and probabilities within your data. In this MS Excel tutorial from everyone's favorite Excel guru, YouTube's ExcelsFun, the 27th installment in his "Excel Statistics" series of free video lessons, you'll learn how to create a quantitative data dot plot chart using the REPT and COUNTIF functions.

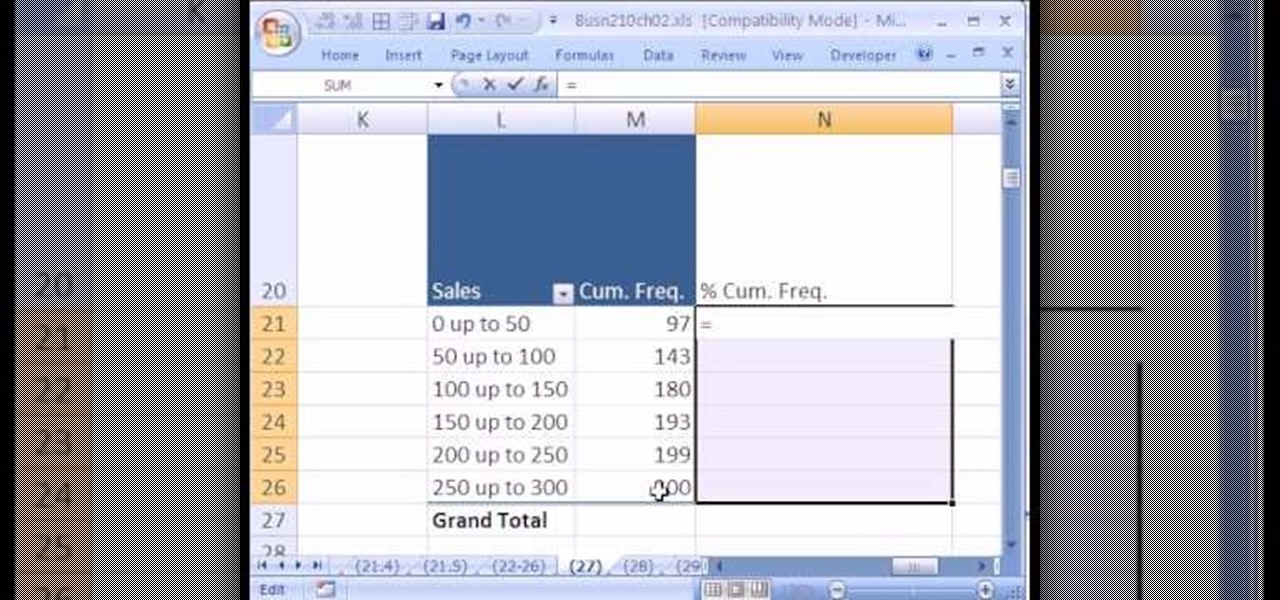
If you use Microsoft Excel on a regular basis, odds are you work with numbers. Put those numbers to work. Statistical analysis allows you to find patterns, trends and probabilities within your data. In this MS Excel tutorial from everyone's favorite Excel guru, YouTube's ExcelsFun, the 26th installment in his "Excel Statistics" series of free video lessons, you'll learn how to create quantitative data cumulative frequency distributions with pivot tables.

If you use Microsoft Excel on a regular basis, odds are you work with numbers. Put those numbers to work. Statistical analysis allows you to find patterns, trends and probabilities within your data. In this MS Excel tutorial from everyone's favorite Excel guru, YouTube's ExcelsFun, the 16th installment in his "Excel Statistics" series of free video lessons, you'll learn how to cross tabulate & do percentage cross tabulation for categorical data using a pivot table (PivotTable).

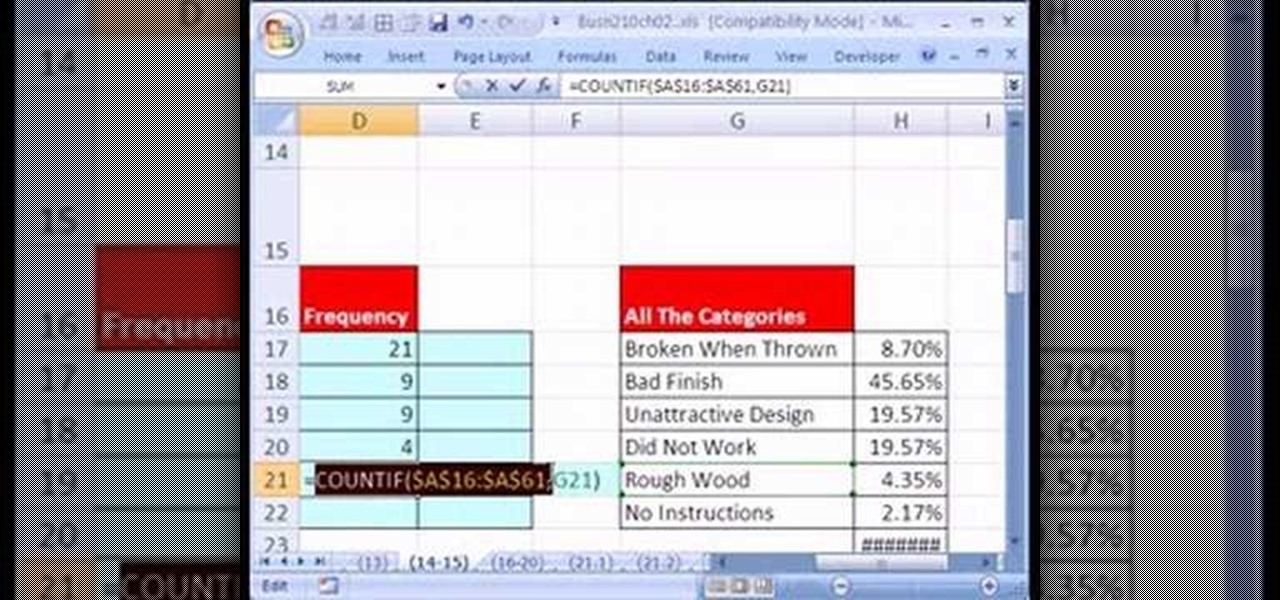
If you use Microsoft Excel on a regular basis, odds are you work with numbers. Put those numbers to work. Statistical analysis allows you to find patterns, trends and probabilities within your data. In this MS Excel tutorial from everyone's favorite Excel guru, YouTube's ExcelsFun, the 19th installment in his "Excel Statistics" series of free video lessons, you'll learn how to group categories in a frequency distribution with a formula (2 COUNTIF) and the pivot table (PivotTable) grouping fea...


