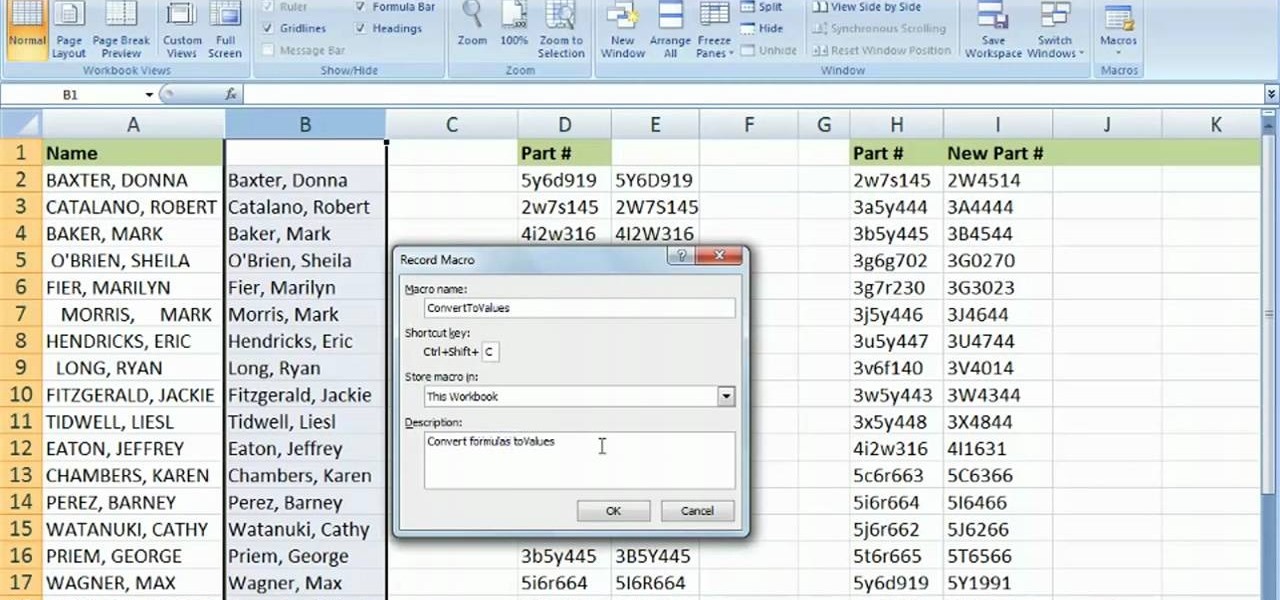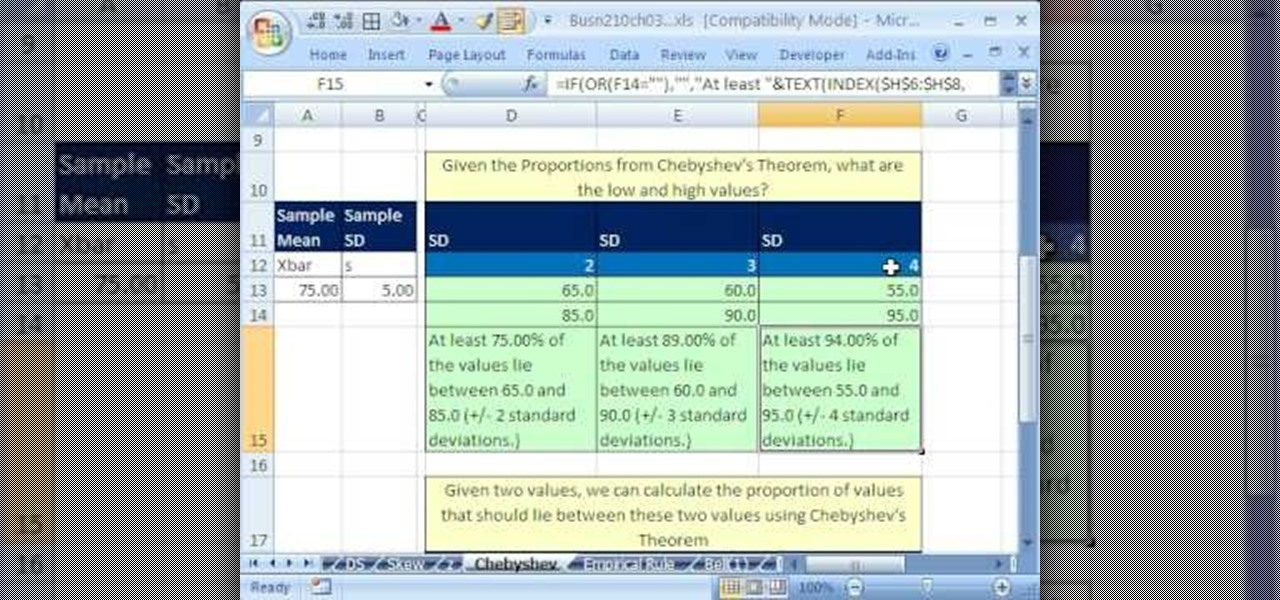
If you use Microsoft Excel on a regular basis, odds are you work with numbers. Put those numbers to work. Statistical analysis allows you to find patterns, trends and probabilities within your data. In this MS Excel tutorial from everyone's favorite Excel guru, YouTube's ExcelsFun, the 46th installment in his "Excel Statistics" series of free video lessons, you'll learn about Chebyshev's Theorem and how to apply it in three different ways.
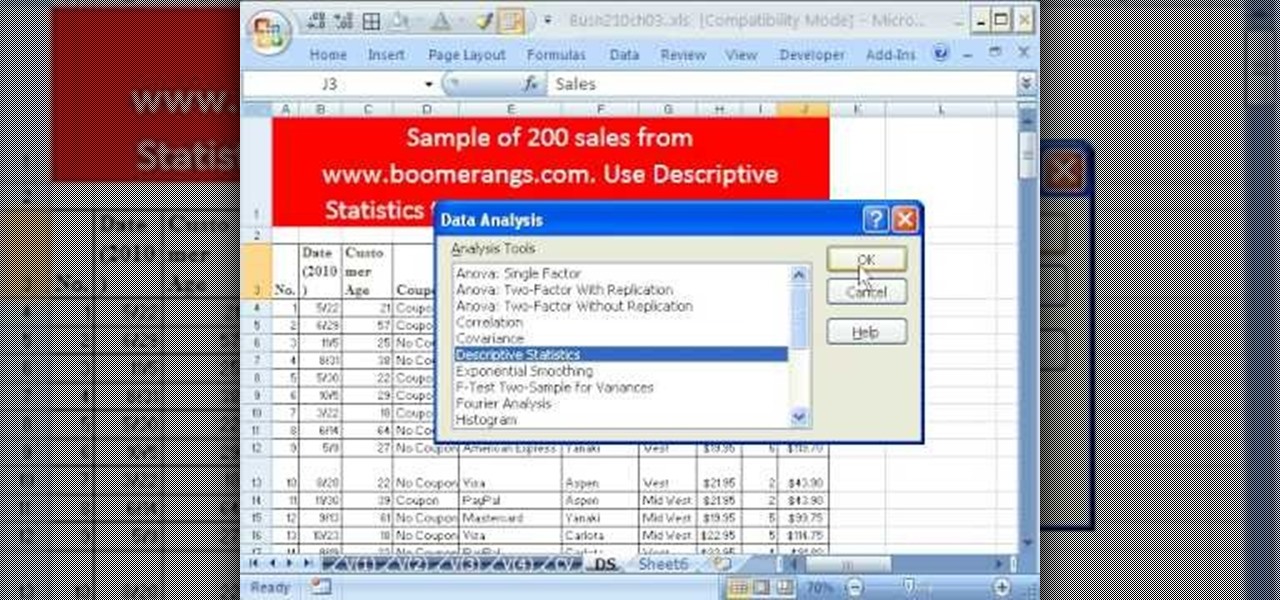
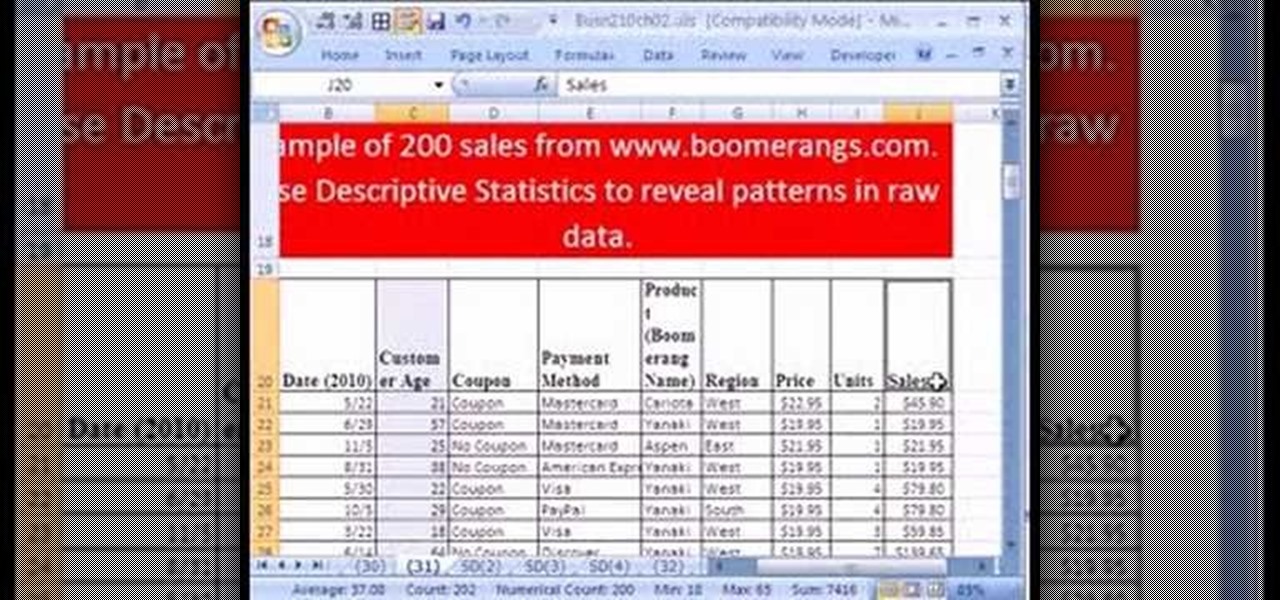
If you use Microsoft Excel on a regular basis, odds are you work with numbers. Put those numbers to work. Statistical analysis allows you to find patterns, trends and probabilities within your data. In this MS Excel tutorial from everyone's favorite Excel guru, YouTube's ExcelsFun, the 43rd installment in his "Excel Statistics" series of free video lessons, you'll learn how to use the Excel Data Analysis add-in descriptive statistics tool.
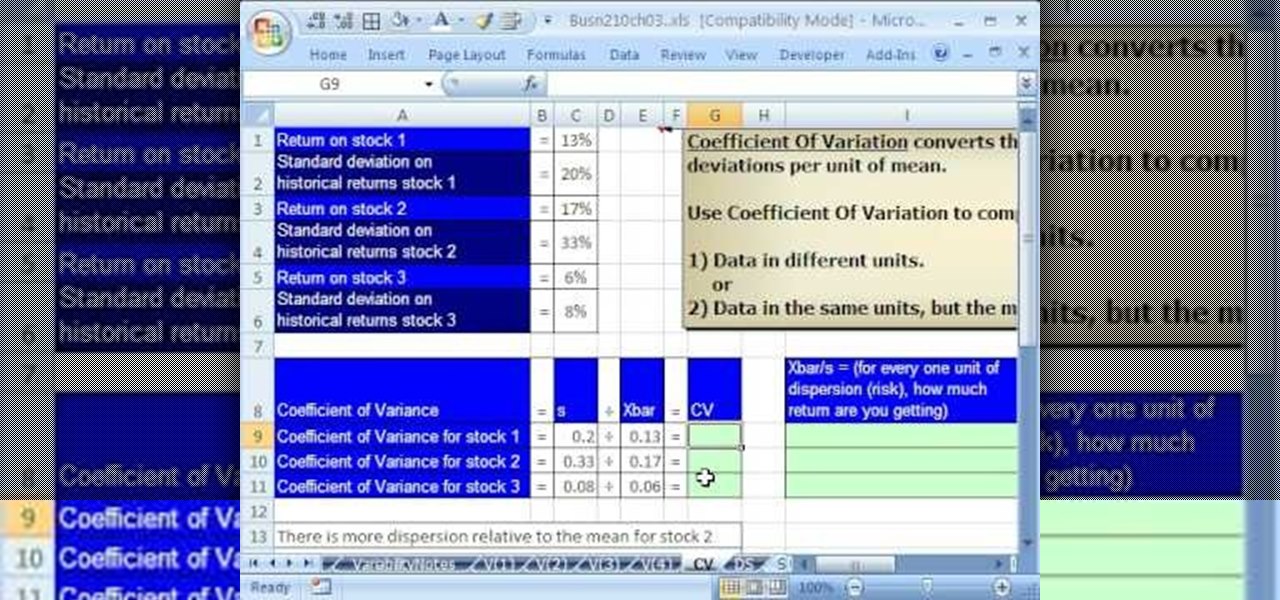
If you use Microsoft Excel on a regular basis, odds are you work with numbers. Put those numbers to work. Statistical analysis allows you to find patterns, trends and probabilities within your data. In this MS Excel tutorial from everyone's favorite Excel guru, YouTube's ExcelsFun, the 42nd installment in his "Excel Statistics" series of free video lessons, you'll learn how to calculate the coefficient of variation.

As you might guess, one of the domains in which Microsoft Excel really excels is business math. Brush up on the stuff for your next or current job with this how-to. In this tutorial from everyone's favorite digital spreadsheet guru, YouTube's ExcelIsFun, the 34th installment in his "Excel Business Math" series of free video lessons, you'll learn how to work with the various elements of bank checks in Microsoft Excel.
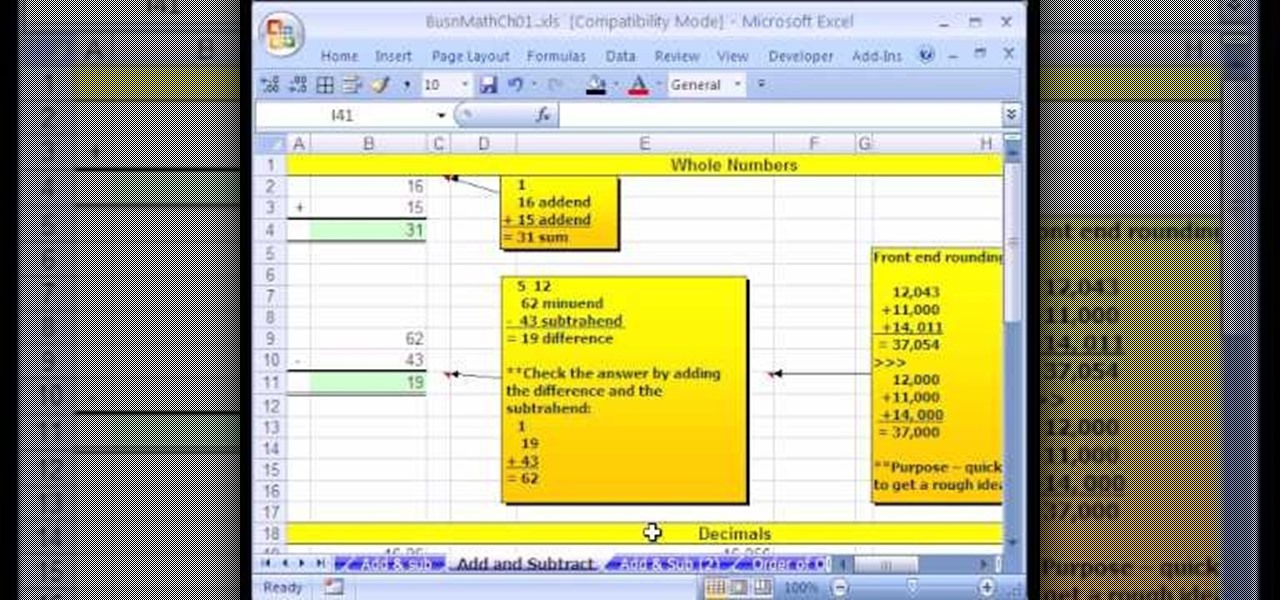
As you might guess, one of the domains in which Microsoft Excel really excels is business math. Brush up on the stuff for your next or current job with this how-to. In this tutorial from everyone's favorite digital spreadsheet guru, YouTube's ExcelIsFun, the 10th installment in his "Excel Business Math" series of free video lessons, you'll learn how to add and subtract using the SUM function.
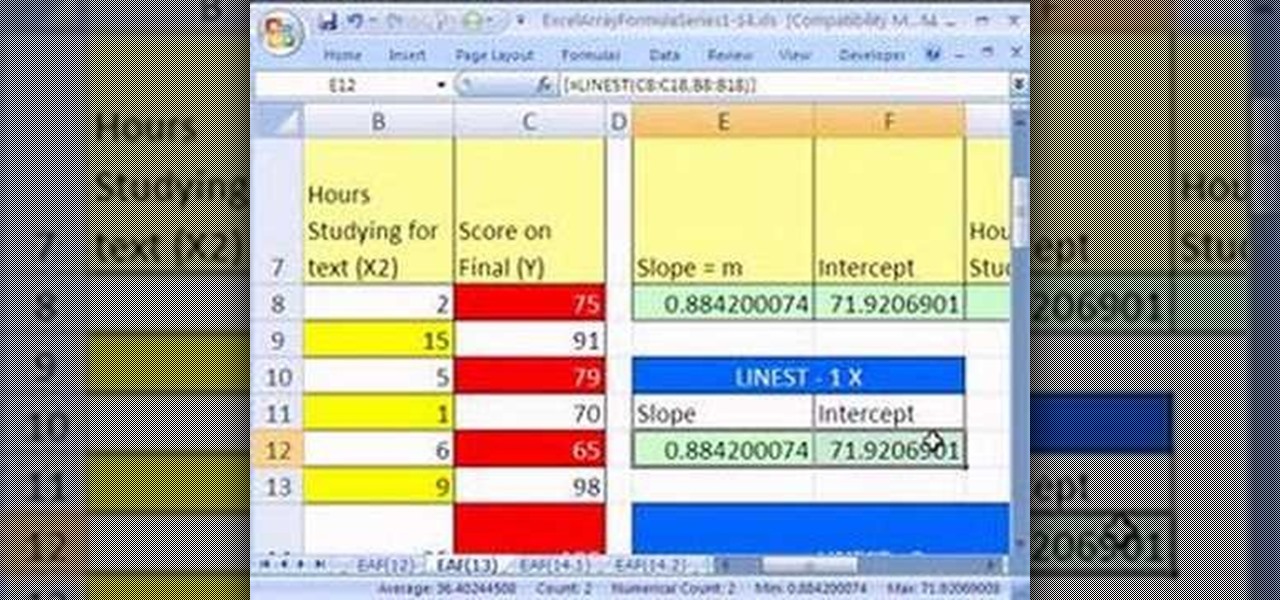
Looking for a primer on how to create and work with array formulas in Microsoft Office Excel? You've come to the right place. In this free video tutorial from everyone's favorite MS Excel guru, YouTube's ExcelIsFun, the 13th installment in his series of Excel array formula series, you'll learn how to do multiple regression and linear algebra problems with Excel's LINEST array function. Also see how to use the SLOPE, INTERCEPT and the FORECAST functions for linear algebra and how to create a s...

As you might guess, one of the domains in which Microsoft Excel really excels is business math. Brush up on the stuff for your next or current job with this how-to. In this tutorial from everyone's favorite digital spreadsheet guru, YouTube's ExcelIsFun, the very first installment in his "Beauty of Excel" series of free video lessons, you'll learn how to create a contribution margin income statement across various units sold.

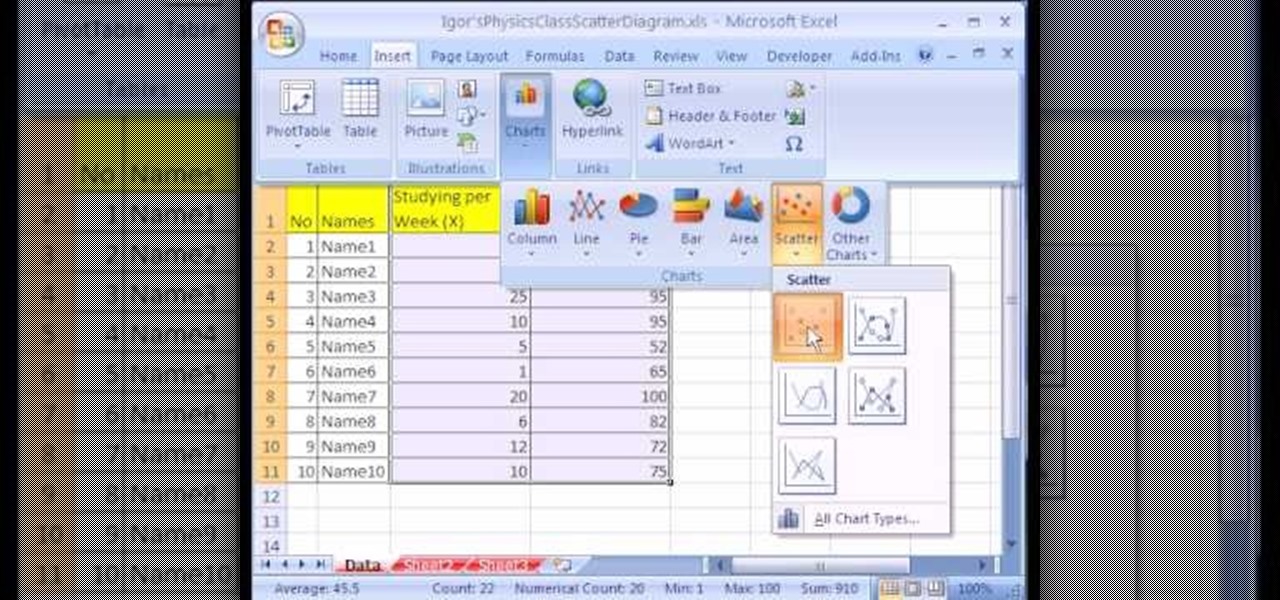
If you use Microsoft Excel on a regular basis, odds are you work with numbers. Put those numbers to work. Statistical analysis allows you to find patterns, trends and probabilities within your data. In this MS Excel tutorial from everyone's favorite Excel guru, YouTube's ExcelsFun, the 30th installment in his "Excel Statistics" series of free video lessons, you'll learn how to create a scatter diagram for 2 quantitative variables.

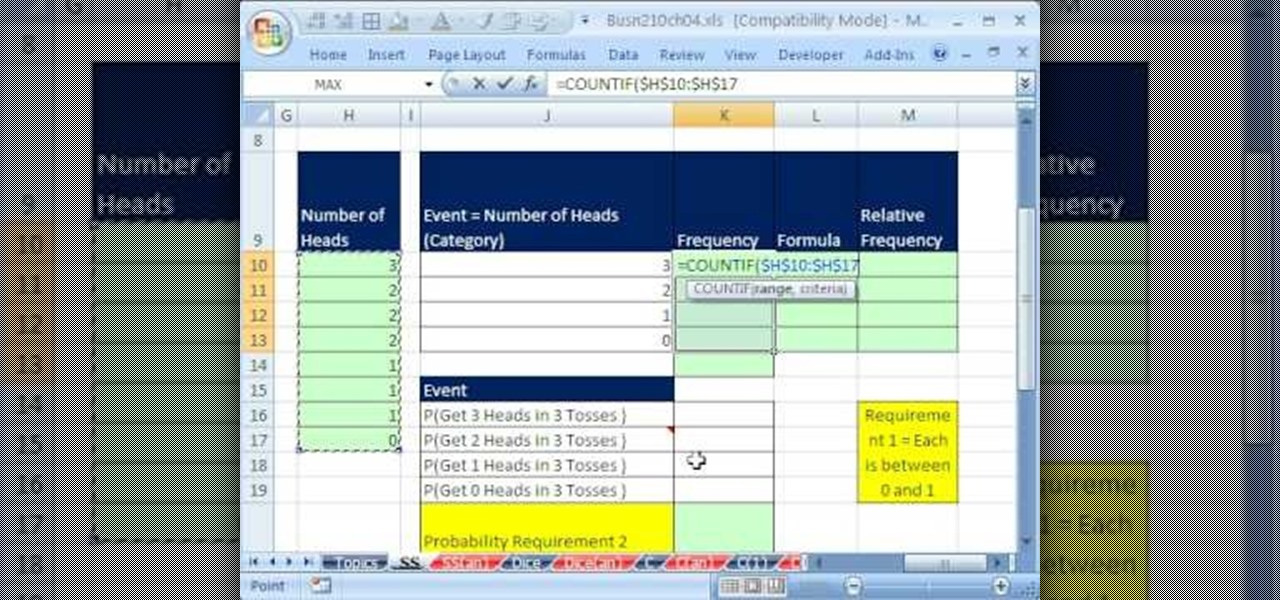
If you use Microsoft Excel on a regular basis, odds are you work with numbers. Put those numbers to work. Statistical analysis allows you to find patterns, trends and probabilities within your data. In this MS Excel tutorial from everyone's favorite Excel guru, YouTube's ExcelsFun, the 51st installment in his "Excel Statistics" series of free video lessons, you'll learn how to understand, work with and find simple probabilities in Microsoft Office Excel.

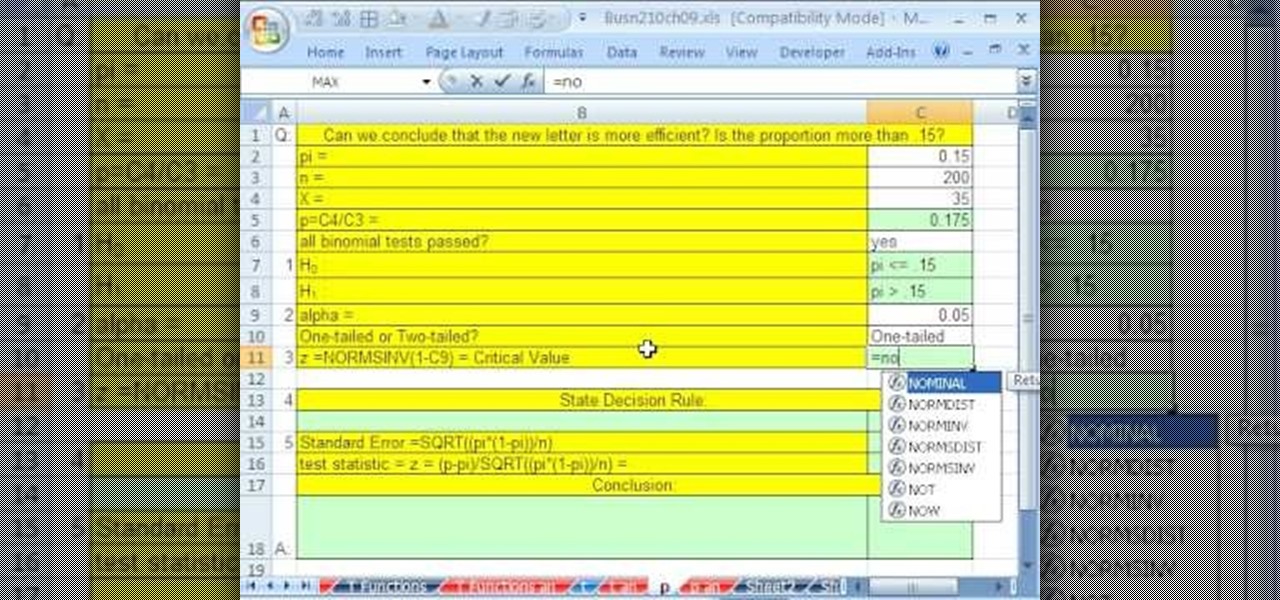
If you use Microsoft Excel on a regular basis, odds are you work with numbers. Put those numbers to work. Statistical analysis allows you to find patterns, trends and probabilities within your data. In this MS Excel tutorial from everyone's favorite Excel guru, YouTube's ExcelsFun, the 93rd installment in his "Excel Statistics" series of free video lessons, you'll learn how to use the NORMSINV and NORMSDIST functions to complete a hypothesis test about a population proportion.

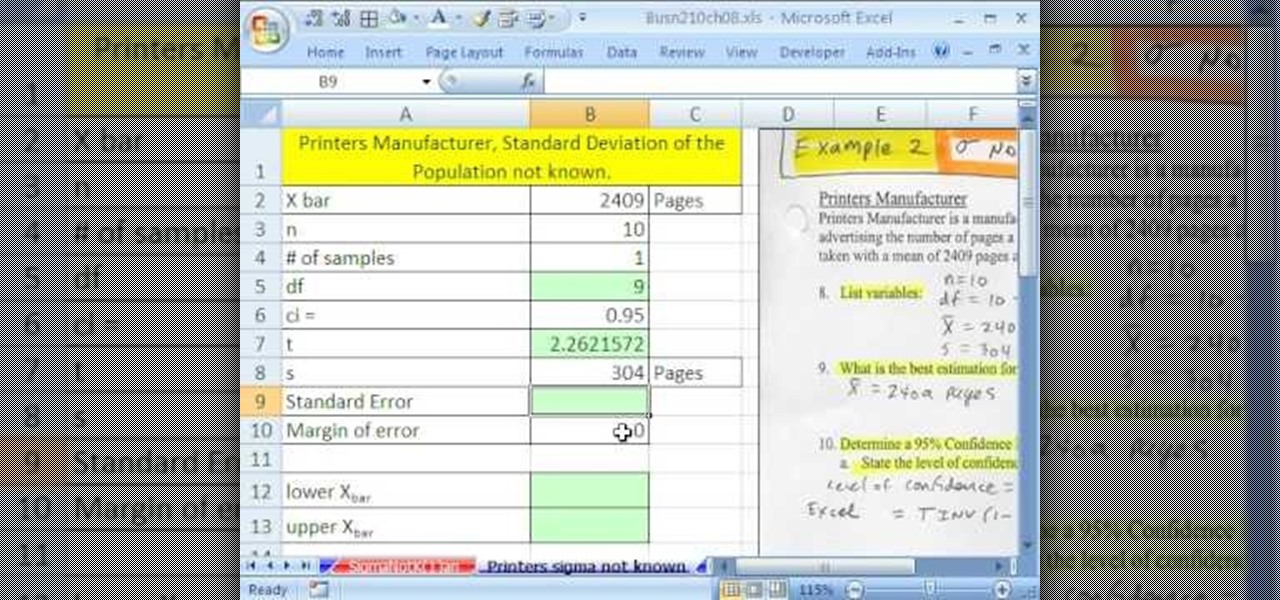
If you use Microsoft Excel on a regular basis, odds are you work with numbers. Put those numbers to work. Statistical analysis allows you to find patterns, trends and probabilities within your data. In this MS Excel tutorial from everyone's favorite Excel guru, YouTube's ExcelsFun, the 83rd installment in his "Excel Statistics" series of free video lessons, you'll learn how to construct confidence intervals when the sigma (population standard deviation) in NOT known using the TINV function.

If you use Microsoft Excel on a regular basis, odds are you work with numbers. Put those numbers to work. Statistical analysis allows you to find patterns, trends and probabilities within your data. In this MS Excel tutorial from everyone's favorite Excel guru, YouTube's ExcelsFun, the 29th installment in his "Excel Statistics" series of free video lessons, you'll learn how to create quantitative data cross tabulation using a pivot table (PivotTable).

If you use Microsoft Excel on a regular basis, odds are you work with numbers. Put those numbers to work. Statistical analysis allows you to find patterns, trends and probabilities within your data. In this MS Excel tutorial from everyone's favorite Excel guru, YouTube's ExcelsFun, the 11th installment in his "Excel Statistics" series of free video lessons, you'll learn how to work with, and create charts for, cross-sectional and time-series data.

If you use Microsoft Excel on a regular basis, odds are you work with numbers. Put those numbers to work. Statistical analysis allows you to find patterns, trends and probabilities within your data. In this MS Excel tutorial from everyone's favorite Excel guru, YouTube's ExcelsFun, the 13th installment in his "Excel Statistics" series of free video lessons, you'll learn how to install the Excel 2007 Data Analysis add-in.

If you use Microsoft Excel on a regular basis, odds are you work with numbers. Put those numbers to work. Statistical analysis allows you to find patterns, trends and probabilities within your data. In this MS Excel tutorial from everyone's favorite Excel guru, YouTube's ExcelsFun, the very first installment in his "Excel Statistics" series of free video lessons, you'll learn how to get started doing statistical analysis in Microsoft Excel 2007.

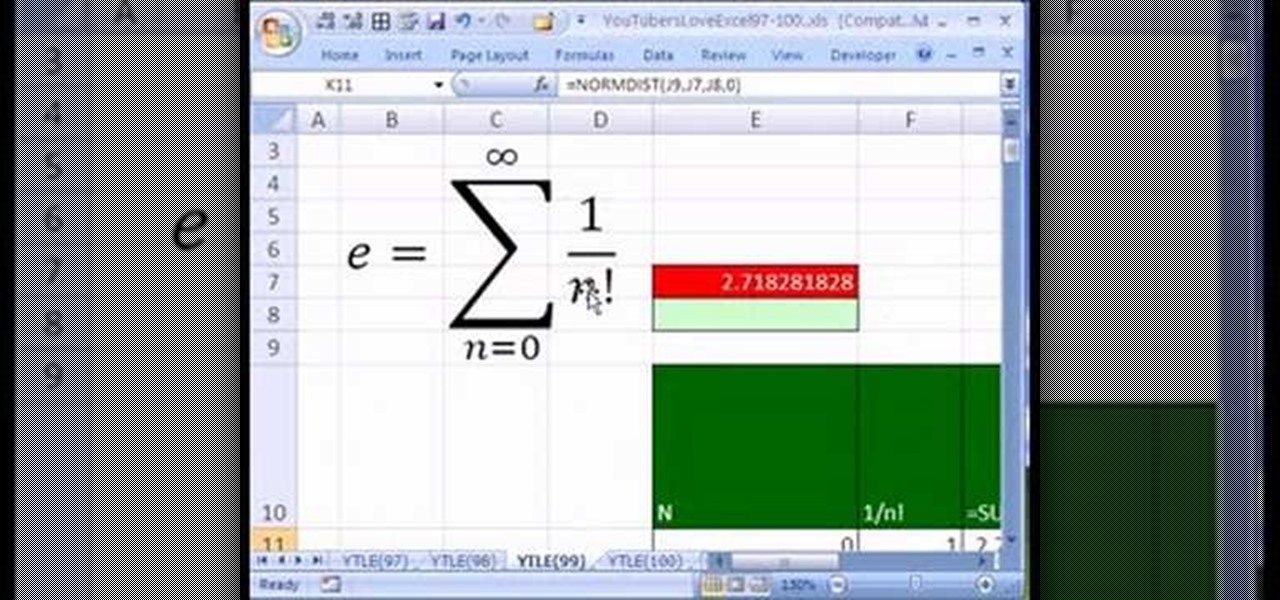
Love Microsoft Excel? This clip contains a tip that just might induce you to. With this free video tutorial from ExcelIsFun, the 99th installment of his "YouTubers Love Excel" or YTLE series of free video MS Excel lessons, you'll learn how to create and use the mathematical constant e in Excel. Also learn about the EXP function.

Love Microsoft Excel? This clip contains a tip that just might induce you to. With this free video tutorial from ExcelIsFun, the 58th installment of his "YouTubers Love Excel" or YTLE series of free video MS Excel lessons, you'll learn how to use the Excel 2007 table dynamic range feature with a data validation drop-down list without using the table name!

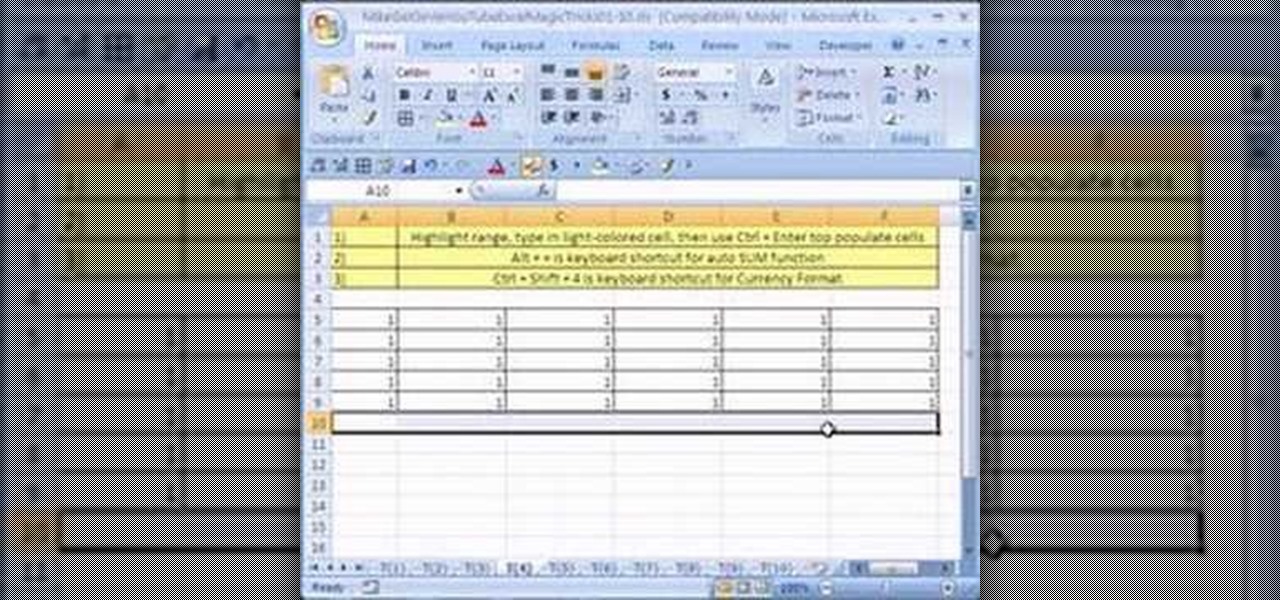
New to Microsoft Excel? Looking for a tip? How about a tip so mind-blowingly useful as to qualify as a magic trick? You're in luck. In this MS Excel tutorial from ExcelIsFun, the 4th installment in their series of digital spreadsheet magic tricks, you'll learn how to add data or a formula to a range of cells by using the Excel's ever-useful ctrl+enter keyboard shortcut.

New to Microsoft Excel? Looking for a tip? How about a tip so mind-blowingly useful as to qualify as a magic trick? You're in luck. In this MS Excel tutorial from ExcelIsFun, the 8th installment in their series of digital spreadsheet magic tricks, you'll learn how to take a column of text and break it apart into separate columns using Excel's text-to-column tool.

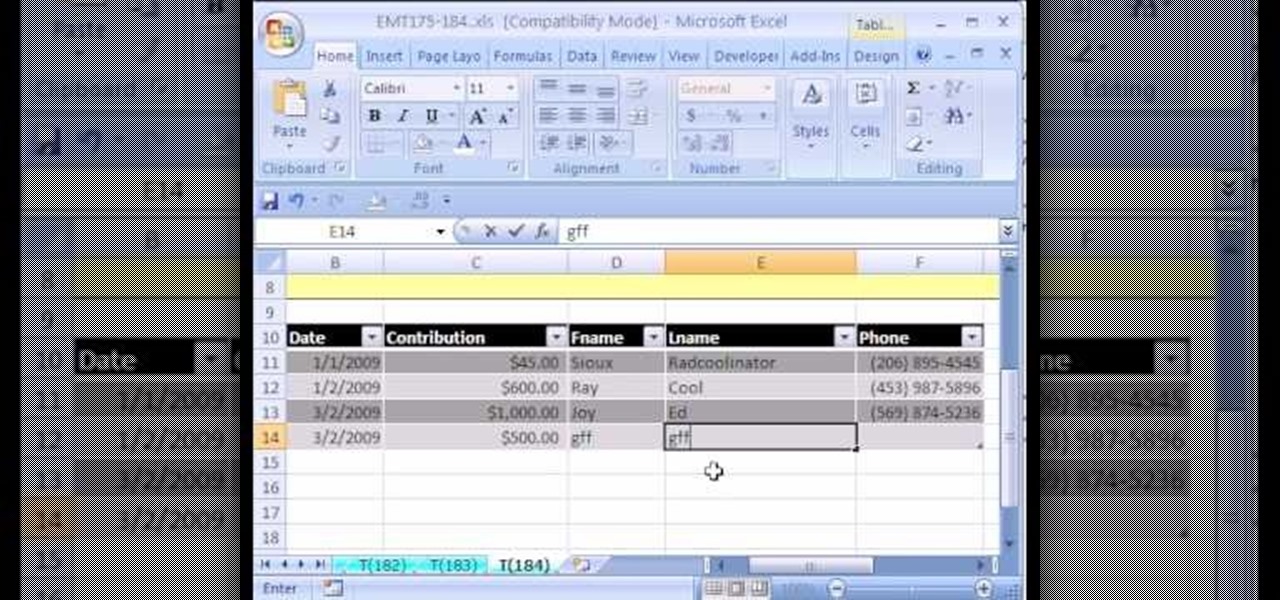
New to Microsoft Excel? Looking for a tip? How about a tip so mind-blowingly useful as to qualify as a magic trick? You're in luck. In this MS Excel tutorial from ExcelIsFun, the 168th installment in their series of digital spreadsheet magic tricks, you'll learn how to create a simple dynamic database in Excel using lists in Excel 2003 and tables in 2007.

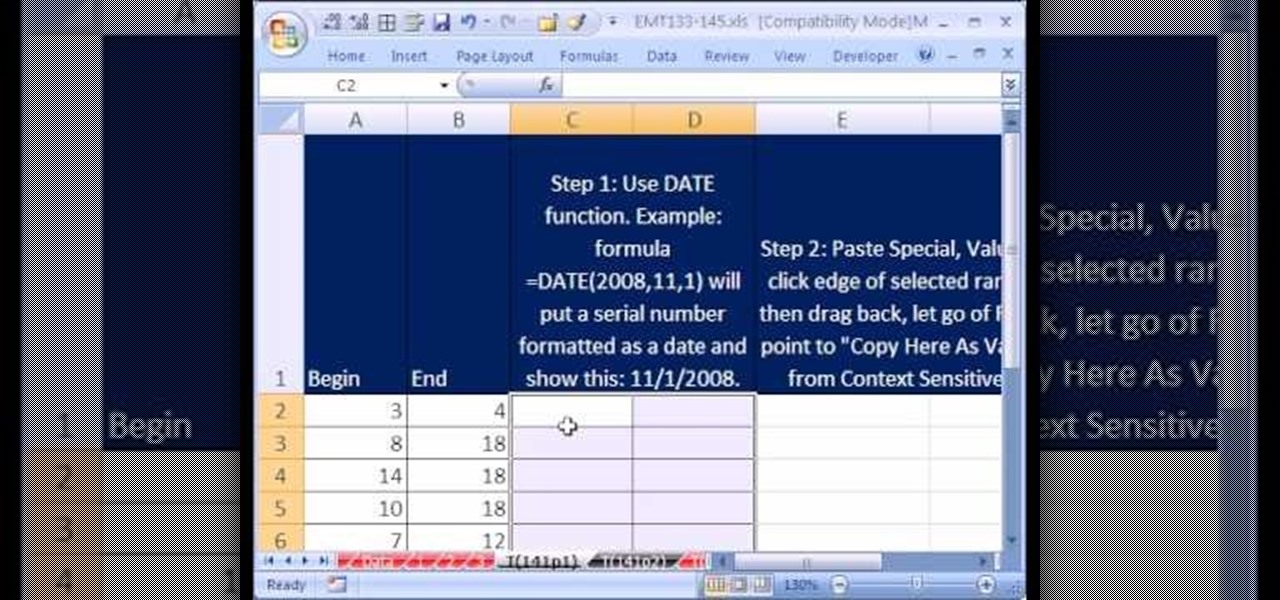
New to Microsoft Excel? Looking for a tip? How about a tip so mind-blowingly useful as to qualify as a magic trick? You're in luck. In this MS Excel tutorial from ExcelIsFun, the 141st installment in their series of digital spreadsheet magic tricks, you'll learn how to take the number 1 (for day one of the month) and use the DATE function to convert it to a serial number formatted as a date.

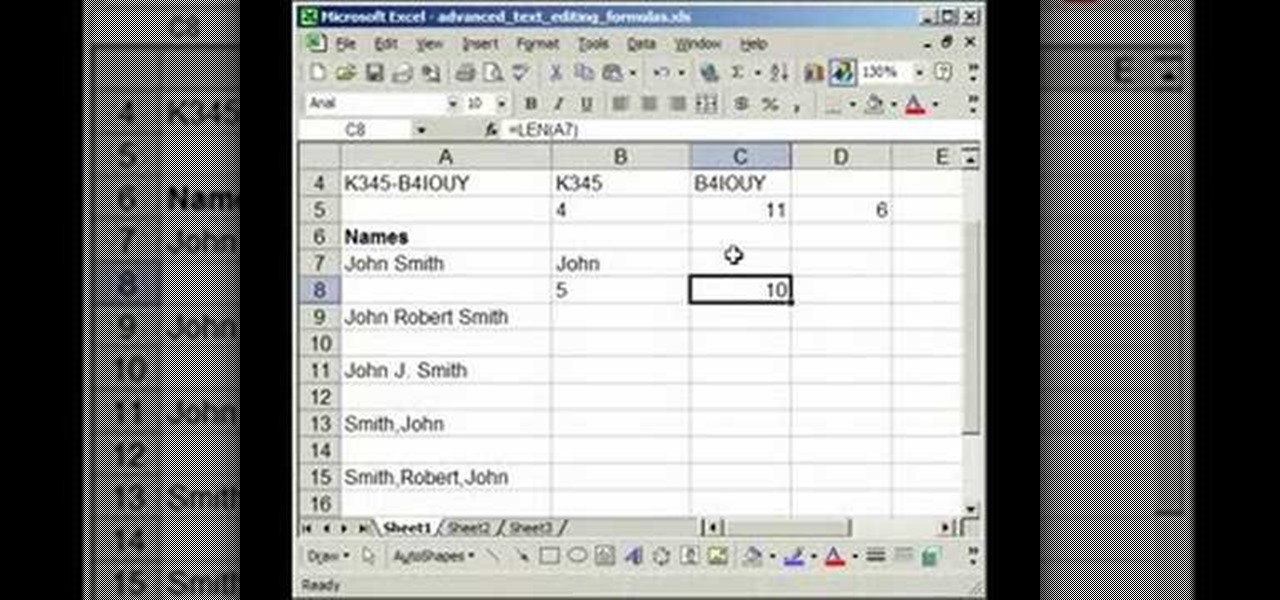
Mastering your Excel skills? Have a busy Excel workbook or spreadsheet that needs to some organizing? In this two-part tutorial, learn how to pull text from cells & separate them into multiple columns in MS Excel. You will learn how to use the LEN(), FIND(), LEFT(), and RIGHT() functions to pull text from Microsoft Excel 2007 cells & assign them to different columns.

Microsoft Office Excel 2007 spreadsheet manager is a powerful tool that enables information workers to format spreadsheets, as well as analyze and share information to make more informed decisions. In this MS Excel video tutorial, you'll learn about using '$' to prevent excel from changing formulae when copying or filling ranges. For more on absolute cell referencing, watch this Microsoft Excel how-to.

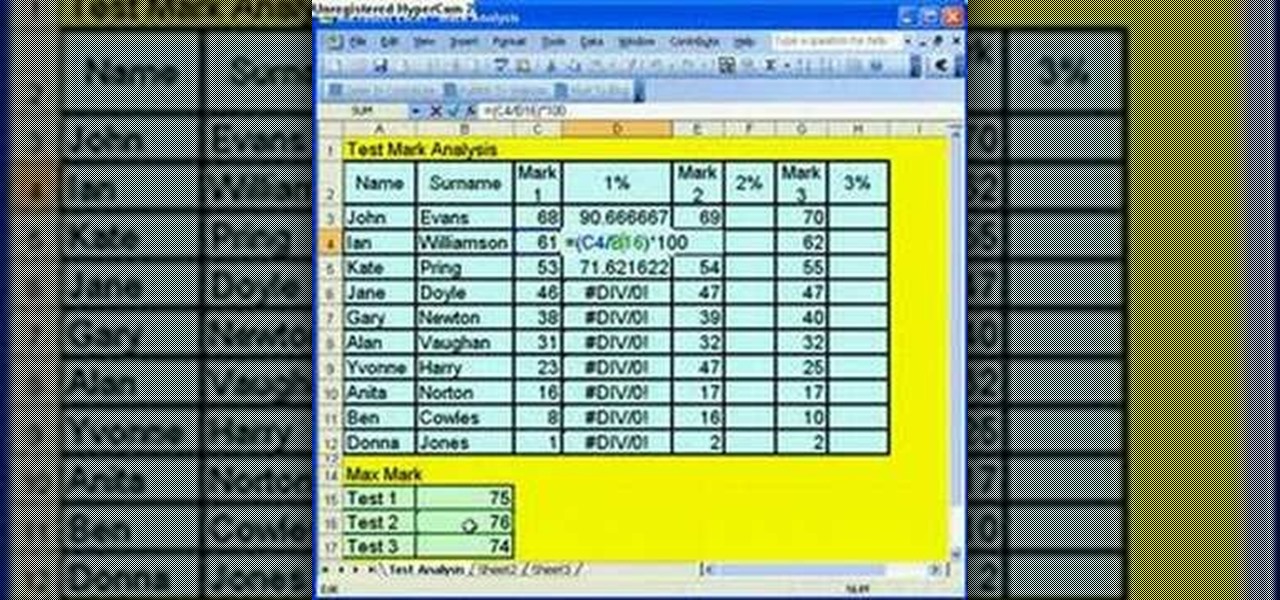
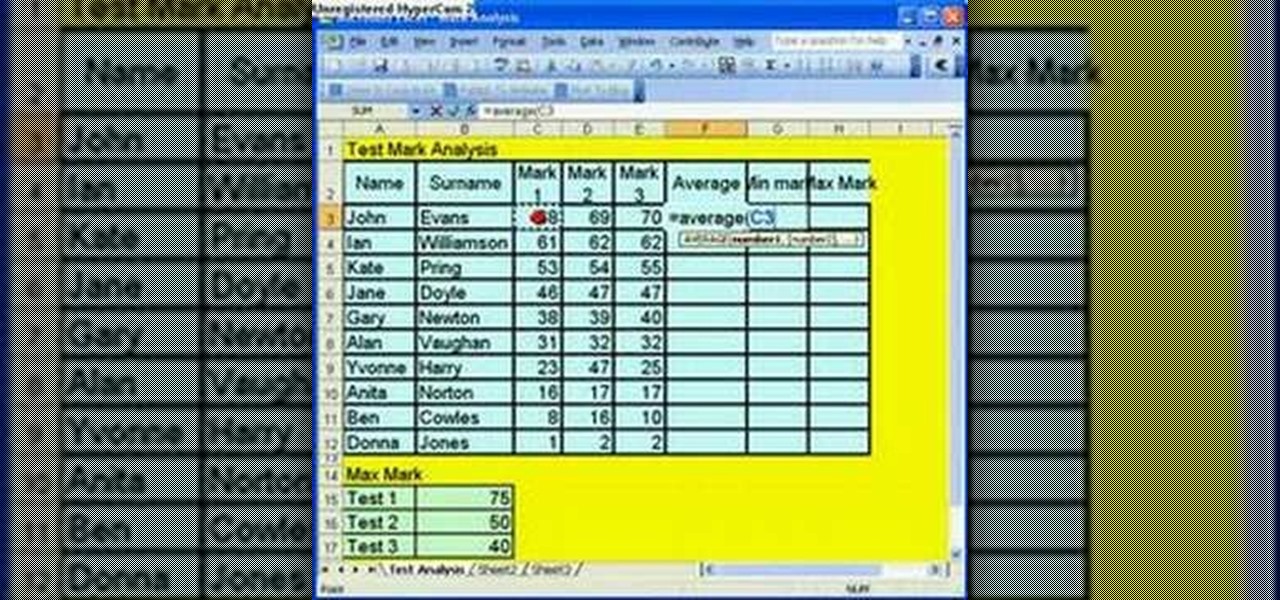
Microsoft Office Excel 2007 spreadsheet manager is a powerful tool that enables information workers to format spreadsheets, as well as analyze and share information to make more informed decisions. In this MS Excel video tutorial, you'll learn about using Excel to calculate average values and to pick max and min values. For more on this handy feature of Excel, watch this how-to.

A beginner's Microsoft Excel tutorial that covers working with formulas, formatting, auto-formatting, dates, and more in Microsoft Excel.

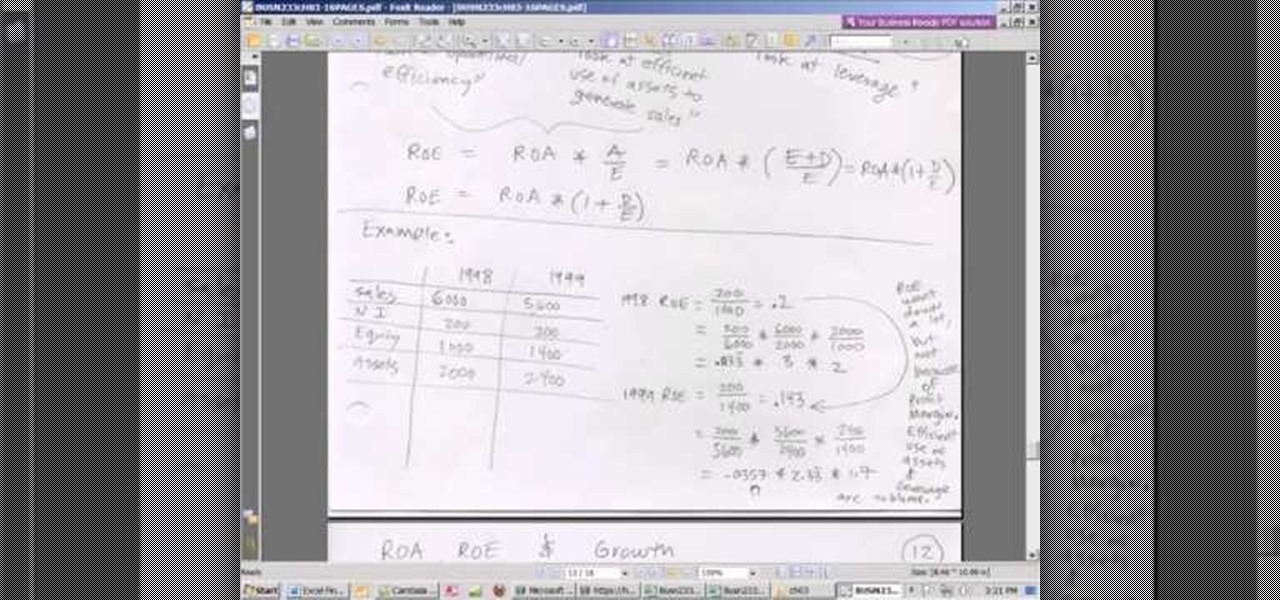
As you might guess, one of the domains in which Microsoft Excel really excels is finance math. Brush up on the stuff for your next or current job with this how-to. In this tutorial from everyone's favorite digital spreadsheet guru, YouTube's ExcelIsFun, the 19th installment in his "Excel Finance Class" series of free video lessons, you'll learn how to calculate return on equity, assets, and profitablility — return on investment (RoI).

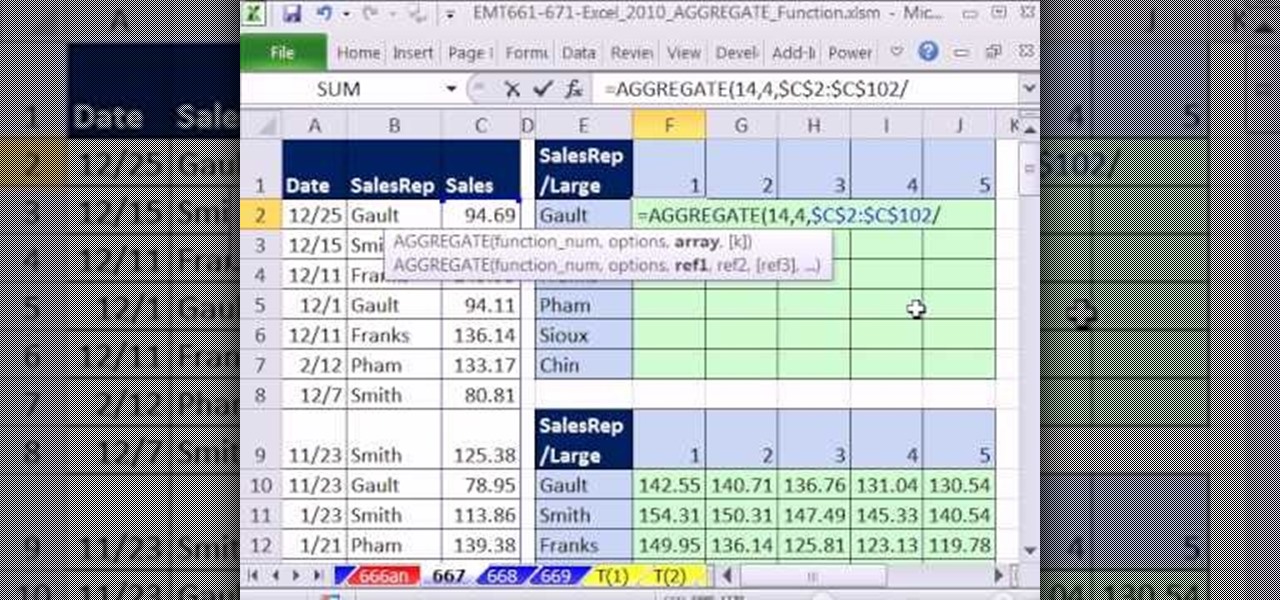
New to Microsoft Excel? Looking for a tip? How about a tip so mind-blowingly useful as to qualify as a magic trick? You're in luck. In this MS Excel tutorial from ExcelIsFun, the 568th installment in their series of digital spreadsheet magic tricks, you'll learn how to calculate the five largest values for each a data set using the new AGGREGATE function.

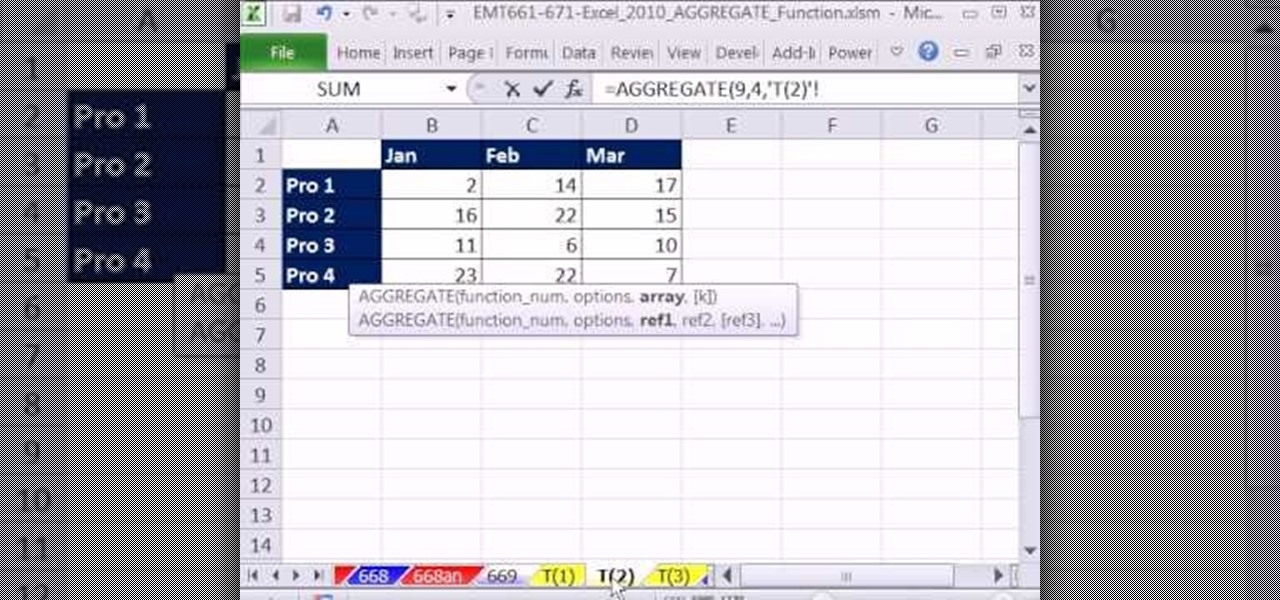
New to Microsoft Excel? Looking for a tip? How about a tip so mind-blowingly useful as to qualify as a magic trick? You're in luck. In this MS Excel tutorial from ExcelIsFun, the 669th installment in their series of digital spreadsheet magic tricks, you'll learn how toe AGGREGATE function cannot handle 3-D cell references.

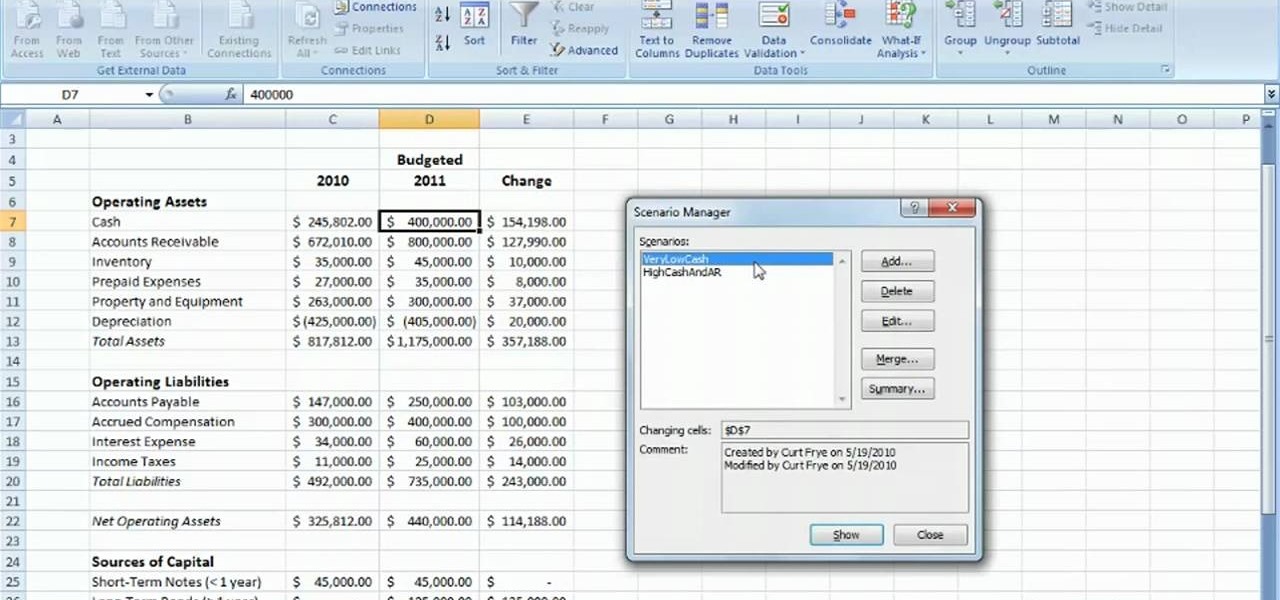
Learn how to edit and delete scenarios in your Excel 2007 workbooks. Whether you're new to Microsoft's popular digital spreadsheet application or a seasoned business professional just looking to better acquaint yourself with the Excel 2007 workflow, you're sure to be well served by this video tutorial from the folks at Lynda. For more information, and to get working with scenarios in your own MS Excel projects, watch this free video guide.

Learn how to add numbers using the SUM and AutoSUM functions within Microsoft Excel 2010. Whether you're new to Microsoft's popular digital spreadsheet application or a seasoned business professional just looking to better acquaint yourself with the Excel 2010 workflow, you're sure to be well served by this video tutorial. For more information, and to get started adjusting the MS Excel 2010 Ribbon bar to your own liking, watch this free video guide.

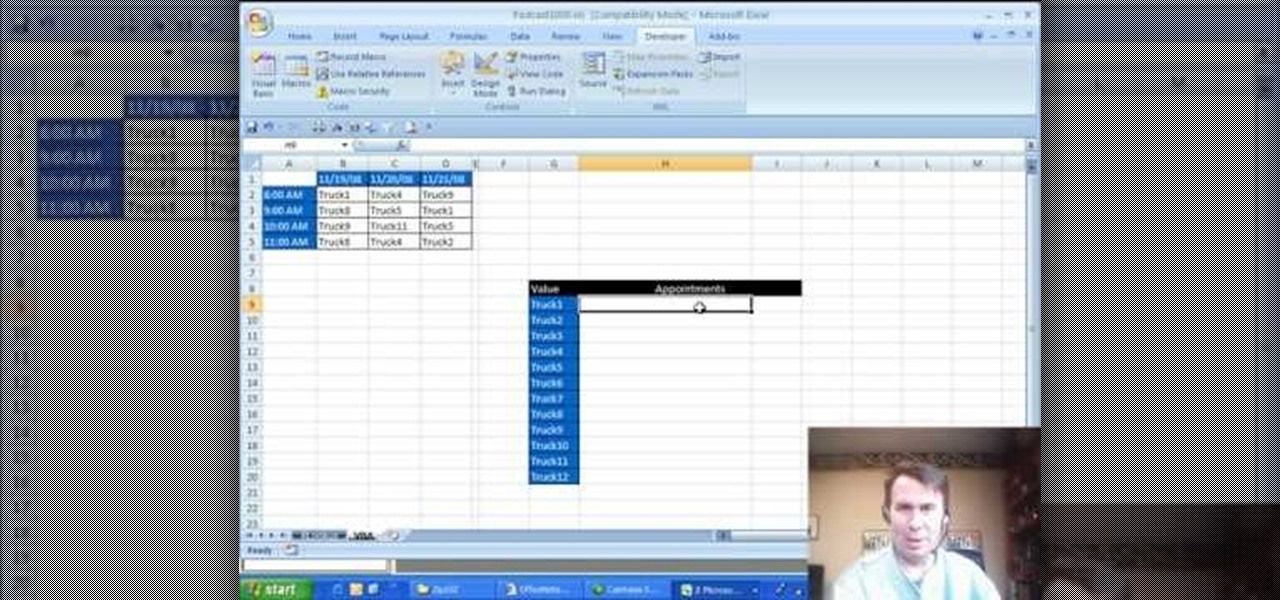
Learn how to use the VBA environment within MS Excel 2007 to create custom macros. Whether you're new to Microsoft's popular spreadsheet application or a seasoned business professional just looking to better acquaint yourself with the unique features of Excel 2007, you're sure to be well served by this video tutorial. For more information, and to get started working within Excel 2007's VBA environment yourself, watch this free video guide.

New to Microsoft Excel? Looking for a tip? How about a tip so mind-blowingly useful as to qualify as a magic trick? You're in luck. In this MS Excel tutorial from ExcelIsFun, the 533rd installment in their series of digital spreadsheet magic tricks, you'll learn how to generate an X-Y scatter chart in Microsoft Excel.

New to Excel? Just looking for a few new tips and tricks? Whatever the case, you're sure to enjoy this free video software tutorial, which will walk you through how to sesarch table arrays within Microsoft Excel 2007. Learn how to dynamically search table arrays in Microsoft Excel 2007 using the built-in VLOOKUP function.

New to Microsoft Excel 2010? Looking for a few good tips and tricks? Look no further. In this free video tutorial from everyone's favorite MS Excel guru, YouTube's ExcelIsFun, the 5th installment in his series of Excel 2010 video tutorials, you'll learn how to apply conditional formatting to cell data bars.

New to Microsoft Excel? Looking for a tip? How about a tip so mind-blowingly useful as to qualify as a magic trick? You're in luck. In this MS Excel tutorial from ExcelIsFun and Mr. Excel, the 7th installment in their joint series of digital spreadsheet magic tricks, you'll learn how to complete a reverse lookup (find value inside table and then retrieve column and row header). Mr. Excel uses Excel VBA code (macro) and ExcelIsFun uses a formula with the INDEX, IF, SMALL, MATCH, TEXT, CHAR and...

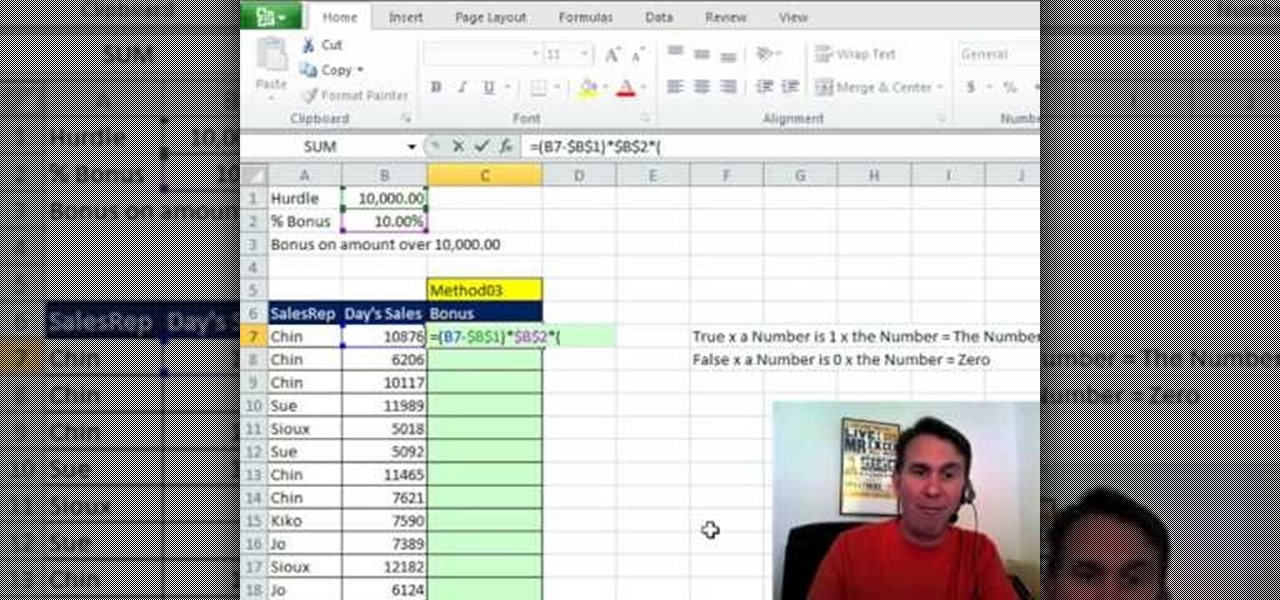
New to Microsoft Excel? Looking for a tip? How about a tip so mind-blowingly useful as to qualify as a magic trick? You're in luck. In this MS Excel tutorial from ExcelIsFun and Mr. Excel, the 24th installment in their joint series of digital spreadsheet magic tricks, you'll learn 5 different methods for calculating a bonus using VLOOKUP, MAX, Boolean, and 2 IF formulas.

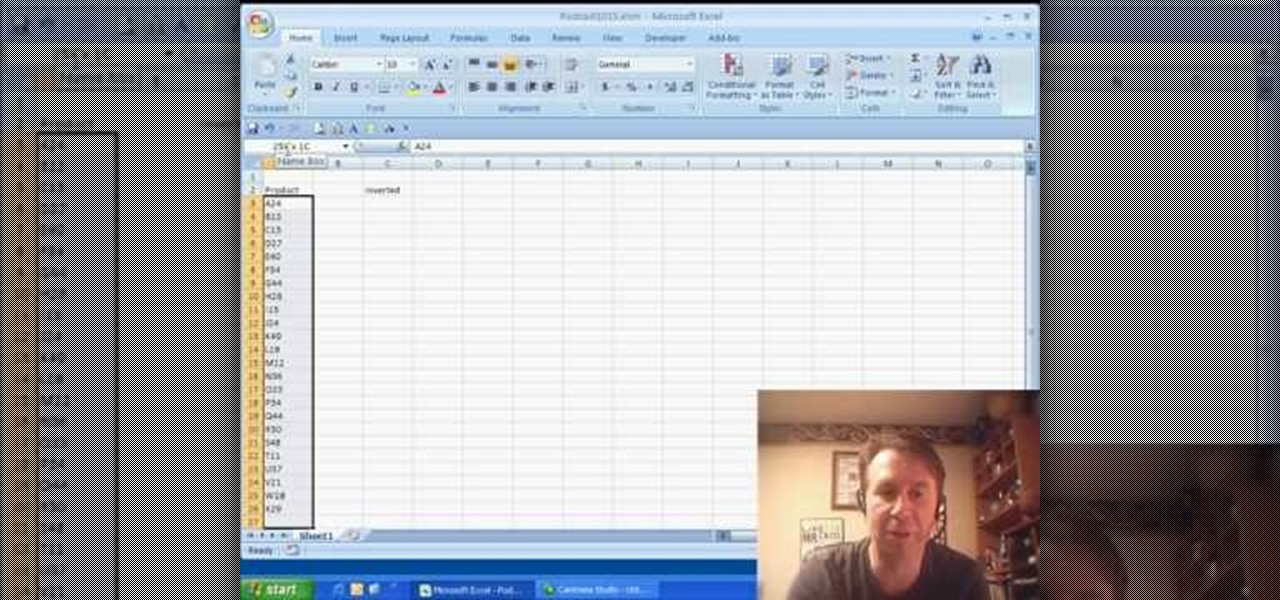
New to Microsoft Excel? Looking for a tip? How about a tip so mind-blowingly useful as to qualify as a magic trick? You're in luck. In this MS Excel tutorial from ExcelIsFun and Mr. Excel, the 10th installment in their joint series of digital spreadsheet magic tricks, you'll learn how to invert a range (turn a range of cells upside down) with two different INDEX formulas.

New to Microsoft Excel? Looking for a tip? How about a tip so mind-blowingly useful as to qualify as a magic trick? You're in luck. In this MS Excel tutorial from ExcelIsFun and Mr. Excel, the 4th installment in their joint series of digital spreadsheet magic tricks, you'll learn how to create charts to compare data values.

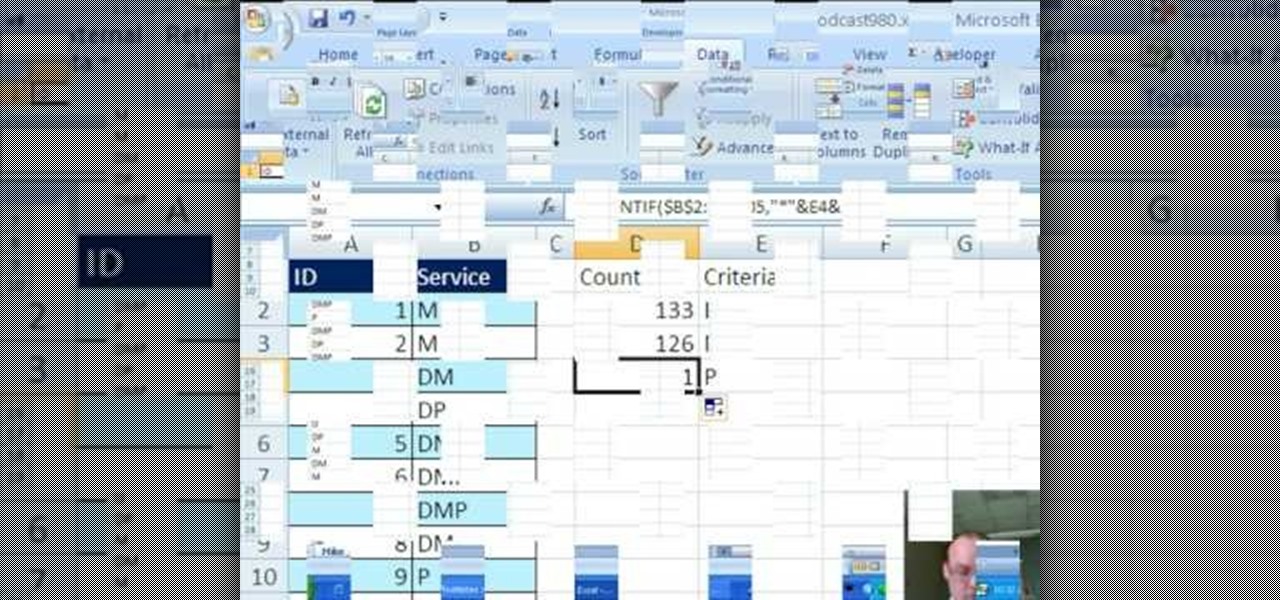
New to Microsoft Excel? Looking for a tip? How about a tip so mind-blowingly useful as to qualify as a magic trick? You're in luck. In this MS Excel tutorial from ExcelIsFun and Mr. Excel, the 3rd installment in their joint series of digital spreadsheet magic tricks, you'll see three methods to count records that contain the letter D.

hether you're interested in learning Microsoft Excel from the bottom up or just looking to pick up a few tips and tricks, you've come to the right place. In this tutorial from everyone's favorite digital spreadsheet guru, ExcelIsFun, the 38th installment in his "Highline Excel Class" series of free video Excel lessons, you'll learn how to use the TRANSPOSE & FREQUENCY functions.


