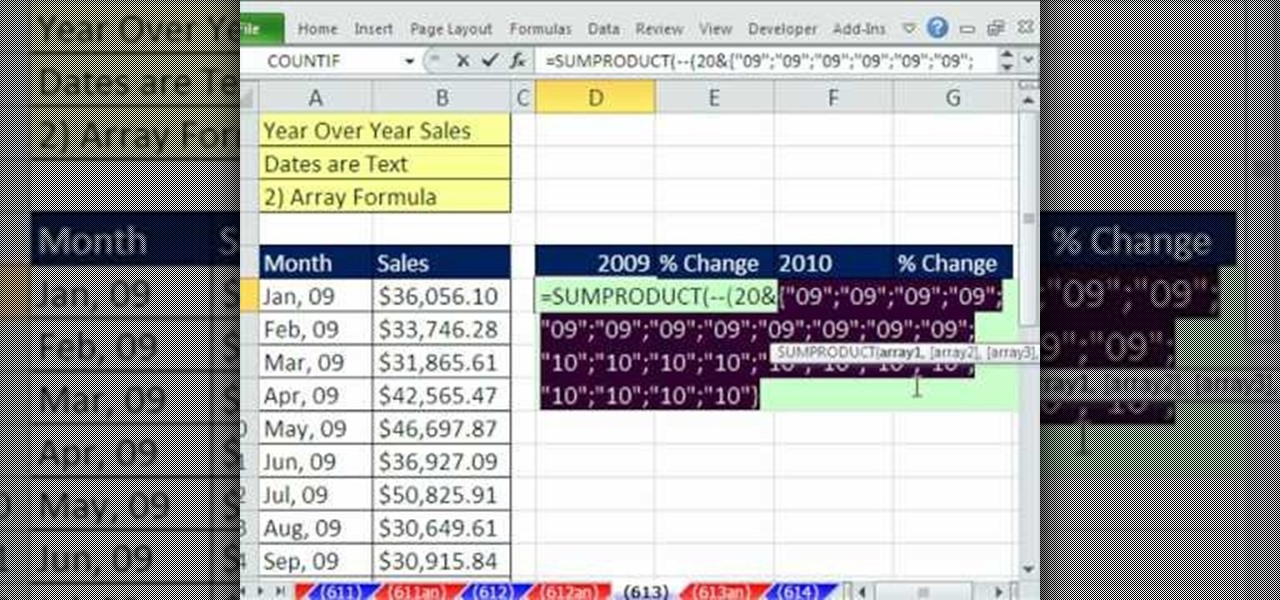
New to Microsoft Excel? Looking for a tip? How about a tip so mind-blowingly useful as to qualify as a magic trick? You're in luck. In this MS Excel tutorial from ExcelIsFun, the 613th installment in their series of digital spreadsheet magic tricks, you'll learn how to

Want to know how to express a percentage as a decimal number or a decimal number as percentage? Learn how. From Ramanujan to calculus co-creator Gottfried Leibniz, many of the world's best and brightest mathematical minds have belonged to autodidacts. And, thanks to the Internet, it's easier than ever to follow in their footsteps (or just finish your homework or study for that next big test). With this installment from Internet pedagogical superstar Salman Khan's series of free math tutorials...

Want to program your own Java games and applications but don't know beans about object-oriented programming? Never you fear. This free video tutorial from TheNewBostonian will have you coding your own Java apps in no time flat. Specifically, this lesson discusses how to generate random numbers in a Java application. For more information, including detailed, step-by-step instructions, watch this helpful programmer's guide.
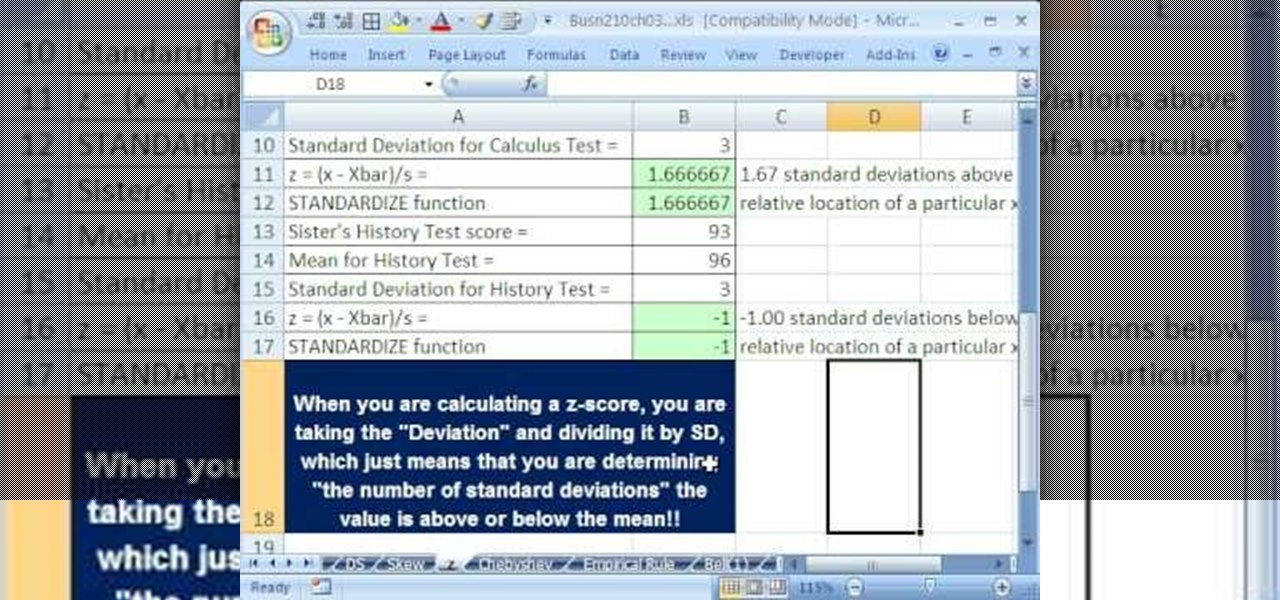
If you use Microsoft Excel on a regular basis, odds are you work with numbers. Put those numbers to work. Statistical analysis allows you to find patterns, trends and probabilities within your data. In this MS Excel tutorial from everyone's favorite Excel guru, YouTube's ExcelsFun, the 45th installment in his "Excel Statistics" series of free video lessons, you'll learn how to see how to calculate a z-score.
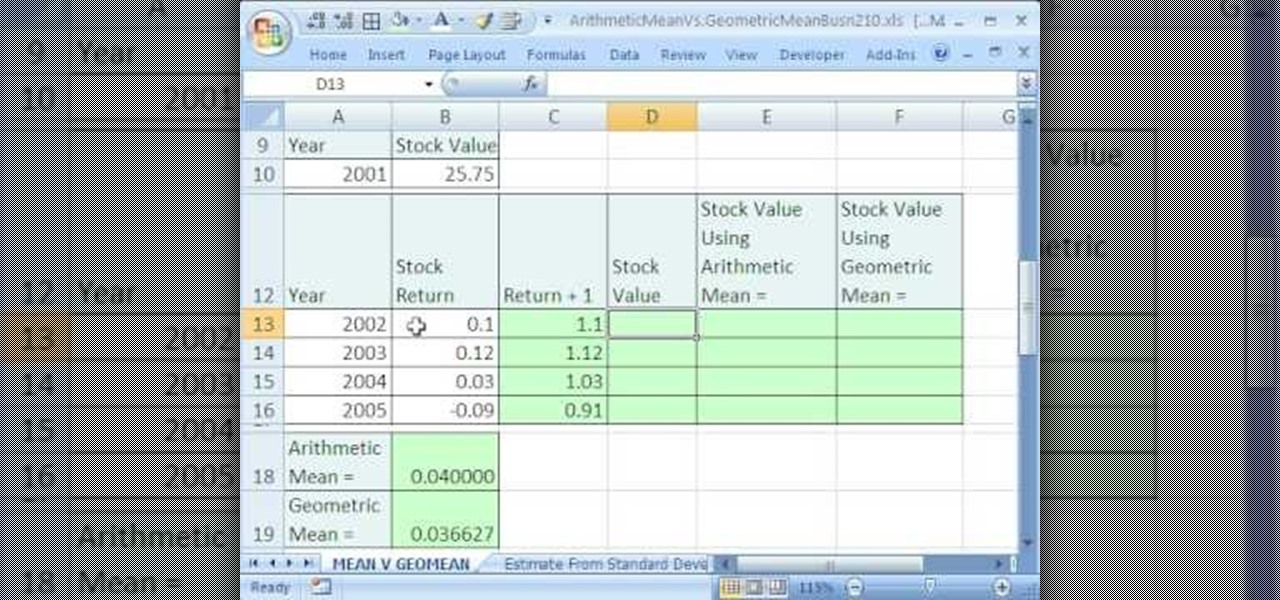
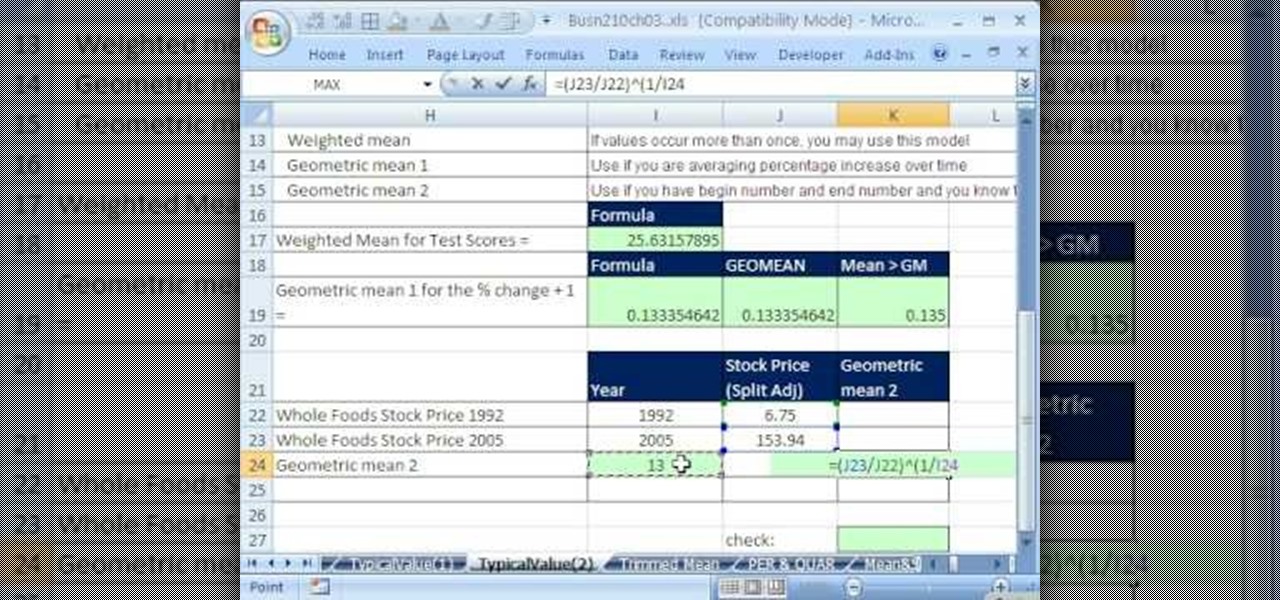
If you use Microsoft Excel on a regular basis, odds are you work with numbers. Put those numbers to work. Statistical analysis allows you to find patterns, trends and probabilities within your data. In this MS Excel tutorial from everyone's favorite Excel guru, YouTube's ExcelsFun, the 35.2nd installment in his "Excel Statistics" series of free video lessons, you'll learn how to use Excel's GEOMEAN function to find geometric mean.
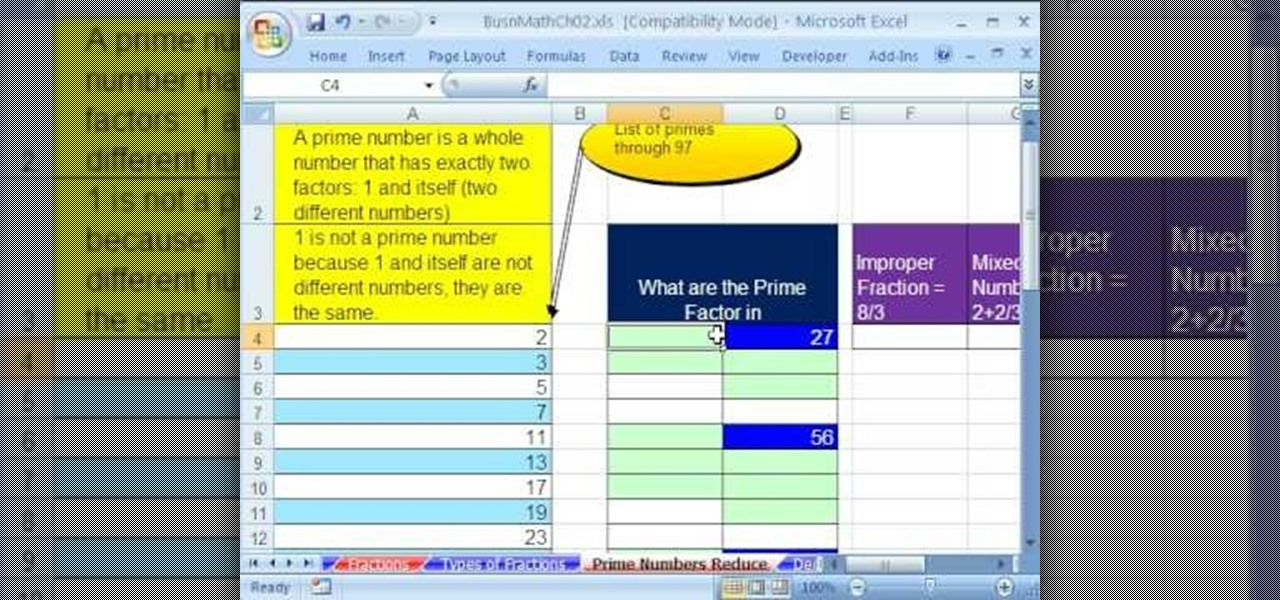
As you might guess, one of the domains in which Microsoft Excel really excels is business math. Brush up on the stuff for your next or current job with this how-to. In this tutorial from everyone's favorite digital spreadsheet guru, YouTube's ExcelIsFun, the 17th installment in his "Excel Business Math" series of free video lessons, you'll learn how to define prime numbers, determine prime factors, reduce fractions (i.e., write fractions in their lowest terms) and convert mixed numbers to imp...

Sometimes math problems are easier to solve if you can convert a number into different types. In this tutorial, taught by a real math teacher, learn how to take a mixed number and turn it back into an improper fraction, and vice versa. This process won't take long and it will help you on many types of algebra problems.

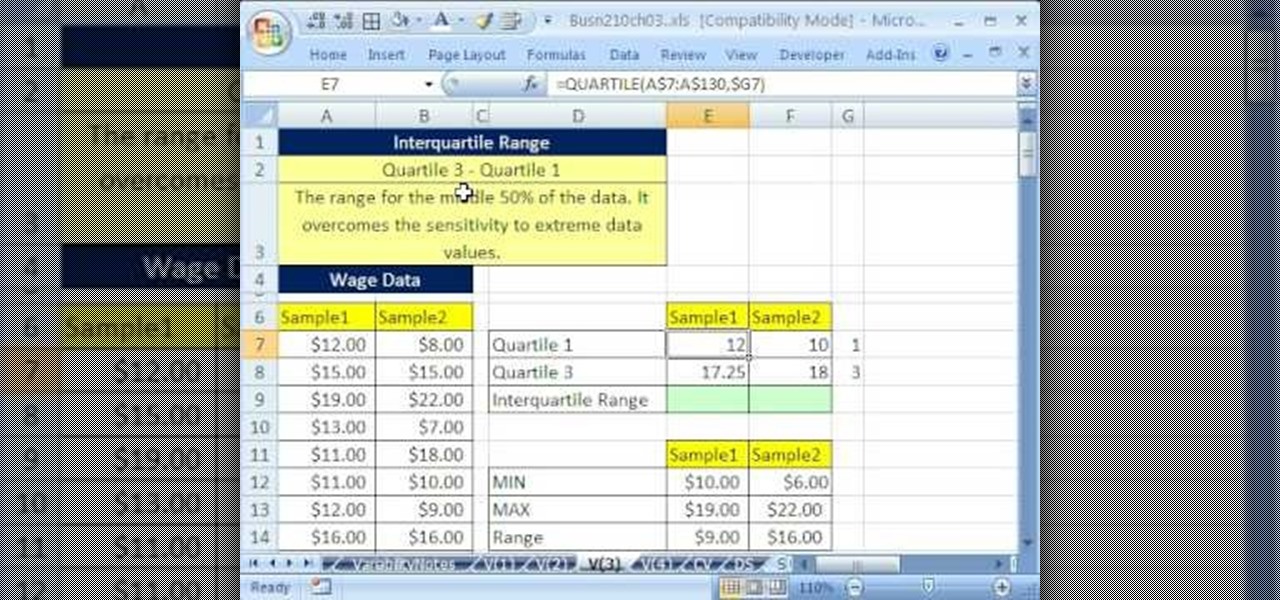
If you use Microsoft Excel on a regular basis, odds are you work with numbers. Put those numbers to work. Statistical analysis allows you to find patterns, trends and probabilities within your data. In this MS Excel tutorial from everyone's favorite Excel guru, YouTube's ExcelsFun, the 40th installment in his "Excel Statistics" series of free video lessons, you'll learn how to calculate range & interquartile range for variability using the MAX, MIN, QUARTILE functions.

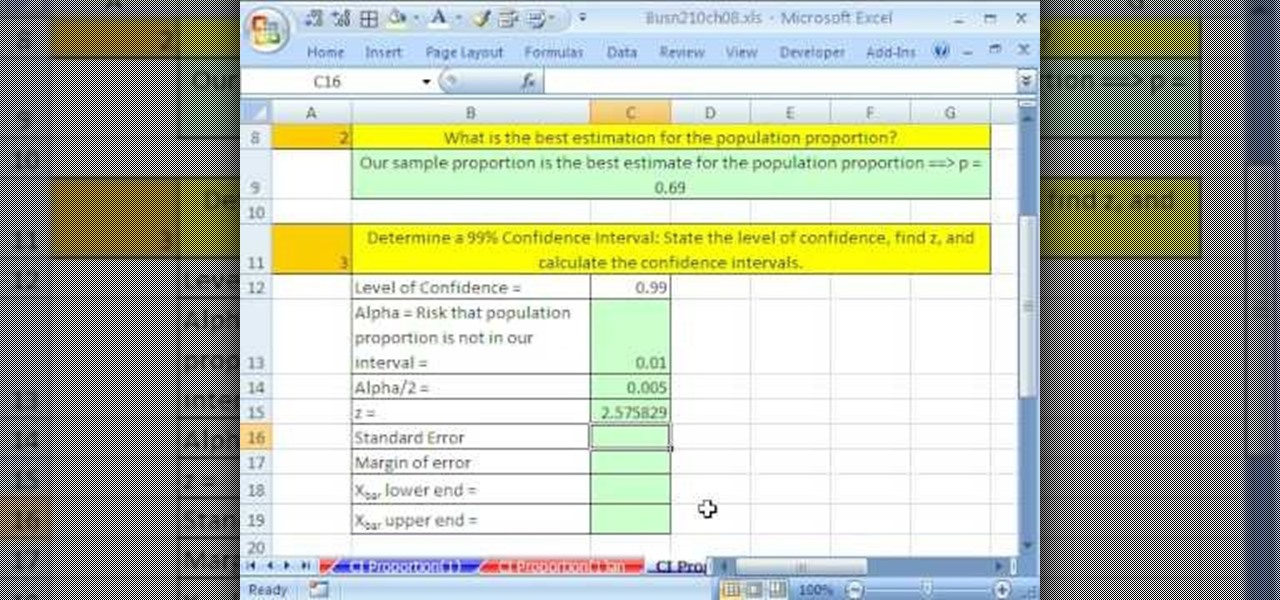
If you use Microsoft Excel on a regular basis, odds are you work with numbers. Put those numbers to work. Statistical analysis allows you to find patterns, trends and probabilities within your data. In this MS Excel tutorial from everyone's favorite Excel guru, YouTube's ExcelsFun, the 86th installment in his "Excel Statistics" series of free video lessons, you'll learn how to construct confidence intervals for proportions using NORMSINV function and other formulas.

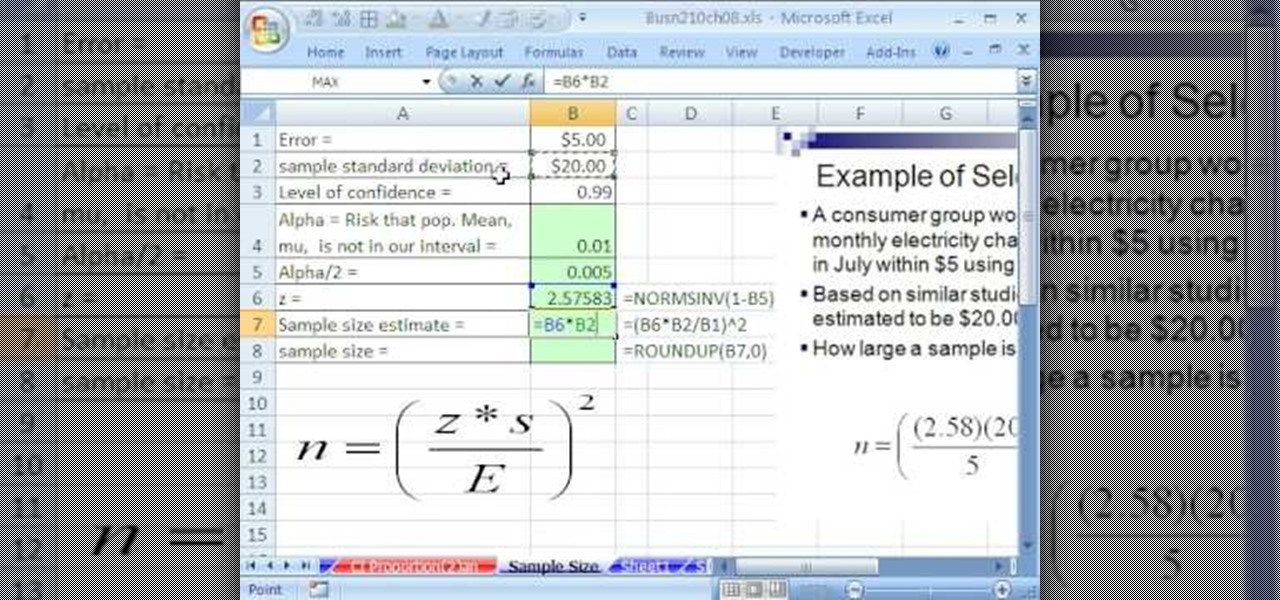
If you use Microsoft Excel on a regular basis, odds are you work with numbers. Put those numbers to work. Statistical analysis allows you to find patterns, trends and probabilities within your data. In this MS Excel tutorial from everyone's favorite Excel guru, YouTube's ExcelsFun, the 87th installment in his "Excel Statistics" series of free video lessons, you'll learn how to calculate sample size (n) for confidence intervals.

If you use Microsoft Excel on a regular basis, odds are you work with numbers. Put those numbers to work. Statistical analysis allows you to find patterns, trends and probabilities within your data. In this MS Excel tutorial from everyone's favorite Excel guru, YouTube's ExcelsFun, the 27th installment in his "Excel Statistics" series of free video lessons, you'll learn how to create a quantitative data dot plot chart using the REPT and COUNTIF functions.

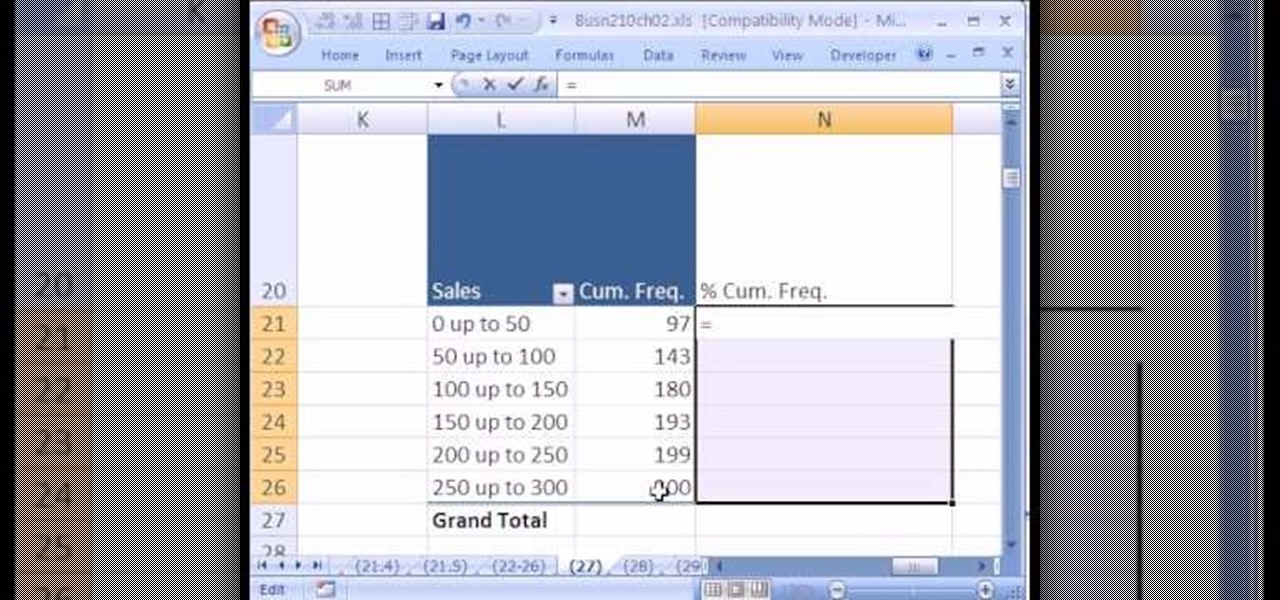
If you use Microsoft Excel on a regular basis, odds are you work with numbers. Put those numbers to work. Statistical analysis allows you to find patterns, trends and probabilities within your data. In this MS Excel tutorial from everyone's favorite Excel guru, YouTube's ExcelsFun, the 26th installment in his "Excel Statistics" series of free video lessons, you'll learn how to create quantitative data cumulative frequency distributions with pivot tables.

If you use Microsoft Excel on a regular basis, odds are you work with numbers. Put those numbers to work. Statistical analysis allows you to find patterns, trends and probabilities within your data. In this MS Excel tutorial from everyone's favorite Excel guru, YouTube's ExcelsFun, the 16th installment in his "Excel Statistics" series of free video lessons, you'll learn how to cross tabulate & do percentage cross tabulation for categorical data using a pivot table (PivotTable).

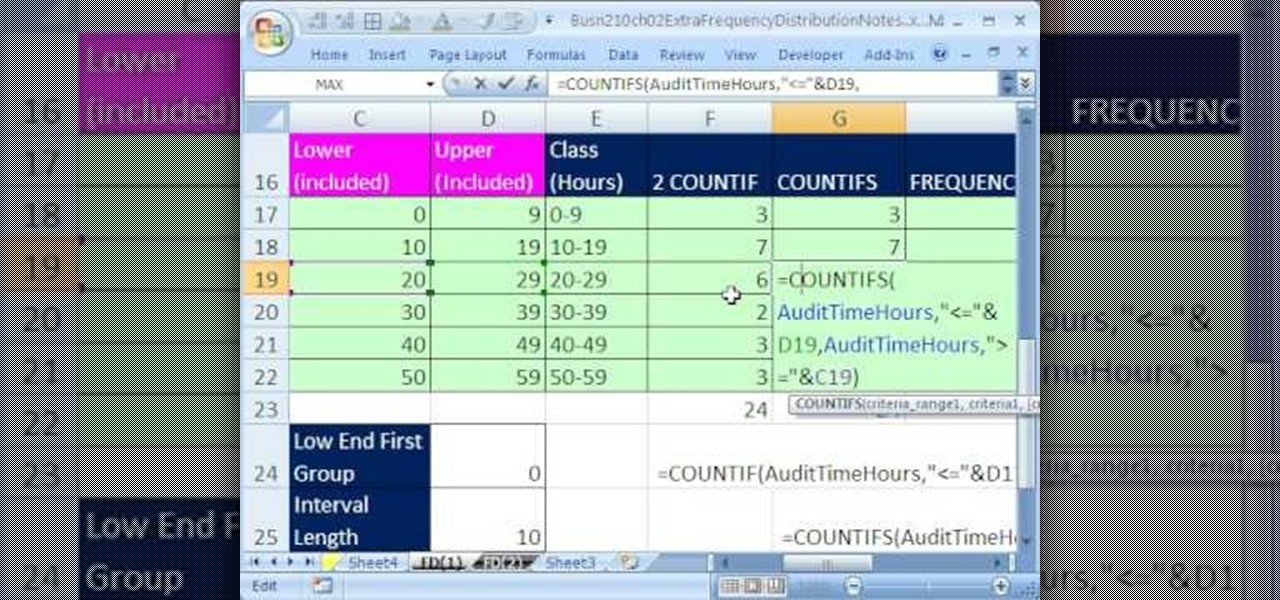
If you use Microsoft Excel on a regular basis, odds are you work with numbers. Put those numbers to work. Statistical analysis allows you to find patterns, trends and probabilities within your data. In this MS Excel tutorial from everyone's favorite Excel guru, YouTube's ExcelsFun, the 19th installment in his "Excel Statistics" series of free video lessons, you'll learn how to group categories in a frequency distribution with a formula (2 COUNTIF) and the pivot table (PivotTable) grouping fea...

If you use Microsoft Excel on a regular basis, odds are you work with numbers. Put those numbers to work. Statistical analysis allows you to find patterns, trends and probabilities within your data. In this MS Excel tutorial from everyone's favorite Excel guru, YouTube's ExcelsFun, the 17th installment in his "Excel Statistics" series of free video lessons, you'll learn how to cross tabulate & do percentage cross tabulation for categorical data using formulas rather than pivot tables.

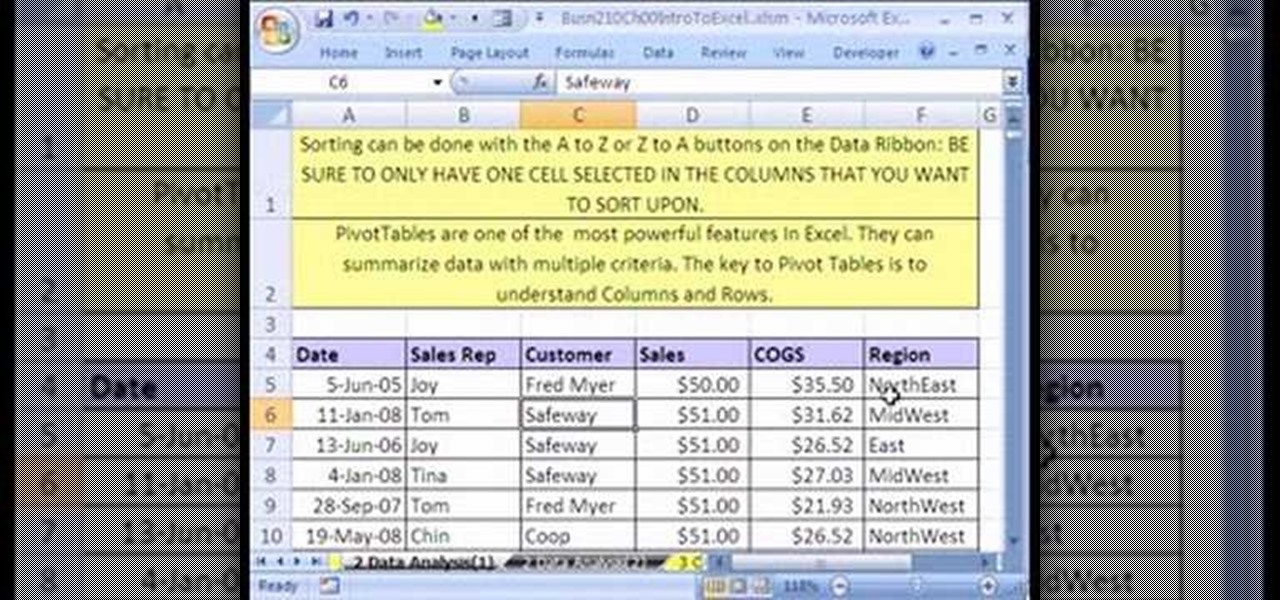
If you use Microsoft Excel on a regular basis, odds are you work with numbers. Put those numbers to work. Statistical analysis allows you to find patterns, trends and probabilities within your data. In this MS Excel tutorial from everyone's favorite Excel guru, YouTube's ExcelsFun, the 3rd installment in his "Excel Statistics" series of free video lessons, you'll learn how to use Excel's sorting and pivot tables (PivotTables) data analysis tools.

If you use Microsoft Excel on a regular basis, odds are you work with numbers. Put those numbers to work. Statistical analysis allows you to find patterns, trends and probabilities within your data. In this MS Excel tutorial from everyone's favorite Excel guru, YouTube's ExcelsFun, the 35th installment in his "Excel Statistics" series of free video lessons, you'll learn how to calculate weighted and geometric means and see how to use the GEOMEAN function.

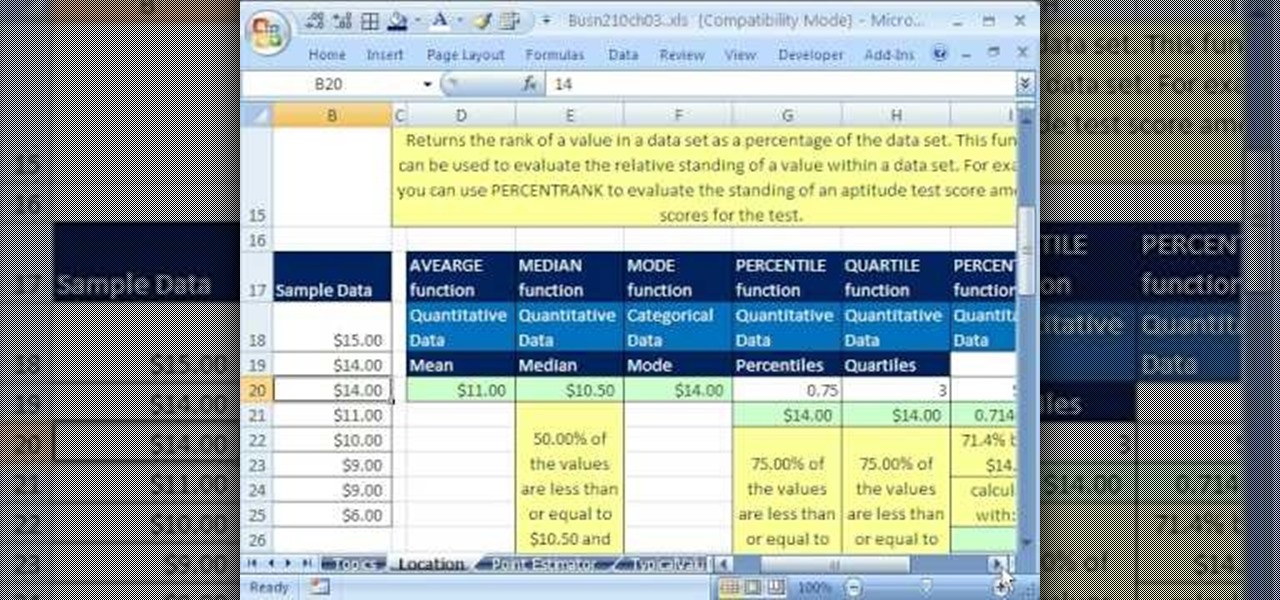
If you use Microsoft Excel on a regular basis, odds are you work with numbers. Put those numbers to work. Statistical analysis allows you to find patterns, trends and probabilities within your data. In this MS Excel tutorial from everyone's favorite Excel guru, YouTube's ExcelsFun, the 33rd installment in his "Excel Statistics" series of free video lessons, you'll learn how to use the AVEARGE, MEDIAN, MODE, PERCENTILE, QUARTILE and PERCENTILERANK functions to measure location.

If you use Microsoft Excel on a regular basis, odds are you work with numbers. Put those numbers to work. Statistical analysis allows you to find patterns, trends and probabilities within your data. In this MS Excel tutorial from everyone's favorite Excel guru, YouTube's ExcelsFun, the 32nd installment in his "Excel Statistics" series of free video lessons, you'll learn how to group when the quantitative data are whole numbers, integers or discrete data and how to group when the quantitative ...

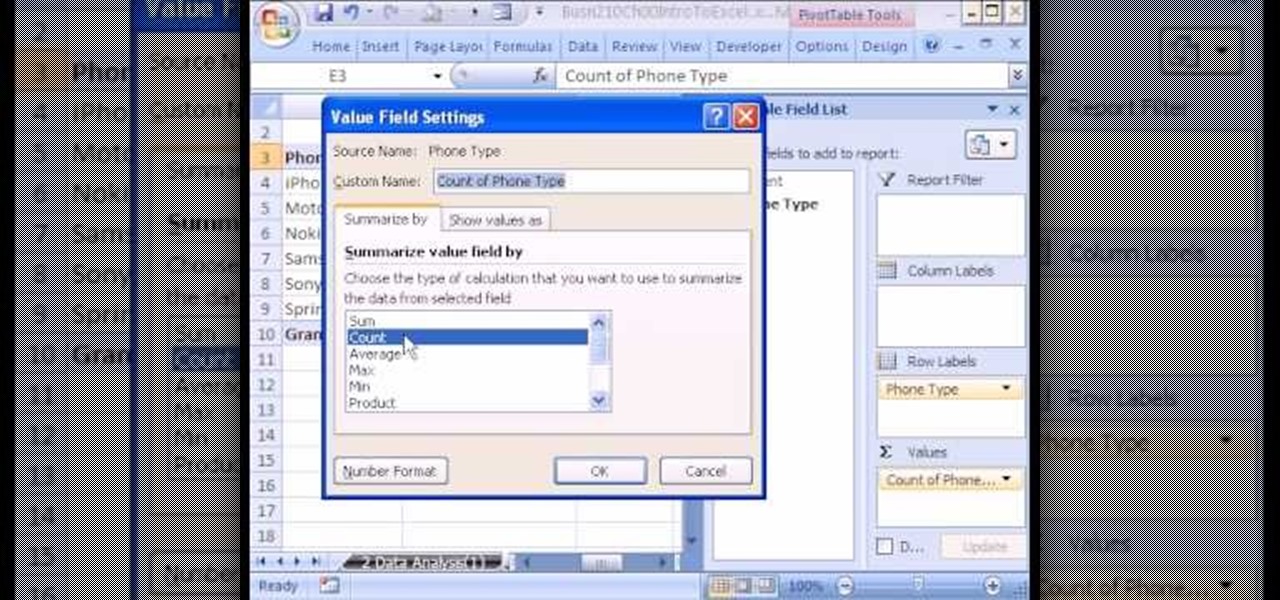
If you use Microsoft Excel on a regular basis, odds are you work with numbers. Put those numbers to work. Statistical analysis allows you to find patterns, trends and probabilities within your data. In this MS Excel tutorial from everyone's favorite Excel guru, YouTube's ExcelsFun, the 4th installment in his "Excel Statistics" series of free video lessons, you'll learn how to create a frequency table and percentage frequency table using a Pivot Table (PivotTable).

Love Microsoft Excel? This clip contains a tip that just might induce you to. With this free video tutorial from ExcelIsFun, the 101st installment of his "YouTubers Love Excel" or YTLE series of free video MS Excel lessons, you'll learn how to use conditional formatting AND custom number formatting to add styling to a cell.

Love Microsoft Excel? This clip contains a tip that just might induce you to. With this free video tutorial from ExcelIsFun, the 102nd installment of his "YouTubers Love Excel" or YTLE series of free video MS Excel lessons, you'll learn how to count the number of days between two dates using an array formula.

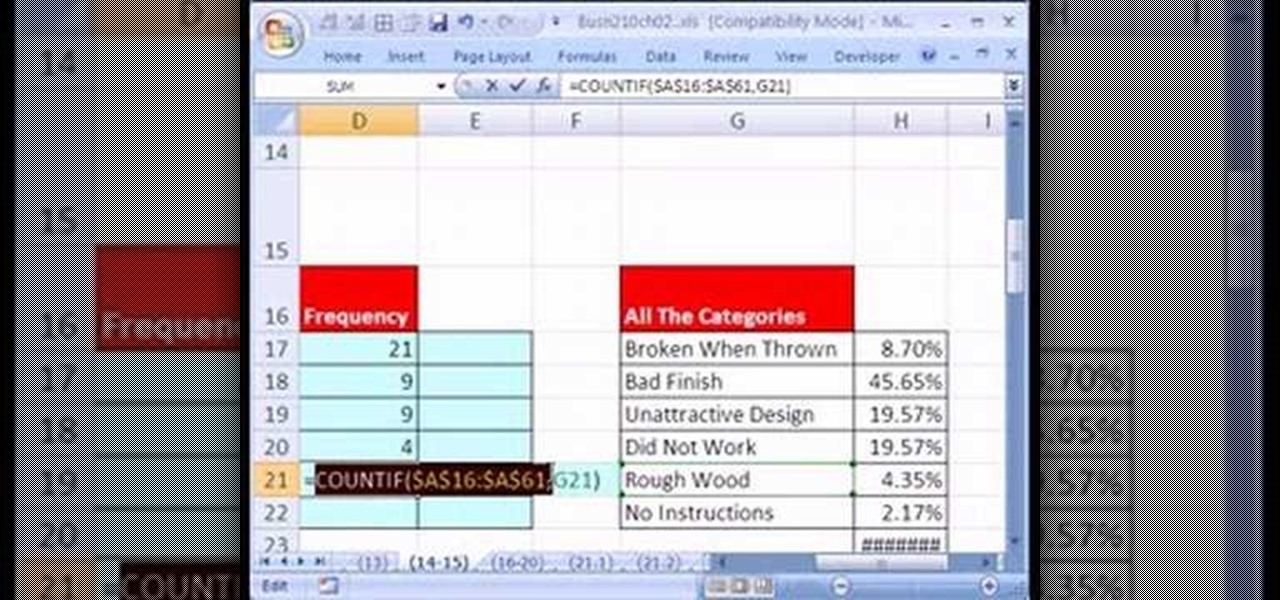
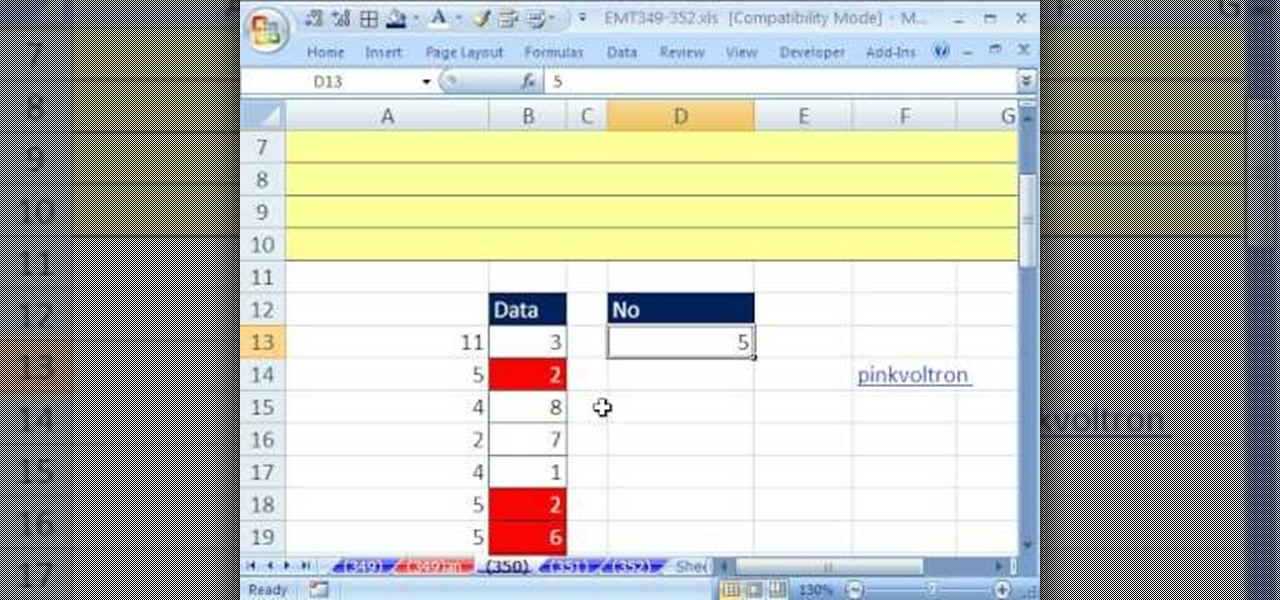
New to Microsoft Excel? Looking for a tip? How about a tip so mind-blowingly useful as to qualify as a magic trick? You're in luck. In this MS Excel tutorial from ExcelIsFun, the 350th installment in their series of digital spreadsheet magic tricks, you'll learn how to use conditional formatting and the COUNTIF function to highlight values that are repeated a given number of times.

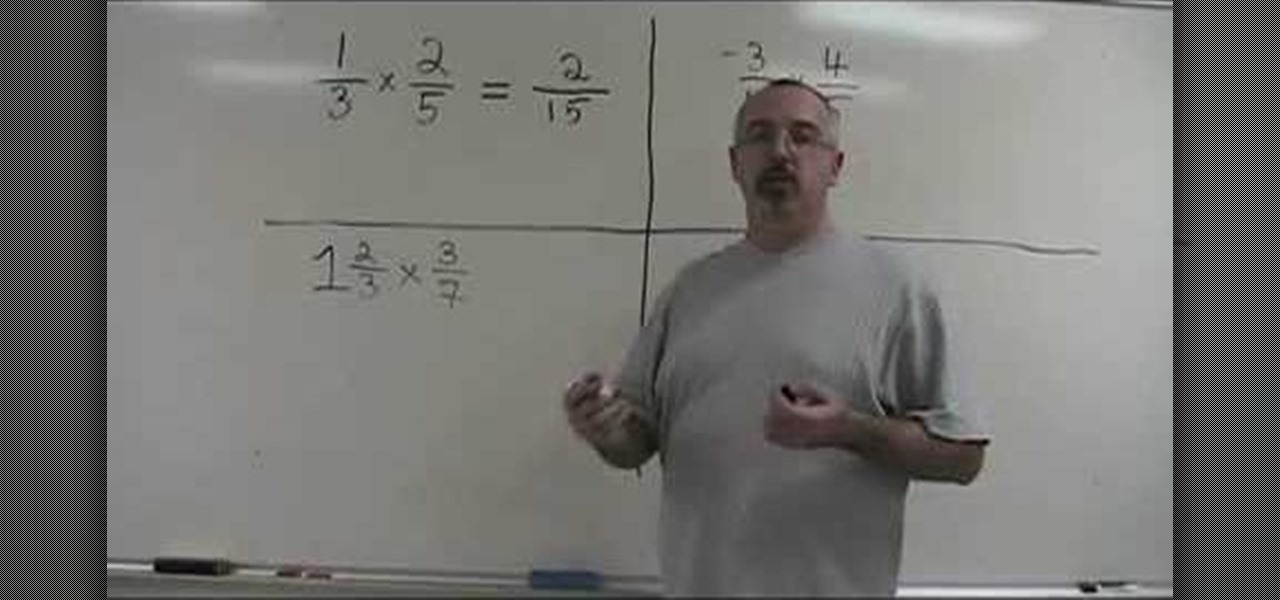
Doug Simms gives a demonstration of multiplying fraction in a simple and easy manner. The simplest problems have proper fractions to be multiplied by proper fractions, and the answer can be arrived at by simply multiplying the numerator (upper value) of one fraction with the numerator of the other, carrying out the same operation with the denominators (lower values) of the two fractions, and finally, reducing the resultant fraction by a common factor, if any. Doug also gives three other examp...

Not only is Poptropica fun, it's also chock full of fun Easter eggs. In this clip from YouTube's Poptropica Cheats, you'll learn how to unlock and use a number of the better ones. Specifically, this clip will teach you how to customize your cell phone number as well as personalize your character's appearance.

Ever tried to sign up for auto-insurance, or some other thing that required your VIN number, and ran around trying to find it in frustration? Well frustrate no more good people! This video will show you all of the various places that you can locate your VIN number! Trust me, there's a lot....

If you're ever done a big race before, then you've probably had to deal with attaching a paper number to your chest with safety pins. In a triathlon, where you are going to have to change clothes multiple times, having to keep unpinning and repinning that number can cost you valuable time and effort. This video will show you how a race belt can simplify the process, making switching your numbers location a breeze, even across multiple outfits.

This video is about how to make uTorrent 2.0 faster. The first step that you will have to do is to open your uTorrent 2.0. Once you have opened uTorrent 2.0, go to "options" then click "Preferences". Once you have clicked "Preferences", go to "Connection" found on the left side of the window. Then beside the random port, change the numbers to "45682". After you have changed it, go to "Bandwidth". Then change the maximum upload rate to "15". Also change the maximum download rate to "1890". You...

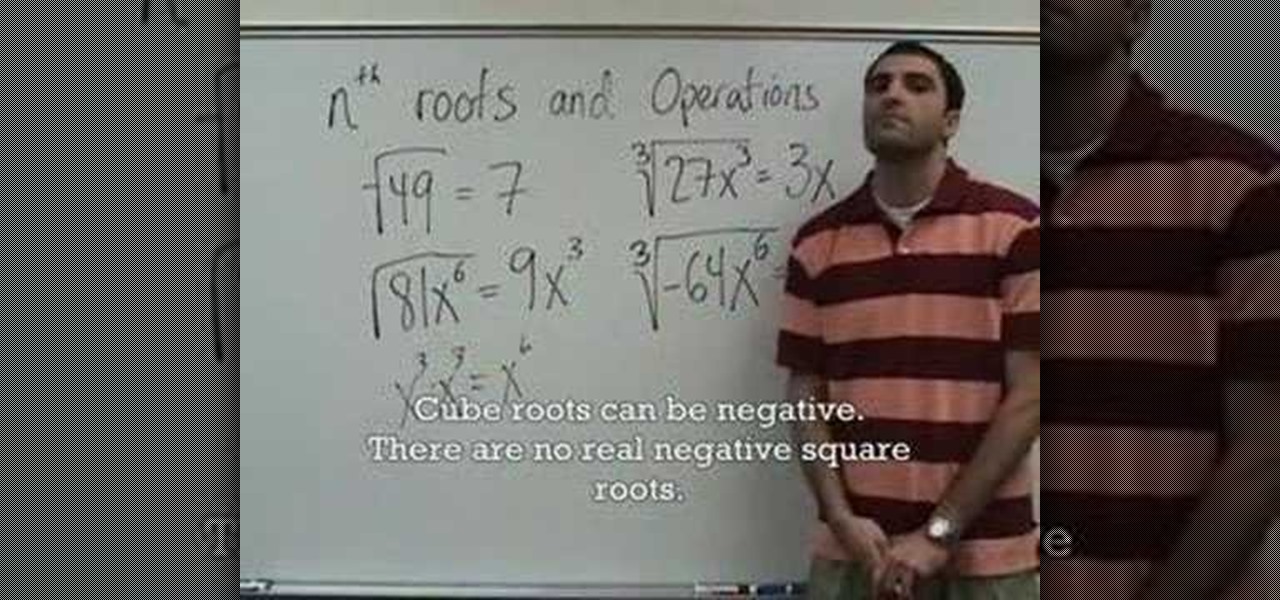
This video teaches us the concept of nth roots. The video starts with the square root of constants. We find the number which when multiplies by itself for two times results in the constant inside the square root. Then we find the square root of variables. Here again the same concept is used. We find the variable which when multiplied by itself for two times results in the given variable. Then we find the cube root. Here we find the number which when multiplied by itself for three times result...

If you've ever been asked to find the GCF, or Greatest Common Factor, of a series of numbers or algebraic expressions, check out this video to learn how.

If you are having a difficult time getting someone's phone number this is the how to video for you. Watch and learn ten easy tips to getting a phone number and maybe even a date.

Tim Carter of Ask the Builder demonstrates the basics of a framing square. Tim shows how to make the marks for a simple roof rafter.

One of the fun and special traditions enjoyed and shared by the Deaf Community is signing stories using number or alphabet hand shapes. In these stories, various hand shapes do not stand for the numbers and letters themselves, but are used as signs or gestures to convey concepts. They are signed in alphabetical or numerical order, and used in amazing ways to sign or act out a story.

If you want to block your cell phone number for all calls, this is the video for you. Learn to block not just one call, but all further calls with the push of a few buttons. Now no one will be able to see your cell phone number.

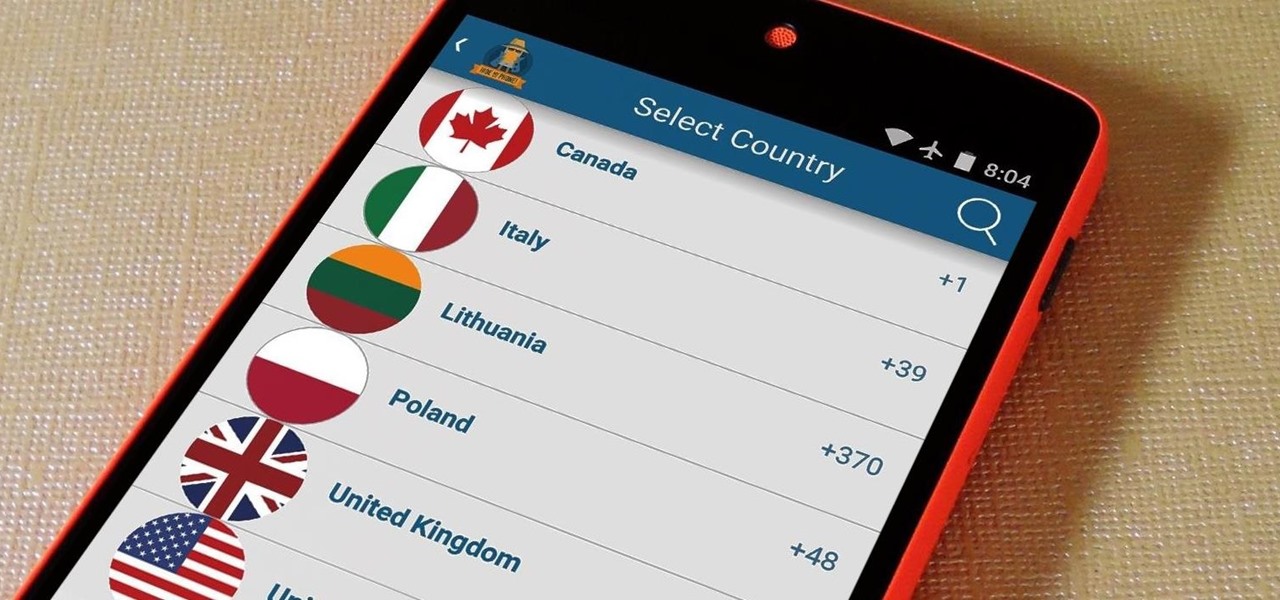
A burner number isn't just for criminals and cheating spouses. In this digital world, with many of our interactions being conducted online, a throwaway phone number acts as a buffer — it lets you enjoy the web without having to give out your personal information, such as real name or phone number.

Facebook really wants your phone number, nagging you for one as soon as you join. This isn't all bad since it can help secure your account with two-factor authentication. On the flipside, this makes it easy to reveal the private phone numbers of virtually anyone on Facebook, including celebrities and politicians. We're going to look at how a hacker would do this and how to protect yourself.

As much as you try to safeguard your personal information, you may have made a small mistake by giving your phone number to the wrong entity, and now you're being bombarded with dozens of spam calls every day. To help parse your call log and reject the proper numbers without answering or trudging through voicemail, a good reverse phone lookup app is needed.

Throwaway phones aren't just for seedy criminals and spies—they can be useful for many everyday situations.

In my last guide, I showed how you could crack the combination of any Master Lock combination padlock in 8 tries or less using my online calculator. Now, as promised, I'll be showing you how I devised the attack, which is based off the well-known technique that reduces the 64,000 possible combinations of a Master Lock down to just 100. Here, I will be drilling open a Master combo lock to show you how the insides work.

With all of the productivity tweaks and usability enhancements that we cover here at Gadget Hacks, it's nice when we come across a unique and noteworthy app that's simply about having fun.


