To play "People are Crazy," you begin with what is called the intro. For this song, the intro includes playing the same group of notes or strings two times; this is called "repeat" on the sheet music. All of the these notes will be played on the B-string except for one. The exception is played on the G-string and this is just played open. Start on the 10 thread (fifth string capo) holding it with your ring finger, count to the fifth string and play it twice, pause, then play 5, 3, 1, and then...
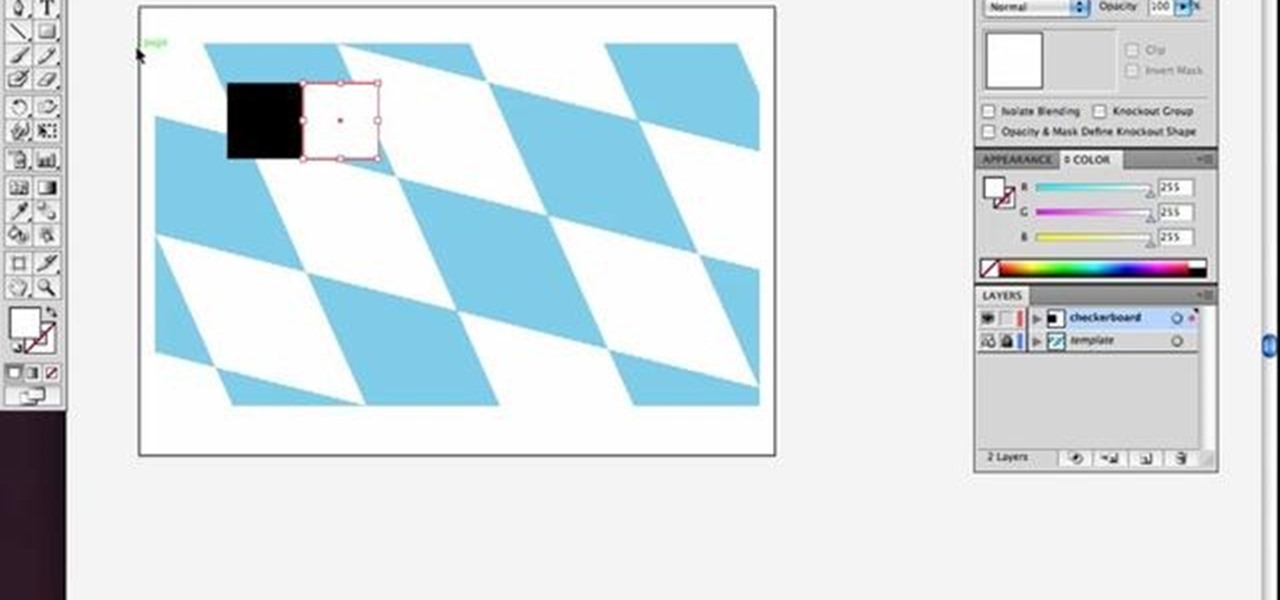
Check out this simple Adobe Illustrator CS4 tutorial to learn how to create a skewed checkerboard pattern. This technique will save you the trouble of having to use the Option and Drag method multiple times. Veerle Pieters expertly takes you through this easy pattern technique. For more Adobe Illustrator tutorials, search for Illustrator on WonderHowTo.
Pressure washers are a great way to clean a brick patio - if you do it right! The pressure washer can harm the surface you are cleaning or even yourself. The basic operation of the pressure washer is to take the low pressure from you garden hose and increase the pressure with a special pump. The pump uses either a gas powered engine or an electric motor to boost the pressure.
Mosaics are a cool type of art. You can use mosaics to liven up your home or garden and they are cheap and fun to make. Check out this video for tips and instructions for making mosaics.

Watch this video for instructions on making the Yukki Cross Artemis scythe from the anime / manga Vampire Knight.

Perfect for any outdoor or summer special occasion! You don't have to spend a lot of money on an expensive evening gown--make your own at home! This free pattern video shows you how to take your own measurements, and then turn a few yards of nice fabric into a classy evening gown.

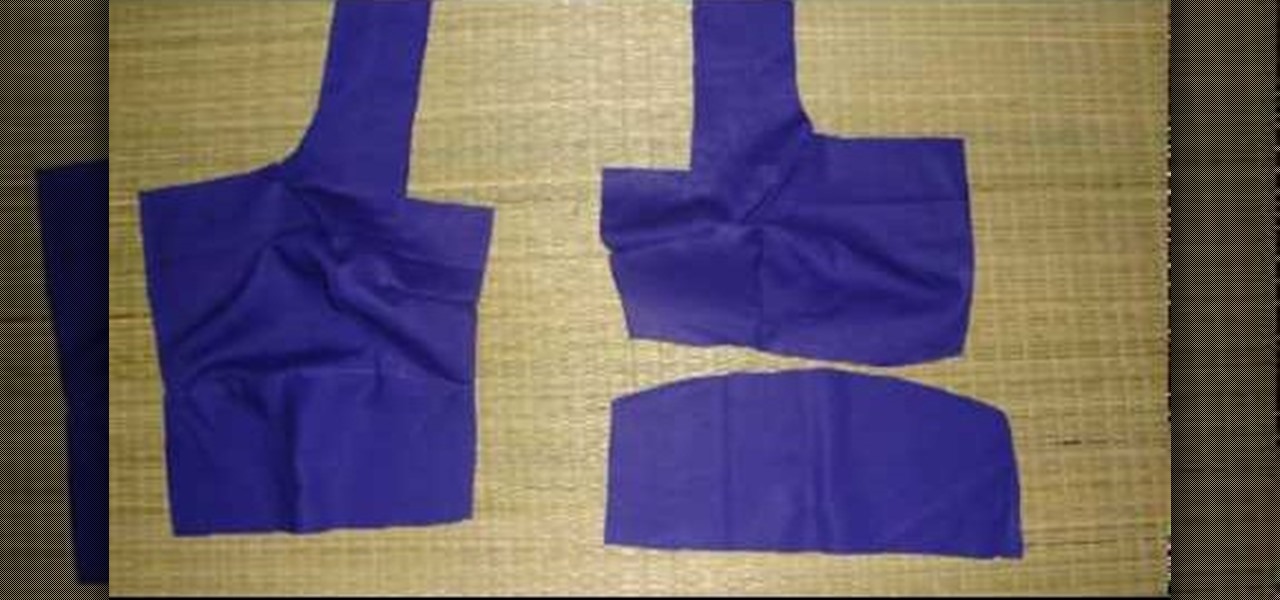
The sari is a beautiful dress, traditionally worn by East Indian women, involving a length of fabric draped over an under blouse. This tutorial shows you how to draft your own pattern for a sari blouse and then sew it together yourself. Always iron your fabric before you start working with it!
This is the perfect tutorial for beginners who are interesting in learning how to quilt. Start with a basic abstract pattern and your favorite colors of fabric (you can use scraps if you wish as well), then follow the video and make your first quilt!
Learn to play "Holly Jolly Christmas" on ukelele this holiday season. "Ukelele" Mike Lynch shows you how on this informative video, which includes chords, lyrics, strumming pattern and technical details on the instrument used to play this song.
Don't have a matching glass cup set? No problem. If you have a bunch of variously shaped and sized water glasses, you can make them match easily - and stylishly - by painting on some easy animal patterns.
This tutorial shows you how to make pieces of chainmail jewelry by using the Persian style - also called the woven-V style. This is a simple pattern that builds off the tradtional four in one style, which you can use to make any number of jewelry pieces.
Add a bit of sparkle and pizzaz to your wardrobe! This short tutorial demonstrates how you can add small crystals in whatever pattern you want using the Kandi Kane hotfix wand to add color, sparkle and your own unique touch.
Turn yourself into an Aphrodite or Artemis this Halloween! You don't even need a pattern to make yourself a sexy Greek goddess costume! All you need are a few yards of your favorite fabric, some chantilly lace for a wrap, and a laurel leaf crown to top it all off!
The snake belly bar, in essence, is a product of multiple snake belly knots, tied together in series. This great bar makes a great bracelet or strap and is easy to make if you know the right pattern. In this video you will get an up close look at how to tie this knot from start to finish.
Have you ever wanted to play tribal music? If you have a wooden Native American flute (tuned to the key of G), this video demonstrates the right fingering pattern to play a beautiful and easy melody on your musical instrument.
In this clip, you'll learn how to perform a simple strum on the ukulele. If you want to get really good at playing the ukulele, it stands to reason that you'll need to practice. Happily, the Internet is awash in high-quality video lessons like this one from the folks at Ukulele Underground. For more information, including a step-by-step overview, watch this free video ukulele tutorial.
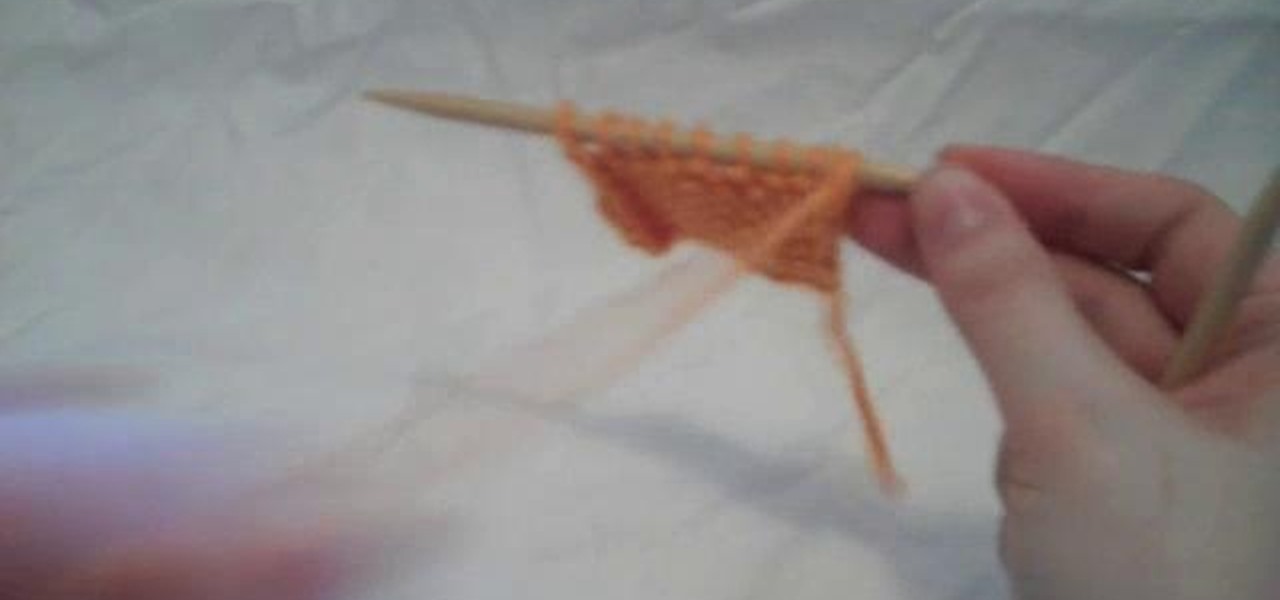
This free video knitting lesson presents an overview of how to bind off when your pattern calls for you to bind off on the purl side of your work, shown in the continental style. For more information, including detailed, step-by-step instructions, and to get started binding off on the purl side when knitting yourself, watch this helpful video guide.
In this clip, Betty will show you how to make a beautiful lattice topping for your fruit pies. Don't leave a boring plain pastry topper on your masterpiece, make an easy basket-weave pattern instead. Nothing is more delicious than a pie for the holidays. Enjoy!
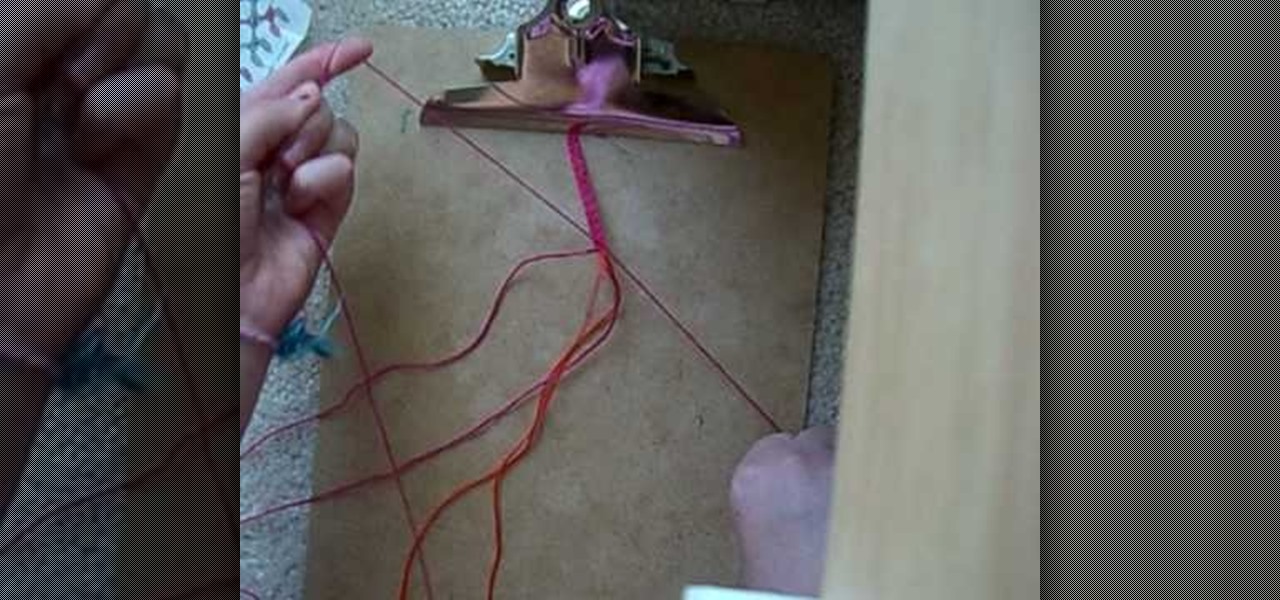
When we're talking friendship bracelets, by no means are we refering to those glittery Claire's posers that are always buy one get one free. Rather, we're talking about really pretty and sentimental bracelets that you can make on your own.
Reggae berets have been around and popular since the days of Bob Marley, but when chanteuse Gwen Stefani started sporting these for her solo tour and integrating rasta patterns into her clothing line, L.A.M.B, the rasta print become near uniform for admiring girls across the country.
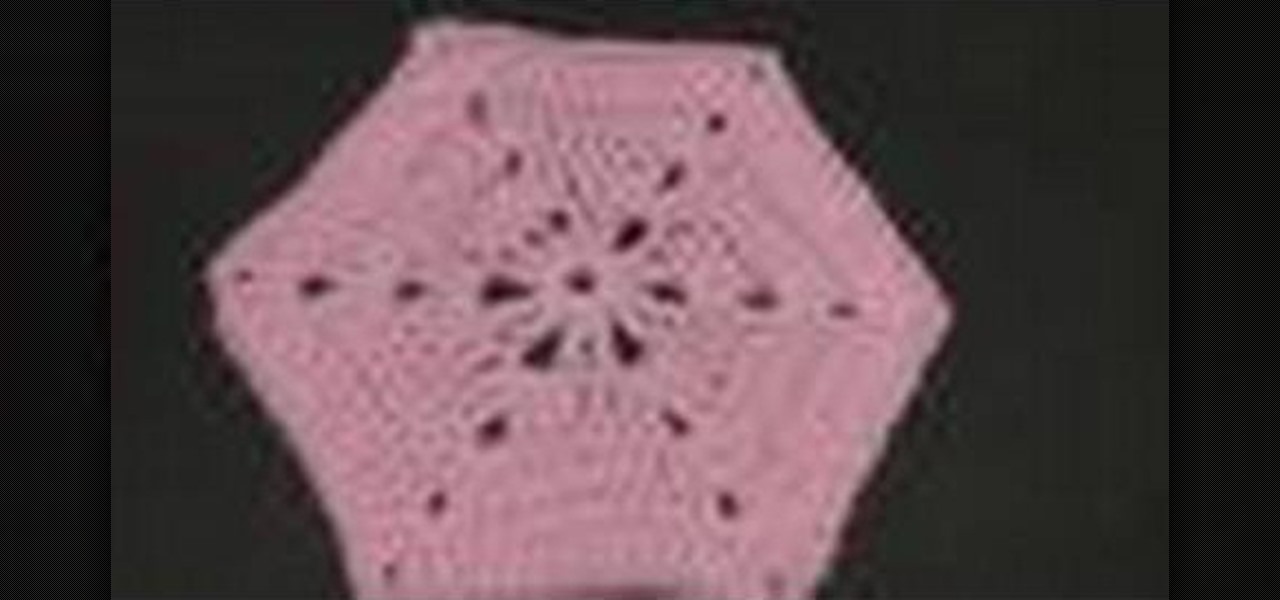
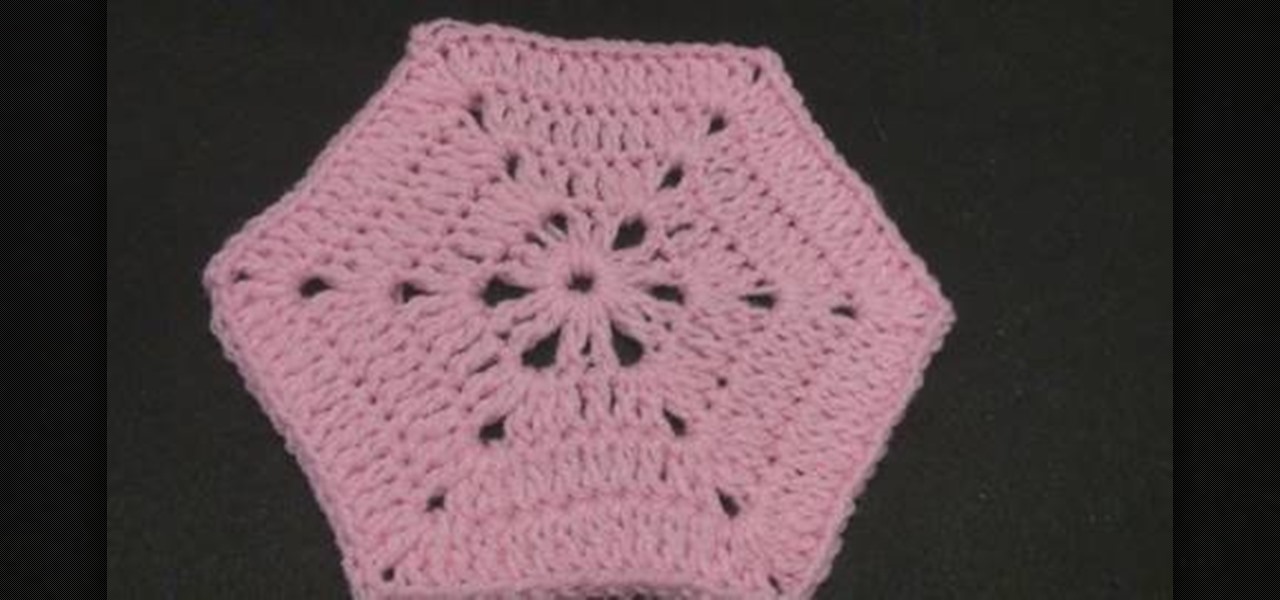
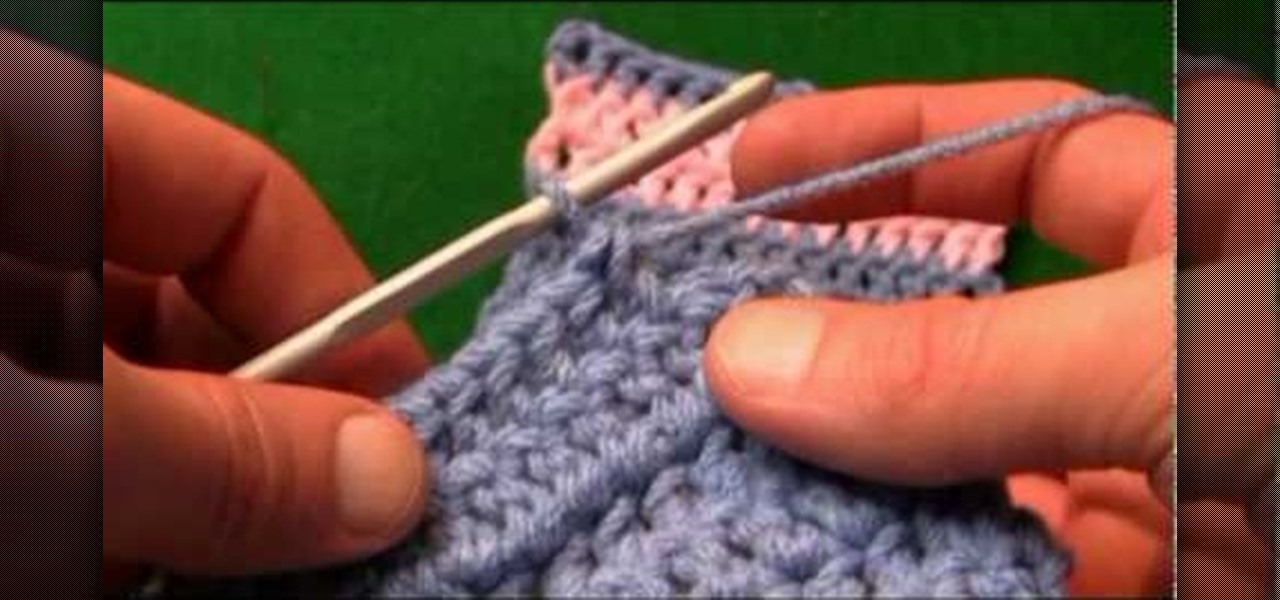
Crochet hexagons are a great way to amp up your crocheting skills since they advance on your knowledge of how to crochet triangles by mandating that you crochet six triangles at once, all stitched together.
Now why, you may wonder, would you want to crochet a solid hexagon? Whether as part of a larger pattern for a quilt or alone to use as a pretty coaster, a hexagon is a crochet shape ten times more interesting than a square but just as easy to do.
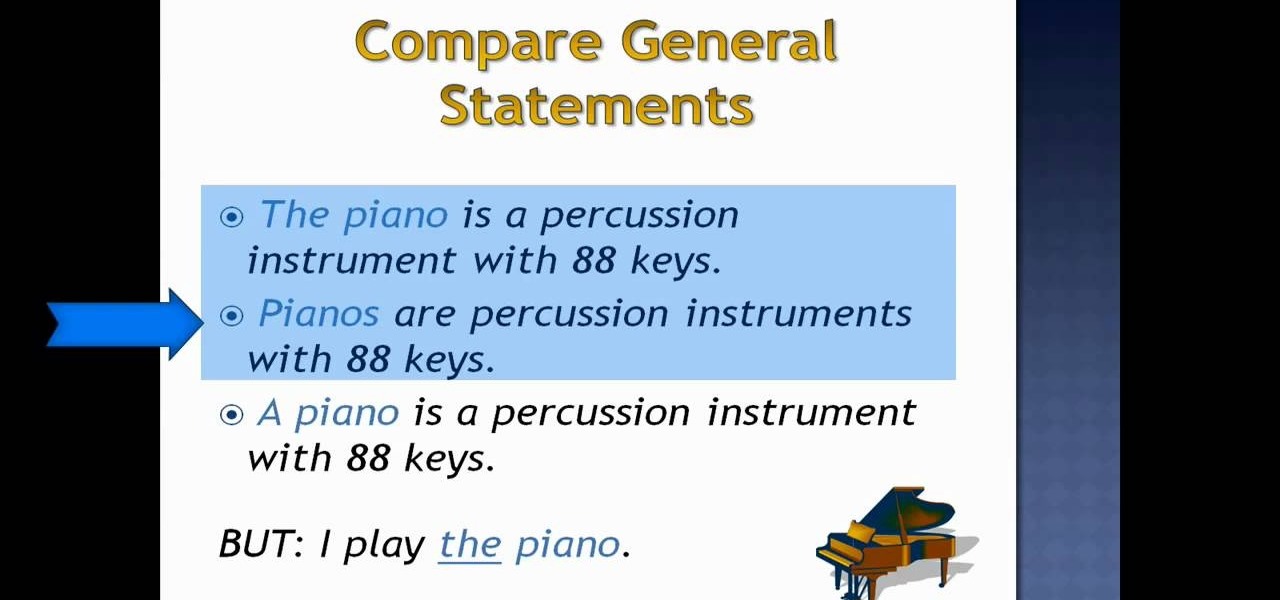
If you're trying to learn how to speak and understand the English language this video should help in one area: generic nouns. This is an easy subject that anybody can pick up on.
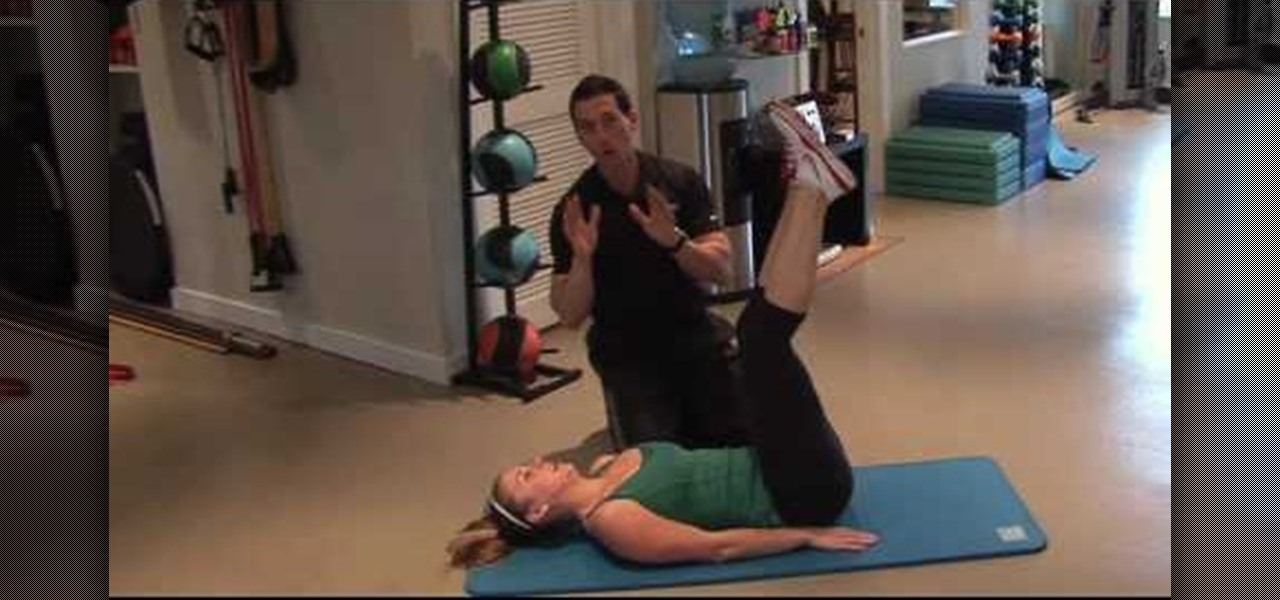
Due to natural fat storage patterns, a woman's middle section is one of the hardest to tone. Fat tends to aggregate at a woman's belly as a survival mechanism, making it difficult, even with diet and exercise, to cut chub and unearth a six pack.
Monocolor scarves, berets, and mittens may be worn by those high up in the fashion world for their modern, all-flattering chic quality, but for those of us who actually like to have fun, adding more color to our lives is often preferred.
If you use Microsoft Excel on a regular basis, odds are you work with numbers. Put those numbers to work. Statistical analysis allows you to find patterns, trends and probabilities within your data. In this MS Excel tutorial from everyone's favorite Excel guru, YouTube's ExcelsFun, the 45th installment in his "Excel Statistics" series of free video lessons, you'll learn how to see how to calculate a z-score.
If you use Microsoft Excel on a regular basis, odds are you work with numbers. Put those numbers to work. Statistical analysis allows you to find patterns, trends and probabilities within your data. In this MS Excel tutorial from everyone's favorite Excel guru, YouTube's ExcelsFun, the 35.2nd installment in his "Excel Statistics" series of free video lessons, you'll learn how to use Excel's GEOMEAN function to find geometric mean.
If you use Microsoft Excel on a regular basis, odds are you work with numbers. Put those numbers to work. Statistical analysis allows you to find patterns, trends and probabilities within your data. In this MS Excel tutorial from everyone's favorite Excel guru, YouTube's ExcelsFun, the 40th installment in his "Excel Statistics" series of free video lessons, you'll learn how to calculate range & interquartile range for variability using the MAX, MIN, QUARTILE functions.
If you use Microsoft Excel on a regular basis, odds are you work with numbers. Put those numbers to work. Statistical analysis allows you to find patterns, trends and probabilities within your data. In this MS Excel tutorial from everyone's favorite Excel guru, YouTube's ExcelsFun, the 86th installment in his "Excel Statistics" series of free video lessons, you'll learn how to construct confidence intervals for proportions using NORMSINV function and other formulas.
If you use Microsoft Excel on a regular basis, odds are you work with numbers. Put those numbers to work. Statistical analysis allows you to find patterns, trends and probabilities within your data. In this MS Excel tutorial from everyone's favorite Excel guru, YouTube's ExcelsFun, the 87th installment in his "Excel Statistics" series of free video lessons, you'll learn how to calculate sample size (n) for confidence intervals.
If you use Microsoft Excel on a regular basis, odds are you work with numbers. Put those numbers to work. Statistical analysis allows you to find patterns, trends and probabilities within your data. In this MS Excel tutorial from everyone's favorite Excel guru, YouTube's ExcelsFun, the 27th installment in his "Excel Statistics" series of free video lessons, you'll learn how to create a quantitative data dot plot chart using the REPT and COUNTIF functions.
If you use Microsoft Excel on a regular basis, odds are you work with numbers. Put those numbers to work. Statistical analysis allows you to find patterns, trends and probabilities within your data. In this MS Excel tutorial from everyone's favorite Excel guru, YouTube's ExcelsFun, the 26th installment in his "Excel Statistics" series of free video lessons, you'll learn how to create quantitative data cumulative frequency distributions with pivot tables.
If you use Microsoft Excel on a regular basis, odds are you work with numbers. Put those numbers to work. Statistical analysis allows you to find patterns, trends and probabilities within your data. In this MS Excel tutorial from everyone's favorite Excel guru, YouTube's ExcelsFun, the 16th installment in his "Excel Statistics" series of free video lessons, you'll learn how to cross tabulate & do percentage cross tabulation for categorical data using a pivot table (PivotTable).
If you use Microsoft Excel on a regular basis, odds are you work with numbers. Put those numbers to work. Statistical analysis allows you to find patterns, trends and probabilities within your data. In this MS Excel tutorial from everyone's favorite Excel guru, YouTube's ExcelsFun, the 19th installment in his "Excel Statistics" series of free video lessons, you'll learn how to group categories in a frequency distribution with a formula (2 COUNTIF) and the pivot table (PivotTable) grouping fea...
If you use Microsoft Excel on a regular basis, odds are you work with numbers. Put those numbers to work. Statistical analysis allows you to find patterns, trends and probabilities within your data. In this MS Excel tutorial from everyone's favorite Excel guru, YouTube's ExcelsFun, the 17th installment in his "Excel Statistics" series of free video lessons, you'll learn how to cross tabulate & do percentage cross tabulation for categorical data using formulas rather than pivot tables.
If you use Microsoft Excel on a regular basis, odds are you work with numbers. Put those numbers to work. Statistical analysis allows you to find patterns, trends and probabilities within your data. In this MS Excel tutorial from everyone's favorite Excel guru, YouTube's ExcelsFun, the 3rd installment in his "Excel Statistics" series of free video lessons, you'll learn how to use Excel's sorting and pivot tables (PivotTables) data analysis tools.
If you use Microsoft Excel on a regular basis, odds are you work with numbers. Put those numbers to work. Statistical analysis allows you to find patterns, trends and probabilities within your data. In this MS Excel tutorial from everyone's favorite Excel guru, YouTube's ExcelsFun, the 35th installment in his "Excel Statistics" series of free video lessons, you'll learn how to calculate weighted and geometric means and see how to use the GEOMEAN function.
If you use Microsoft Excel on a regular basis, odds are you work with numbers. Put those numbers to work. Statistical analysis allows you to find patterns, trends and probabilities within your data. In this MS Excel tutorial from everyone's favorite Excel guru, YouTube's ExcelsFun, the 33rd installment in his "Excel Statistics" series of free video lessons, you'll learn how to use the AVEARGE, MEDIAN, MODE, PERCENTILE, QUARTILE and PERCENTILERANK functions to measure location.
If you use Microsoft Excel on a regular basis, odds are you work with numbers. Put those numbers to work. Statistical analysis allows you to find patterns, trends and probabilities within your data. In this MS Excel tutorial from everyone's favorite Excel guru, YouTube's ExcelsFun, the 4th installment in his "Excel Statistics" series of free video lessons, you'll learn how to create a frequency table and percentage frequency table using a Pivot Table (PivotTable).
In this video acoustic guitar video lesson, brought to you by GuitarJamz, host Marty Schwarz, will teach you how to play "Fireflies" by Owl City. To begin you will need a capo to play the song. As you follow along with him, he breaks down the strumming of the chords used in the song, breaking down each part of the song, teaching you the chords and explaining the strum pattern of the song, going into detail and demonstrating how to finger the chords he uses.