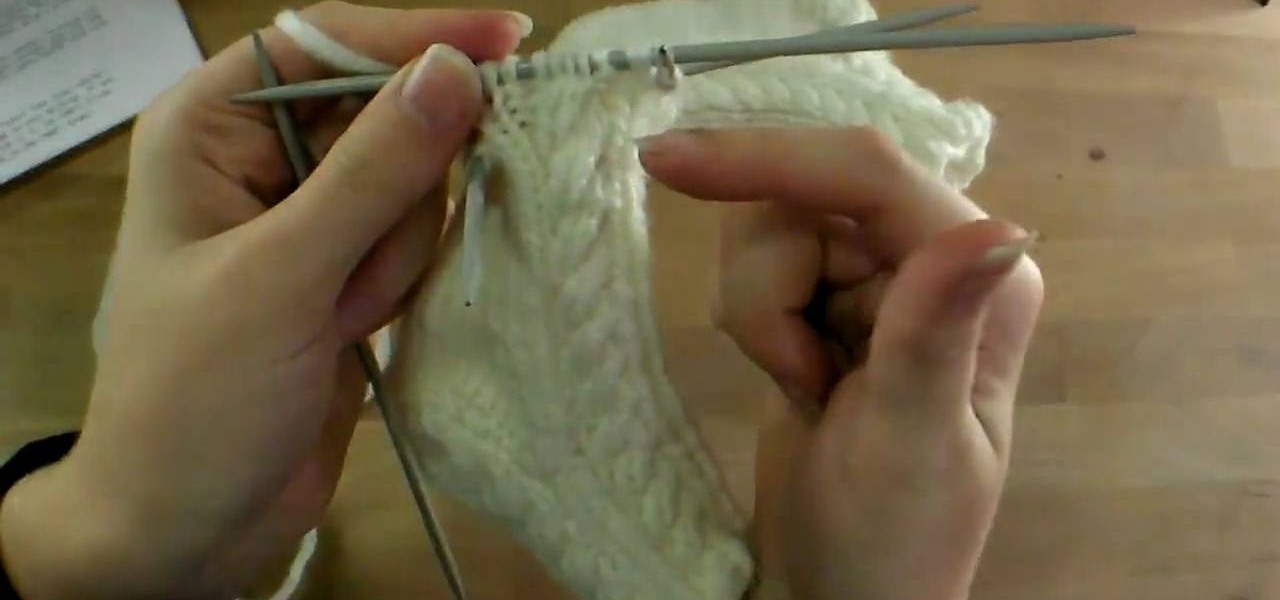
Crochet cables, which look like little round buds, create beautiful patterns and are often seen on sweaters. This tutorial shows you how to master this unique crochet pattern. All you need is crochet yarn, a hook, and a little bit of patience.
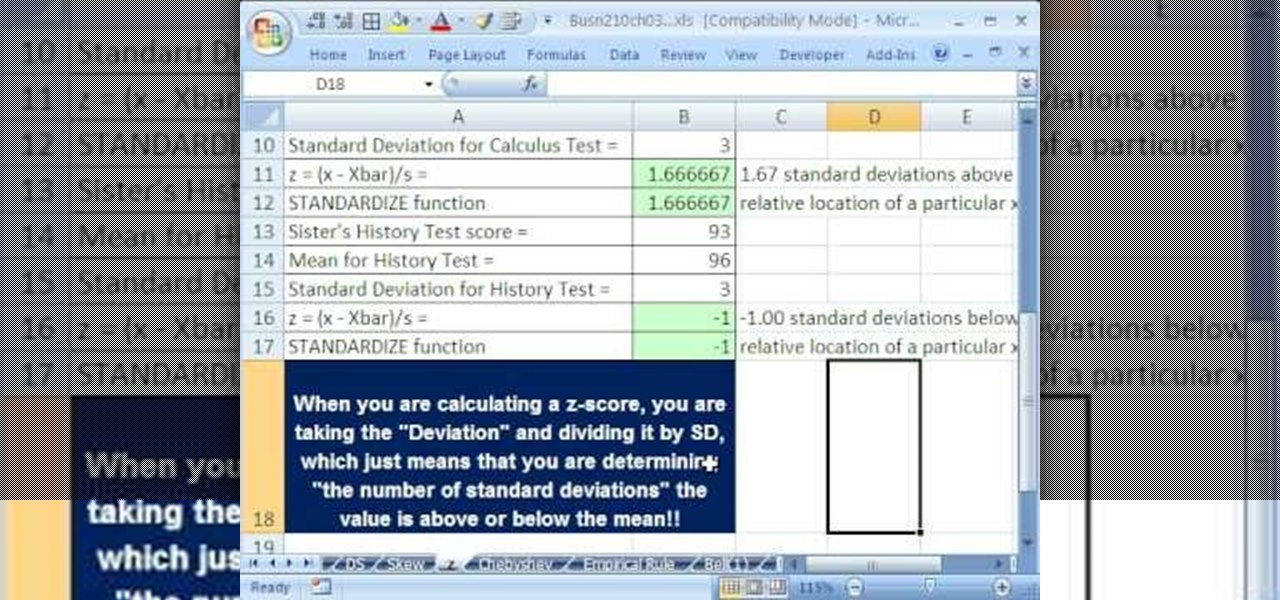
If you use Microsoft Excel on a regular basis, odds are you work with numbers. Put those numbers to work. Statistical analysis allows you to find patterns, trends and probabilities within your data. In this MS Excel tutorial from everyone's favorite Excel guru, YouTube's ExcelsFun, the 45th installment in his "Excel Statistics" series of free video lessons, you'll learn how to see how to calculate a z-score.
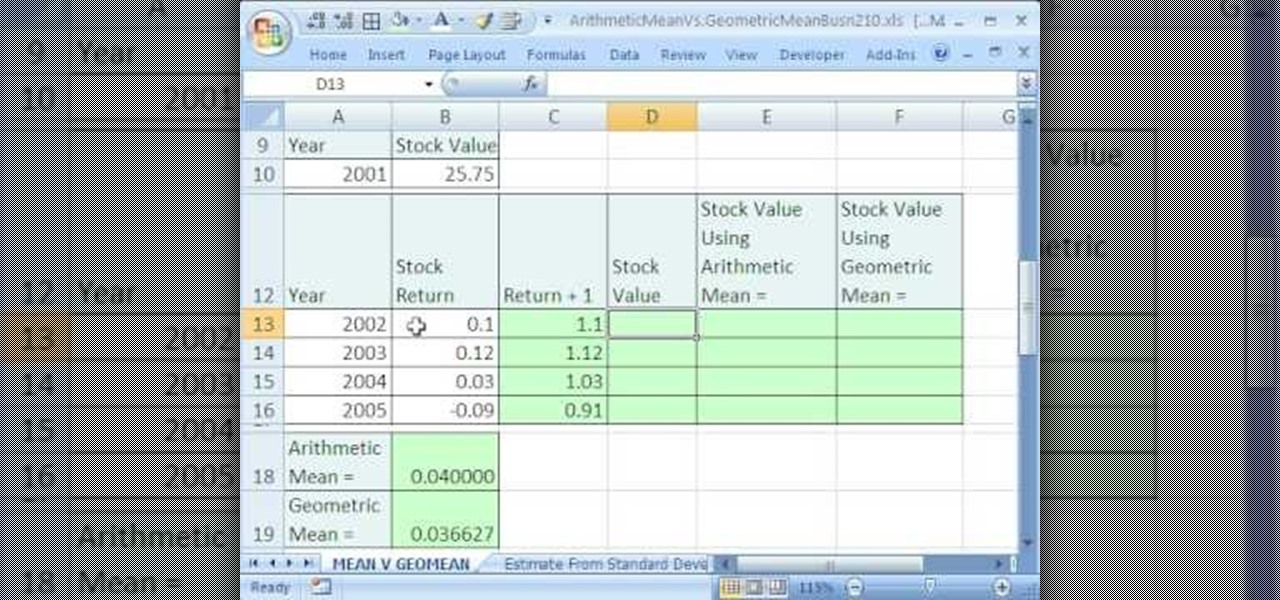
If you use Microsoft Excel on a regular basis, odds are you work with numbers. Put those numbers to work. Statistical analysis allows you to find patterns, trends and probabilities within your data. In this MS Excel tutorial from everyone's favorite Excel guru, YouTube's ExcelsFun, the 35.2nd installment in his "Excel Statistics" series of free video lessons, you'll learn how to use Excel's GEOMEAN function to find geometric mean.
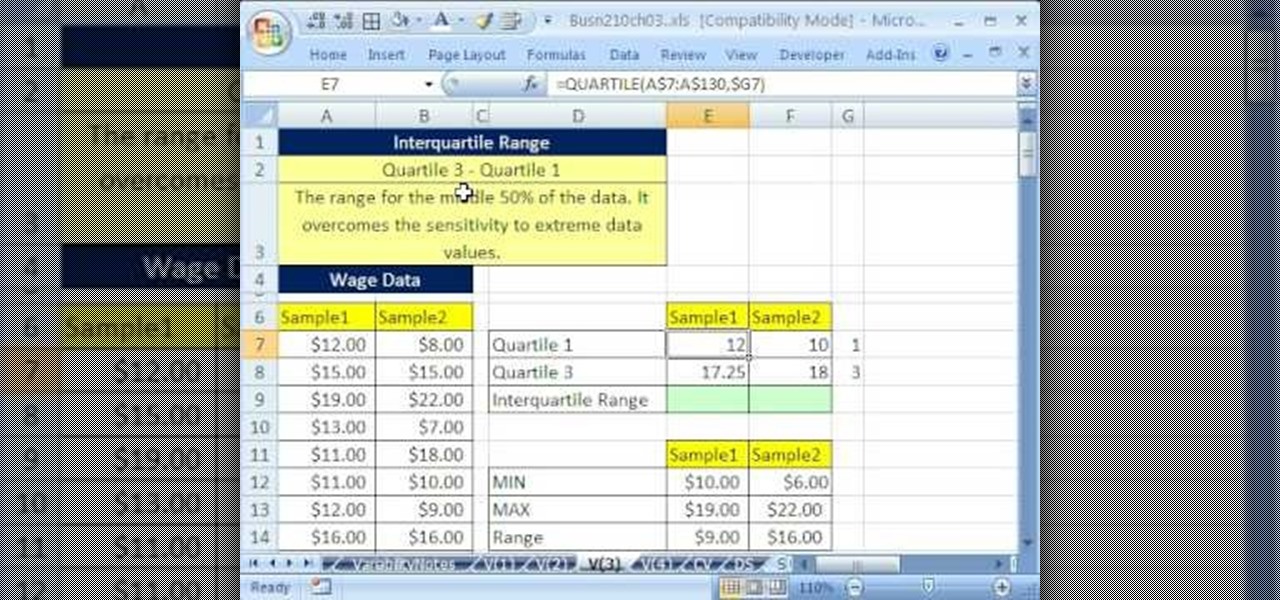
If you use Microsoft Excel on a regular basis, odds are you work with numbers. Put those numbers to work. Statistical analysis allows you to find patterns, trends and probabilities within your data. In this MS Excel tutorial from everyone's favorite Excel guru, YouTube's ExcelsFun, the 40th installment in his "Excel Statistics" series of free video lessons, you'll learn how to calculate range & interquartile range for variability using the MAX, MIN, QUARTILE functions.
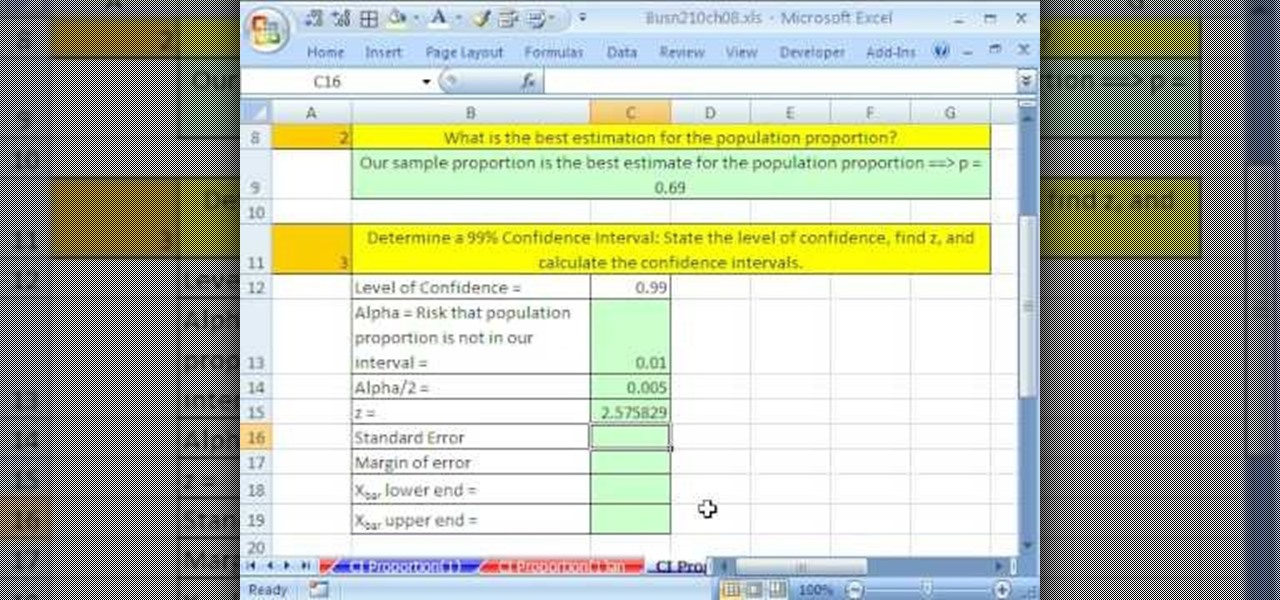
If you use Microsoft Excel on a regular basis, odds are you work with numbers. Put those numbers to work. Statistical analysis allows you to find patterns, trends and probabilities within your data. In this MS Excel tutorial from everyone's favorite Excel guru, YouTube's ExcelsFun, the 86th installment in his "Excel Statistics" series of free video lessons, you'll learn how to construct confidence intervals for proportions using NORMSINV function and other formulas.
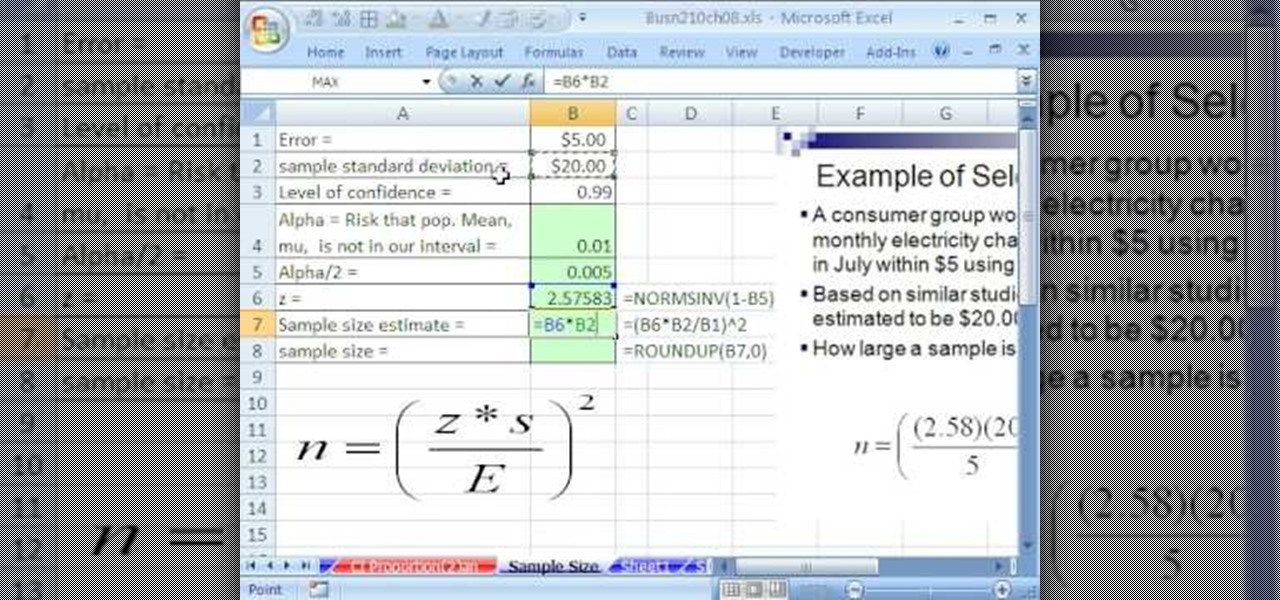
If you use Microsoft Excel on a regular basis, odds are you work with numbers. Put those numbers to work. Statistical analysis allows you to find patterns, trends and probabilities within your data. In this MS Excel tutorial from everyone's favorite Excel guru, YouTube's ExcelsFun, the 87th installment in his "Excel Statistics" series of free video lessons, you'll learn how to calculate sample size (n) for confidence intervals.

If you use Microsoft Excel on a regular basis, odds are you work with numbers. Put those numbers to work. Statistical analysis allows you to find patterns, trends and probabilities within your data. In this MS Excel tutorial from everyone's favorite Excel guru, YouTube's ExcelsFun, the 27th installment in his "Excel Statistics" series of free video lessons, you'll learn how to create a quantitative data dot plot chart using the REPT and COUNTIF functions.

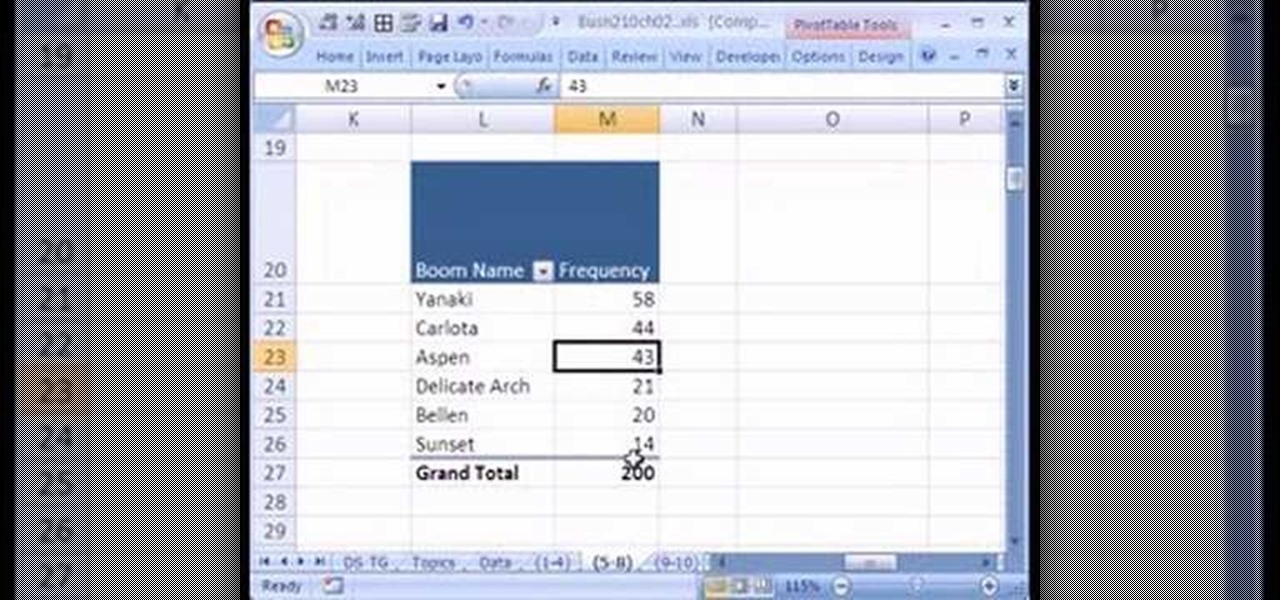
If you use Microsoft Excel on a regular basis, odds are you work with numbers. Put those numbers to work. Statistical analysis allows you to find patterns, trends and probabilities within your data. In this MS Excel tutorial from everyone's favorite Excel guru, YouTube's ExcelsFun, the 26th installment in his "Excel Statistics" series of free video lessons, you'll learn how to create quantitative data cumulative frequency distributions with pivot tables.

If you use Microsoft Excel on a regular basis, odds are you work with numbers. Put those numbers to work. Statistical analysis allows you to find patterns, trends and probabilities within your data. In this MS Excel tutorial from everyone's favorite Excel guru, YouTube's ExcelsFun, the 16th installment in his "Excel Statistics" series of free video lessons, you'll learn how to cross tabulate & do percentage cross tabulation for categorical data using a pivot table (PivotTable).

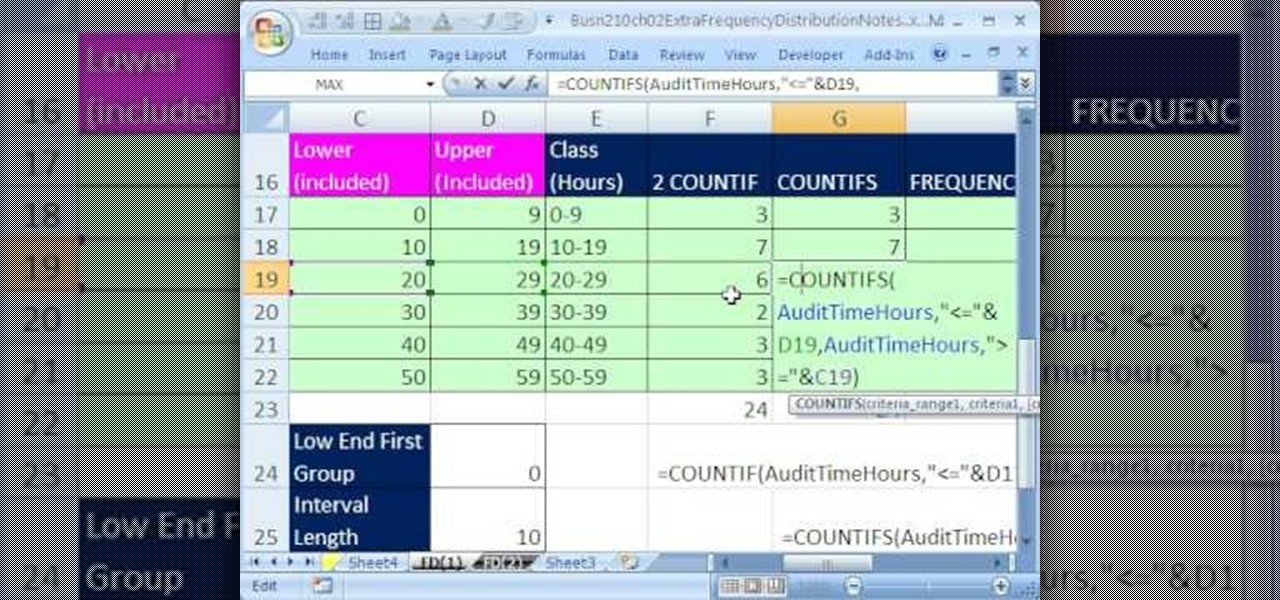
If you use Microsoft Excel on a regular basis, odds are you work with numbers. Put those numbers to work. Statistical analysis allows you to find patterns, trends and probabilities within your data. In this MS Excel tutorial from everyone's favorite Excel guru, YouTube's ExcelsFun, the 19th installment in his "Excel Statistics" series of free video lessons, you'll learn how to group categories in a frequency distribution with a formula (2 COUNTIF) and the pivot table (PivotTable) grouping fea...

If you use Microsoft Excel on a regular basis, odds are you work with numbers. Put those numbers to work. Statistical analysis allows you to find patterns, trends and probabilities within your data. In this MS Excel tutorial from everyone's favorite Excel guru, YouTube's ExcelsFun, the 17th installment in his "Excel Statistics" series of free video lessons, you'll learn how to cross tabulate & do percentage cross tabulation for categorical data using formulas rather than pivot tables.

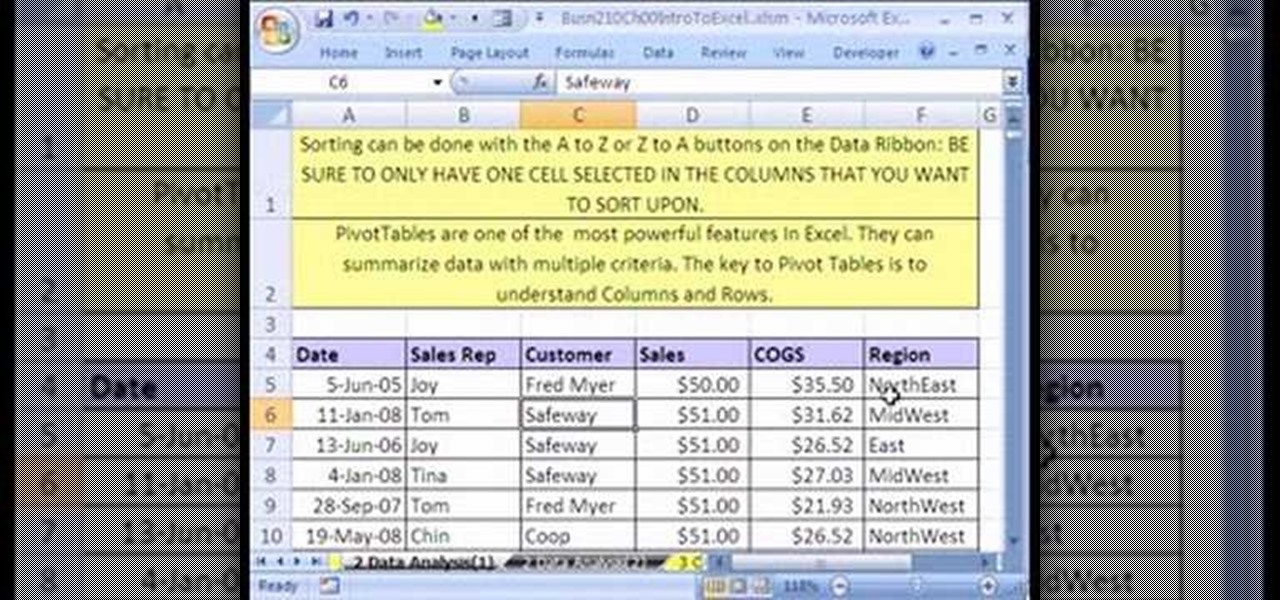
If you use Microsoft Excel on a regular basis, odds are you work with numbers. Put those numbers to work. Statistical analysis allows you to find patterns, trends and probabilities within your data. In this MS Excel tutorial from everyone's favorite Excel guru, YouTube's ExcelsFun, the 3rd installment in his "Excel Statistics" series of free video lessons, you'll learn how to use Excel's sorting and pivot tables (PivotTables) data analysis tools.

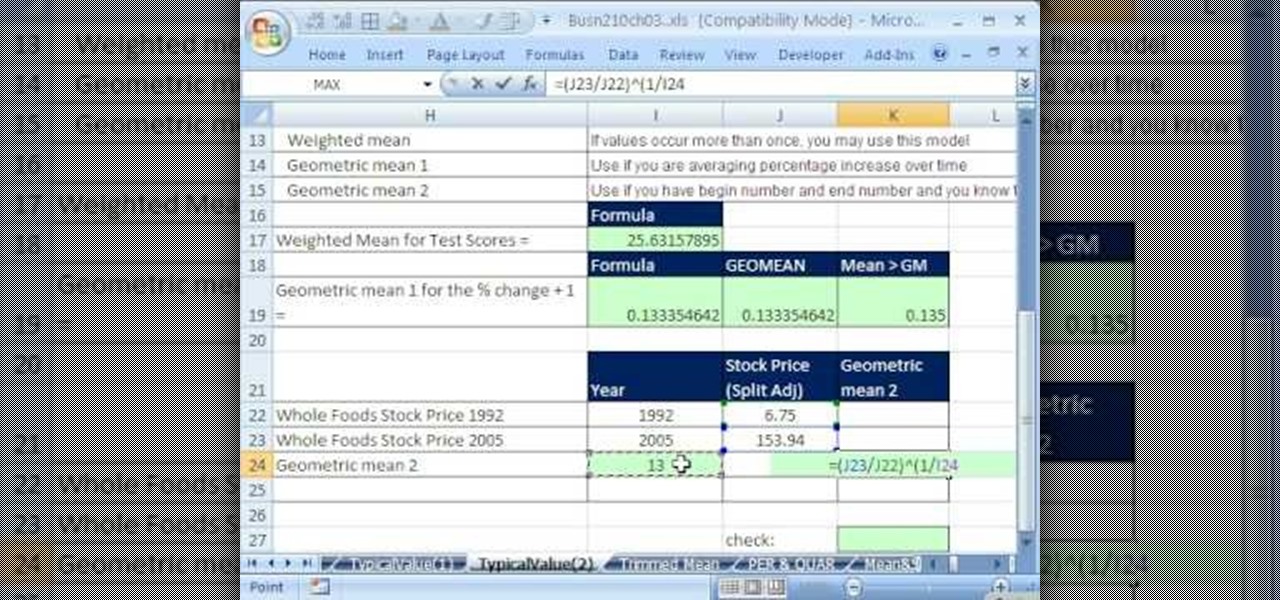
If you use Microsoft Excel on a regular basis, odds are you work with numbers. Put those numbers to work. Statistical analysis allows you to find patterns, trends and probabilities within your data. In this MS Excel tutorial from everyone's favorite Excel guru, YouTube's ExcelsFun, the 35th installment in his "Excel Statistics" series of free video lessons, you'll learn how to calculate weighted and geometric means and see how to use the GEOMEAN function.

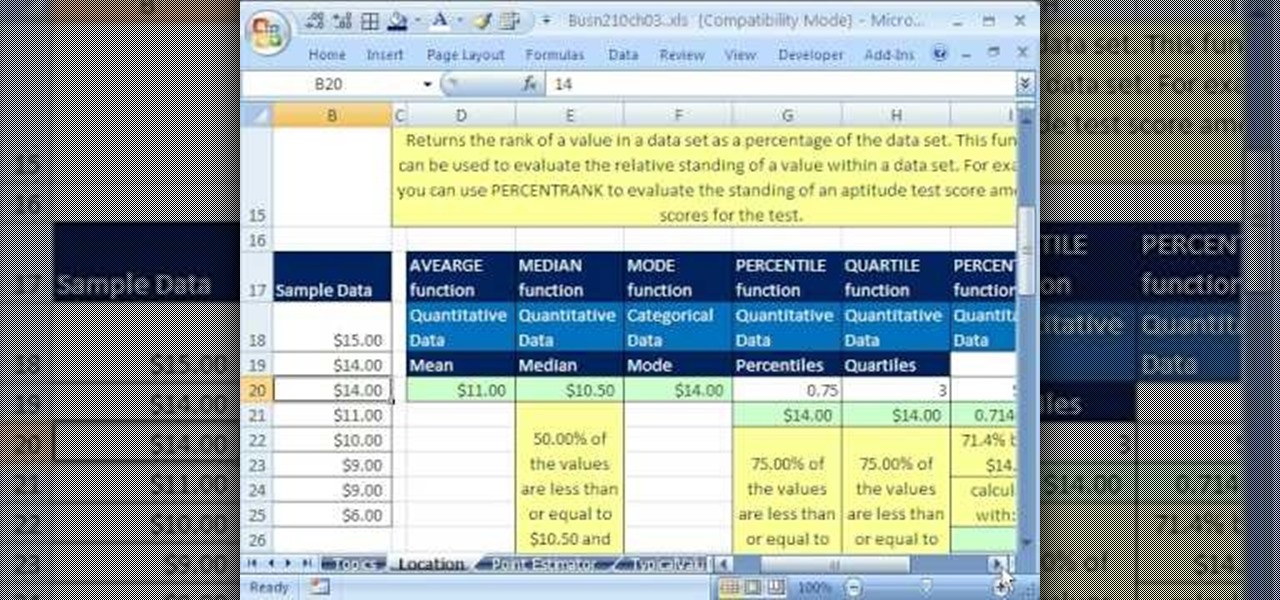
If you use Microsoft Excel on a regular basis, odds are you work with numbers. Put those numbers to work. Statistical analysis allows you to find patterns, trends and probabilities within your data. In this MS Excel tutorial from everyone's favorite Excel guru, YouTube's ExcelsFun, the 33rd installment in his "Excel Statistics" series of free video lessons, you'll learn how to use the AVEARGE, MEDIAN, MODE, PERCENTILE, QUARTILE and PERCENTILERANK functions to measure location.

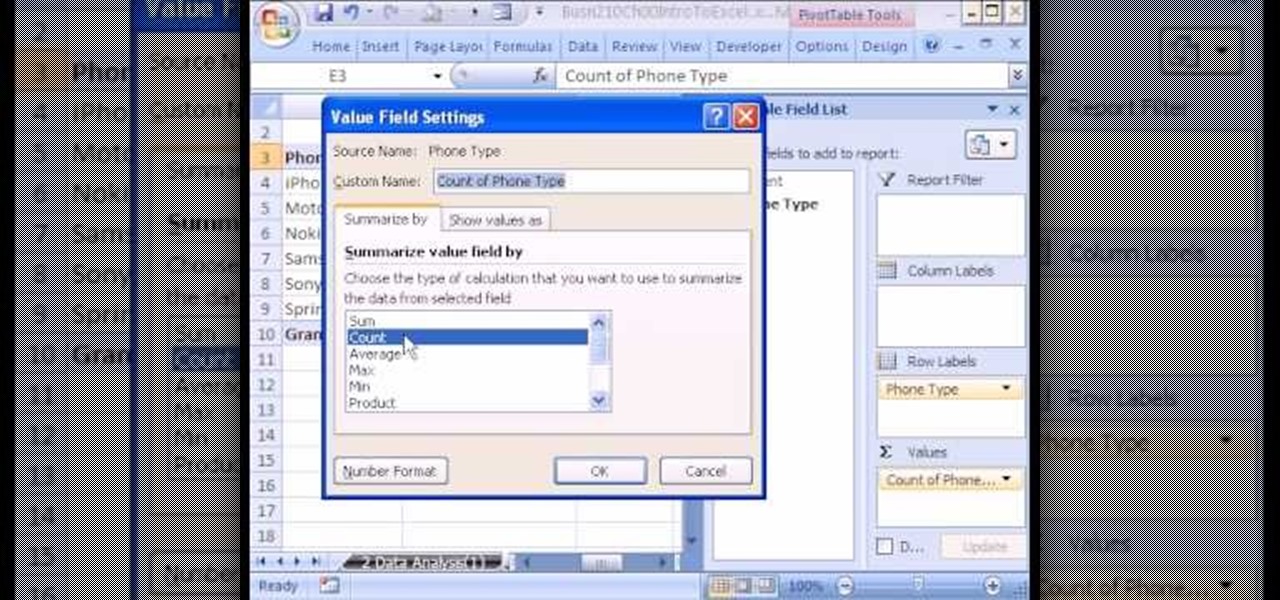
If you use Microsoft Excel on a regular basis, odds are you work with numbers. Put those numbers to work. Statistical analysis allows you to find patterns, trends and probabilities within your data. In this MS Excel tutorial from everyone's favorite Excel guru, YouTube's ExcelsFun, the 4th installment in his "Excel Statistics" series of free video lessons, you'll learn how to create a frequency table and percentage frequency table using a Pivot Table (PivotTable).

Cable knits are sometimes considered too complex for hobbyist knitters to attempt, but this video tutorial from the folks at Make Magazine will introduce you to this classic technique. Pioneered in Ireland by the wives of fishermen, the look of cable knits actually reflects fishermen's ropes and other aspects of their lives. While cable knits look complex, in this video you will see that they really don't have to be that much more complicated to create then the patterns you're used to working...

If you need to know how to make an arrangement on an acoustic solo fingerstyle guitar, you've come to the right video tutorials. This three-part instructional guitar lesson will show you want you need to know about arranging.

This audio production software tutorial covers how to go sequence with the Keyboard Editor in FL Studio and covers creating notes with different pitches, moving notes, and using portamento. See all these ways to use the keyboard editor to make patterns in FL Studio.

Here are some examples of brickwork for dioramas or war game terrain. Create a fine grit coating for foam carvings using a mixture of white glue, paint and fine sand. Press in brick patterns into foam, or if working in smaller scale, you can coat cardboard with a thin coat of plaster. Find old pieces of dry flat wood to create miniature slats of wood for sides of a barn or haunted house.

Do you want to learn to play drums for the very first time? Watch Mike Michalkow's step-by-step training video to get started. It will guide you through four simple patterns that form a basic rock drum beat.

In the wonderful world of fashion, Chucks (AKA Converse sneakers) are like the LBDs for our feet. Oh-so-comfortable and also exuding an effortless hipster cool, Chucks are our go-to footwear any time of day. But because they're so practic and chic we also see zillions of people wearing the same exact shoe on the streets.

Spring-loaded clothespins are used for more than just clothes. If you looked in anyone's home, you'll see these springy wooden clothespins used for things like chip clips, photo holders and even for attaching sports cards on bicycle spokes. They're even used in the film industry (called C47s or bullets) for clamping colored gels or diffusion to hot lights on set. So, there's a million uses for these wooden clamps, but that doesn't mean they have to look the same— drab and unoriginal.

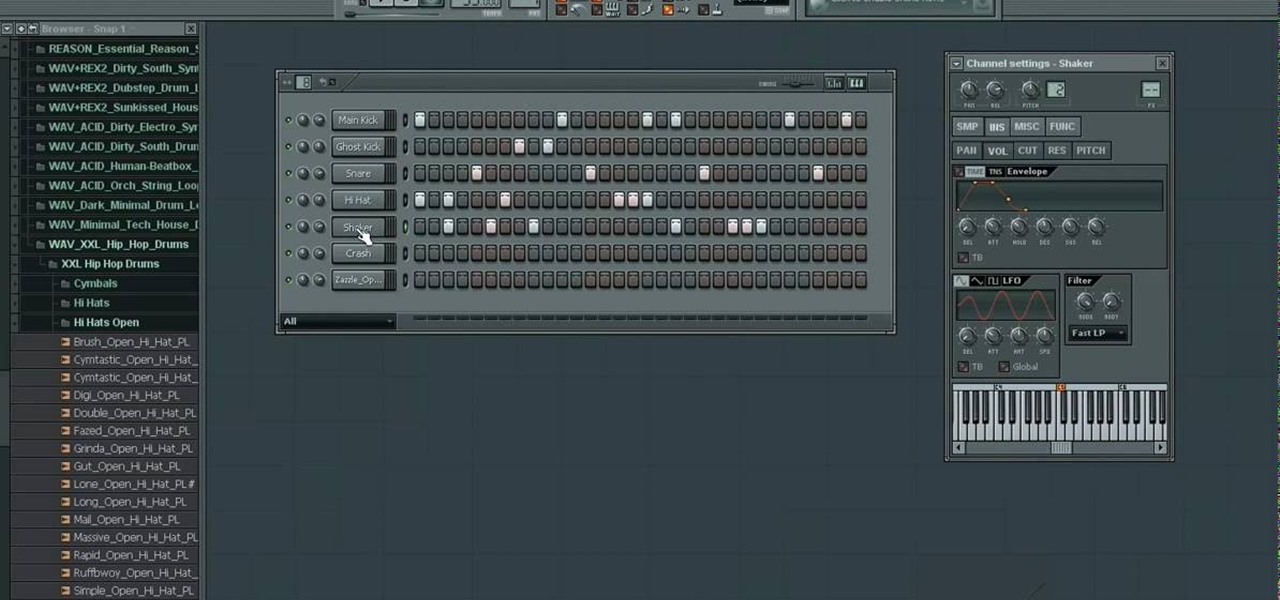
In this video we learn how to make a hip hop beat in FL Studio. First, load up your drum sounds from the browser to the interface. After this, change the hits on the drums to make the beat sound different. Edit how high the volume is on the snare drum and then change the ghost kick so it's not too loud either. Once you have this figured out, add in the high hat and the shaker patterns. Once you have these added in and you like the volumes that they are at, you will have your very own hip hop ...

The blues is where it all began. Before you learn how to play rock or jazz or metal, you should start with the blues. Learning the basic 12 bar form can help you feel out measures and develop your sense of direction in music, and learning how to play the shuffled rhythm will help to increase your proficiency with learning other rhythm patterns. In this fantastic video you will get a basic over view of the Blues on the acoustic guitar and a quick variation on the standard blues shuffle.

Fairy costumes are as common as witch costumes or vampire costumes (especially now with the "Twilight" fever) for Halloween. But dark fairies are a whole other category altogether. Rather than the cute pink frills, golden hair, and pixie dust you imagine your typical Disney fairy to have, the dark fairy in this makeup tutorial is scary, though still beautiful.

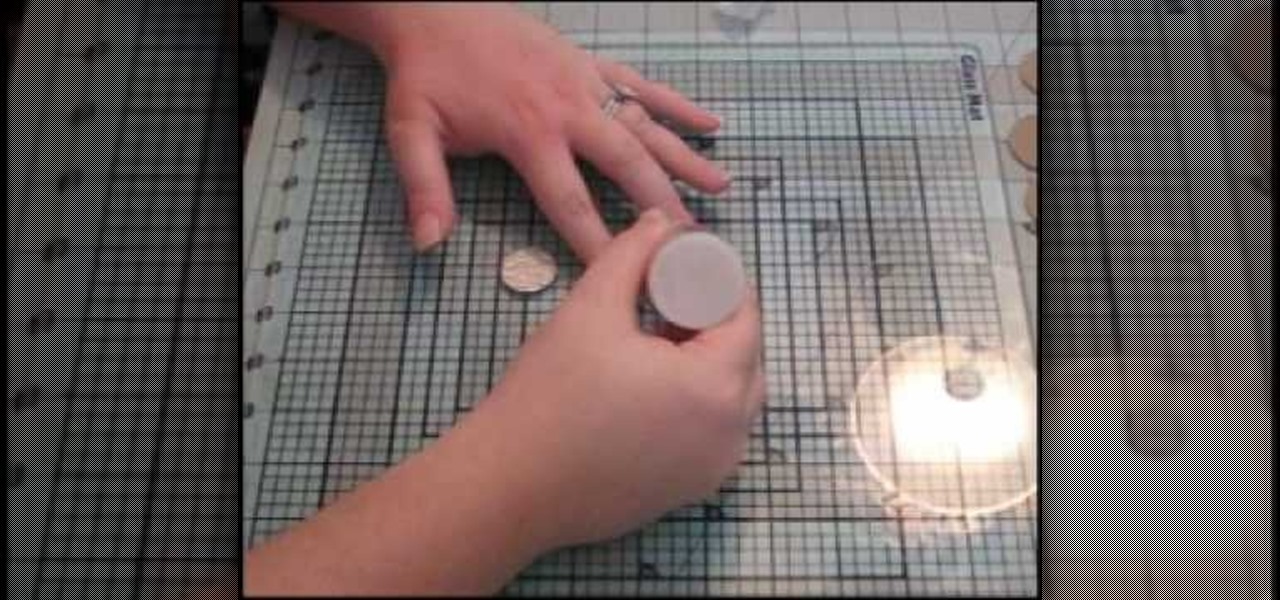
In this video, we learn how to make custom chipboard buttons for scrapbooking. First, take a scrap of chipboard and use a circle trimmer to cut circles out. Cut circles out of patterned paper in different sizes using many different patterns. Now, apply glossy finish onto the papers and wipe off the excess liquid. Ink the edges after this, then put adhesive onto the back of each of the different circles. Now, you can punch holes into the center of the circle to make it look like a button. Now,...

There's no better time to sing the blues than in this current economy. After all, picking at your guitar strings and humming a bittersweet tune is a lot better than sitting around depressed and verbally complaining about your life.

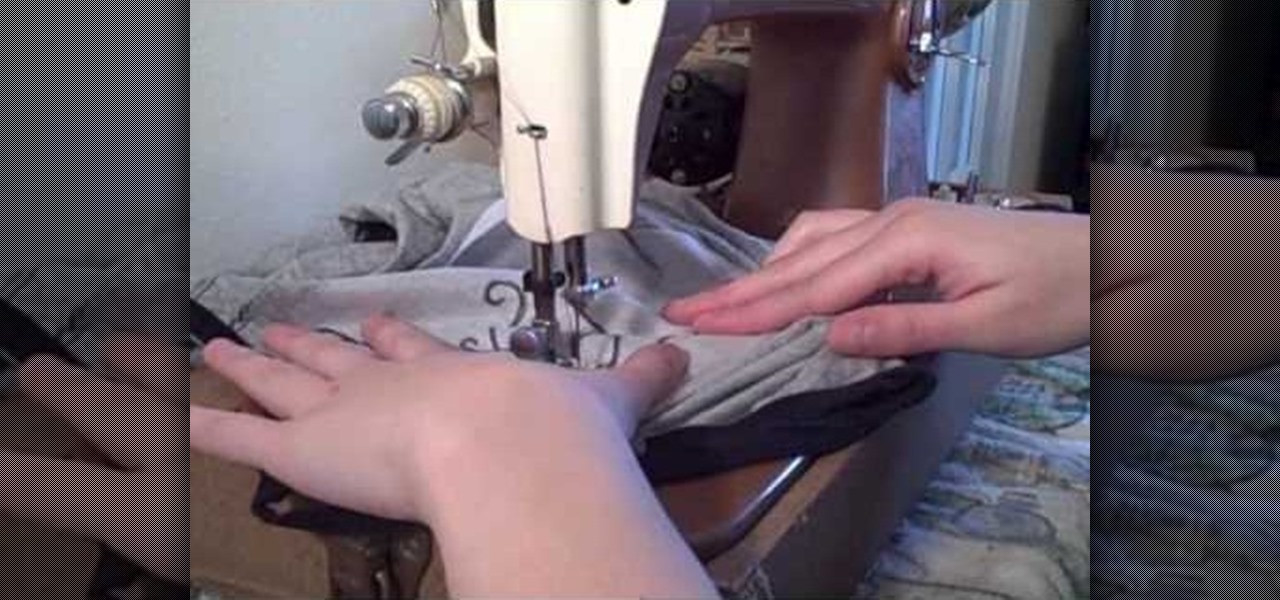
Back in the olden days, whenever we desired a nicely embroidered hankerchief or gown we'd sit by the fire with a flickering oil lamp, whittling our fingers away until the breaking hours of dawn. But nowadays, thanks to the genius of sewing machines, embroidery, even the most intricate kinds, takes far less time and midnight oil.

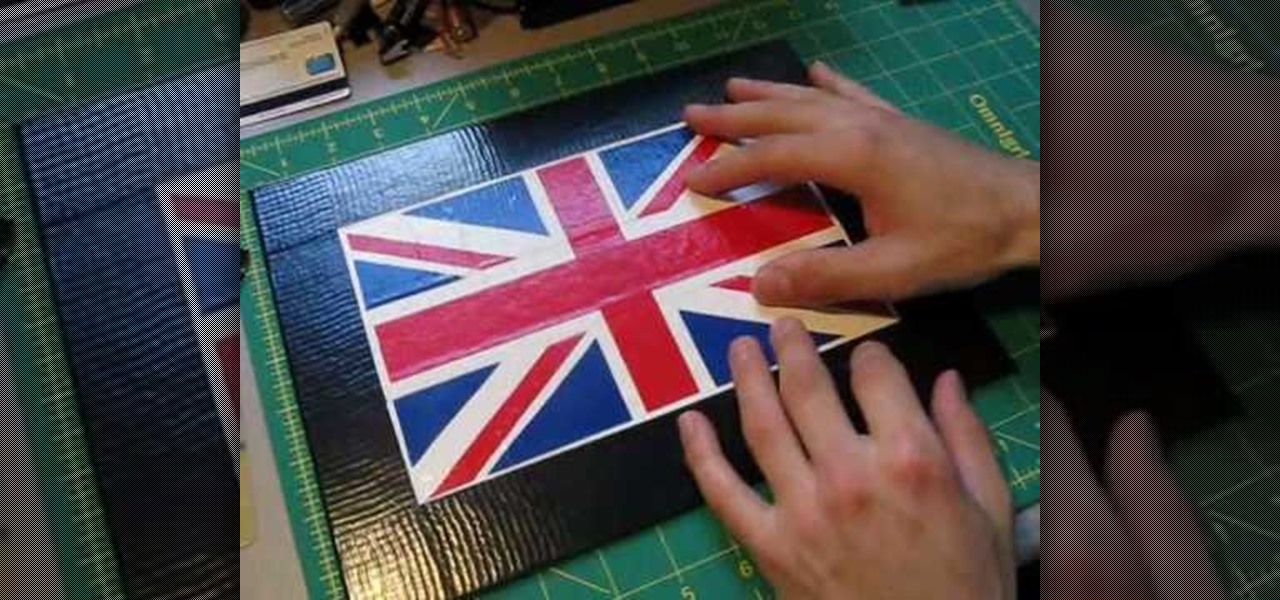
Okay, just to clear things up before you head over to watch the video, duct tape painting does not involve grinding up little pieces of duct tape to make paint.

Involving thousands of intricate folds, tucks, and nips, origami patterns perplex even the most experienced of L.A. plastic surgeons.

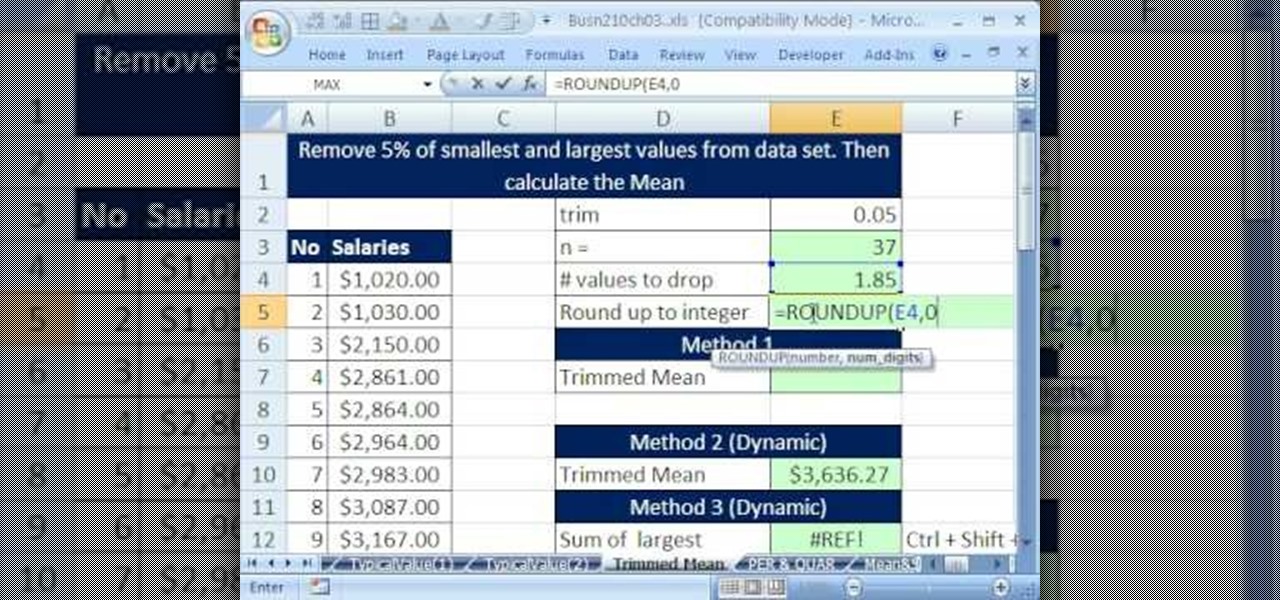
If you use Microsoft Excel on a regular basis, odds are you work with numbers. Put those numbers to work. Statistical analysis allows you to find patterns, trends and probabilities within your data. In this MS Excel tutorial from everyone's favorite Excel guru, YouTube's ExcelsFun, the 36th installment in his "Excel Statistics" series of free video lessons, you'll learn how to calculate a trimmed mean, which is used when there are extreme values in the data set that might skew the mean.

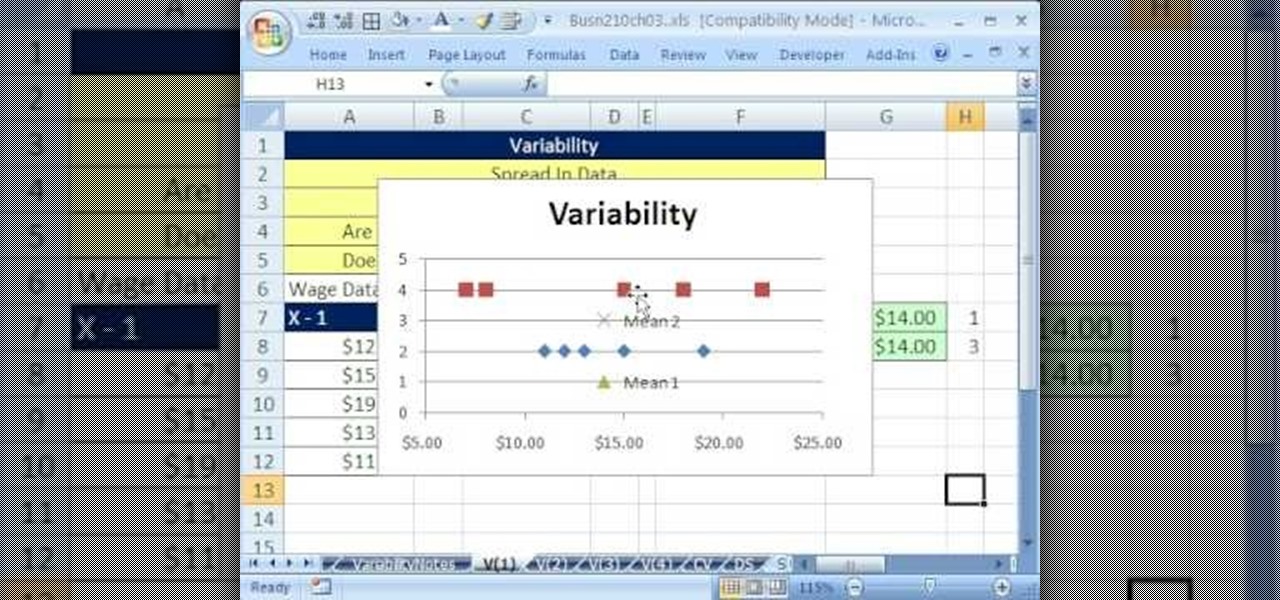
If you use Microsoft Excel on a regular basis, odds are you work with numbers. Put those numbers to work. Statistical analysis allows you to find patterns, trends and probabilities within your data. In this MS Excel tutorial from everyone's favorite Excel guru, YouTube's ExcelsFun, the 39th installment in his "Excel Statistics" series of free video lessons, you'll learn about variability (or dispersion or spread). Create an X-Y Scatter Diagram chart showing data points and the mean.

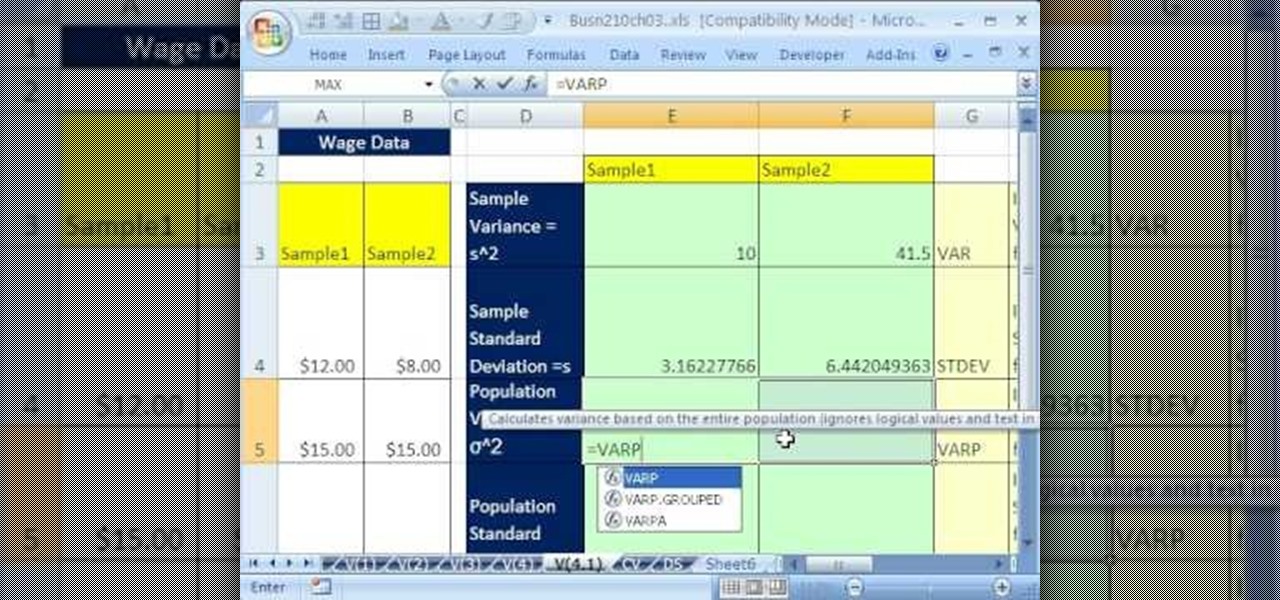
If you use Microsoft Excel on a regular basis, odds are you work with numbers. Put those numbers to work. Statistical analysis allows you to find patterns, trends and probabilities within your data. In this MS Excel tutorial from everyone's favorite Excel guru, YouTube's ExcelsFun, the 41st installment in his "Excel Statistics" series of free video lessons, you'll learn how to calculate deviations, variance and standard deviation for a sample and a population using Excel tables and the VAR, S...

If you use Microsoft Excel on a regular basis, odds are you work with numbers. Put those numbers to work. Statistical analysis allows you to find patterns, trends and probabilities within your data. In this MS Excel tutorial from everyone's favorite Excel guru, YouTube's ExcelsFun, the 32nd installment in his "Excel Statistics" series of free video lessons, you'll learn how to group when the quantitative data are whole numbers, integers or discrete data and how to group when the quantitative ...

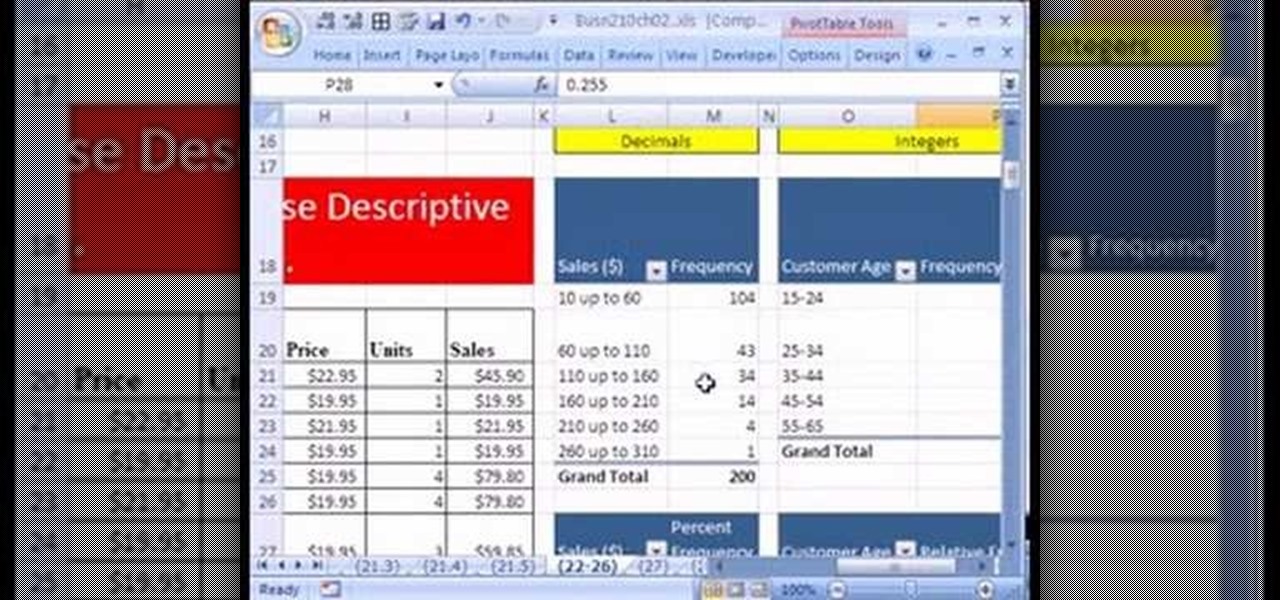
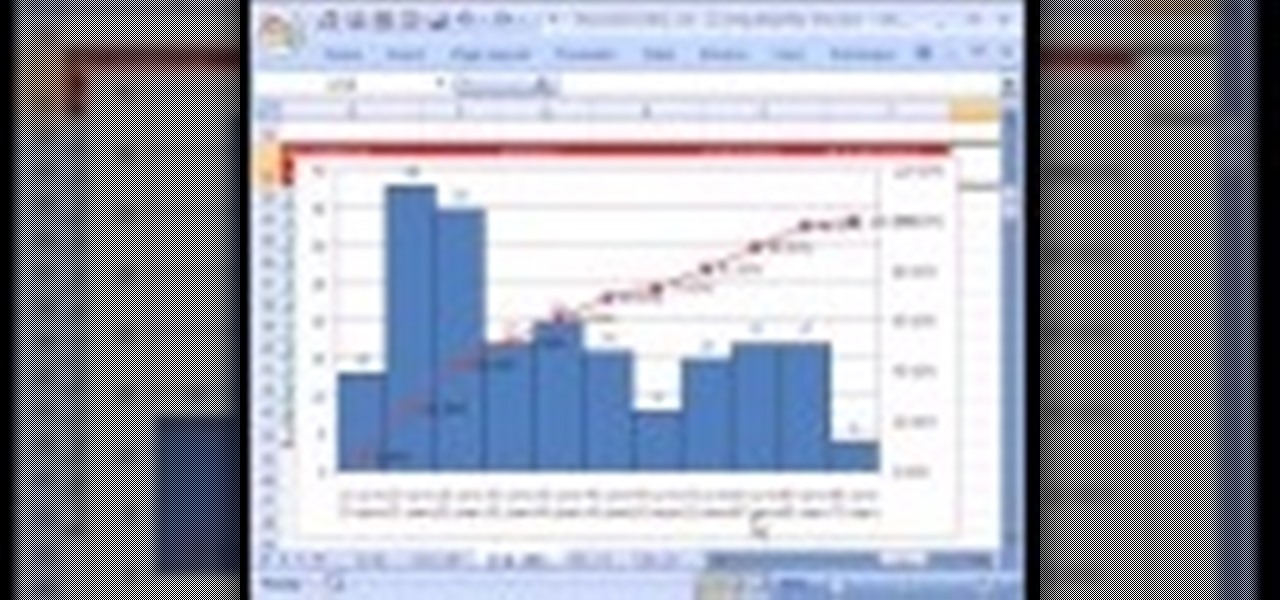
If you use Microsoft Excel on a regular basis, odds are you work with numbers. Put those numbers to work. Statistical analysis allows you to find patterns, trends and probabilities within your data. In this MS Excel tutorial from everyone's favorite Excel guru, YouTube's ExcelsFun, the 25th installment in his "Excel Statistics" series of free video lessons, you'll learn how to create quantitative data percent & relative frequency distributions with pivot tables. Also see how to create a histo...

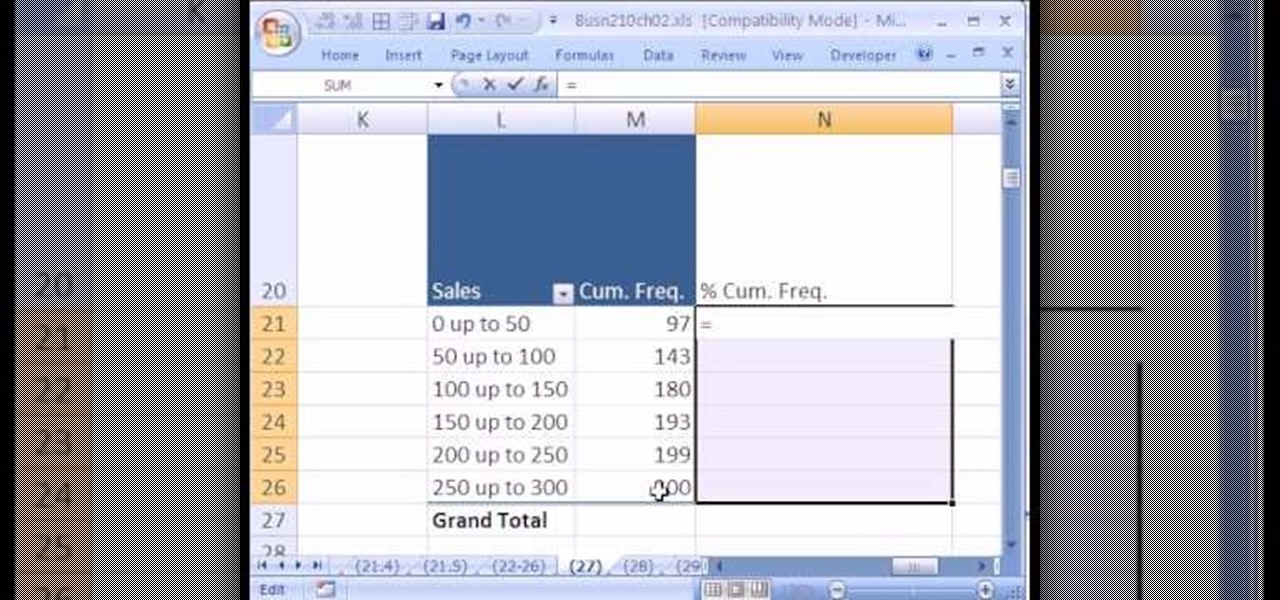
If you use Microsoft Excel on a regular basis, odds are you work with numbers. Put those numbers to work. Statistical analysis allows you to find patterns, trends and probabilities within your data. In this MS Excel tutorial from everyone's favorite Excel guru, YouTube's ExcelsFun, the 22nd installment in his "Excel Statistics" series of free video lessons, you'll learn how to create a percent (%) cumulative frequency distribution with formulas, a histogram and an ogive chart. See how to add ...

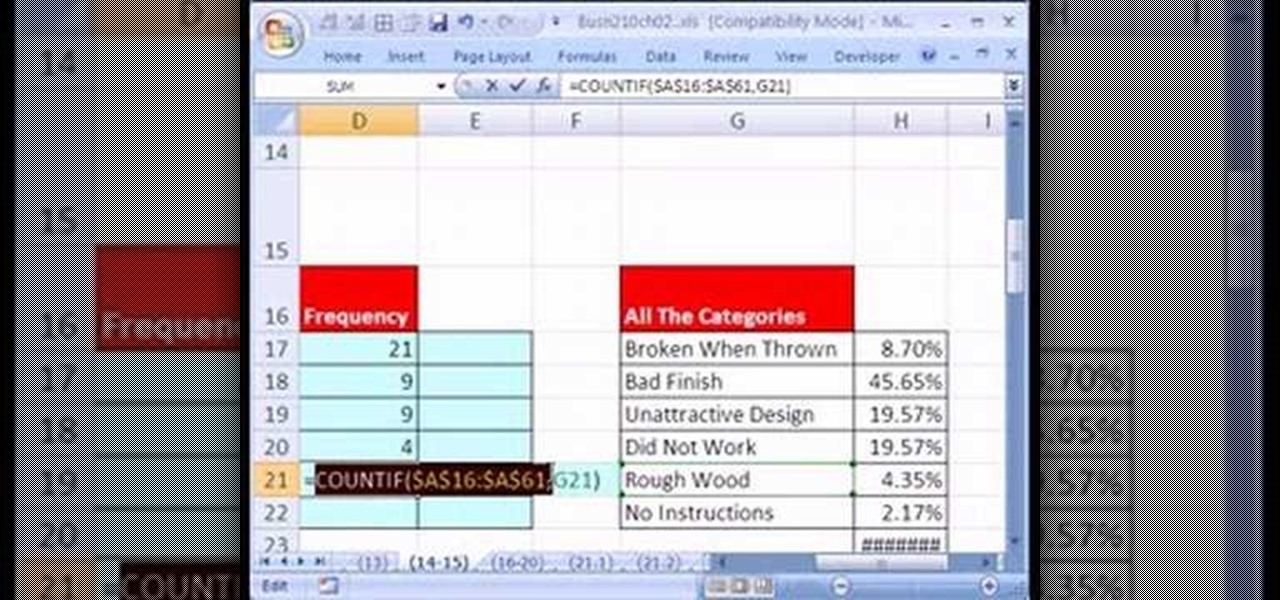
If you use Microsoft Excel on a regular basis, odds are you work with numbers. Put those numbers to work. Statistical analysis allows you to find patterns, trends and probabilities within your data. In this MS Excel tutorial from everyone's favorite Excel guru, YouTube's ExcelsFun, the 15th installment in his "Excel Statistics" series of free video lessons, you'll learn how to use create a frequency distribution, relative frequency distribution, percent frequency distribution and pie chart wi...

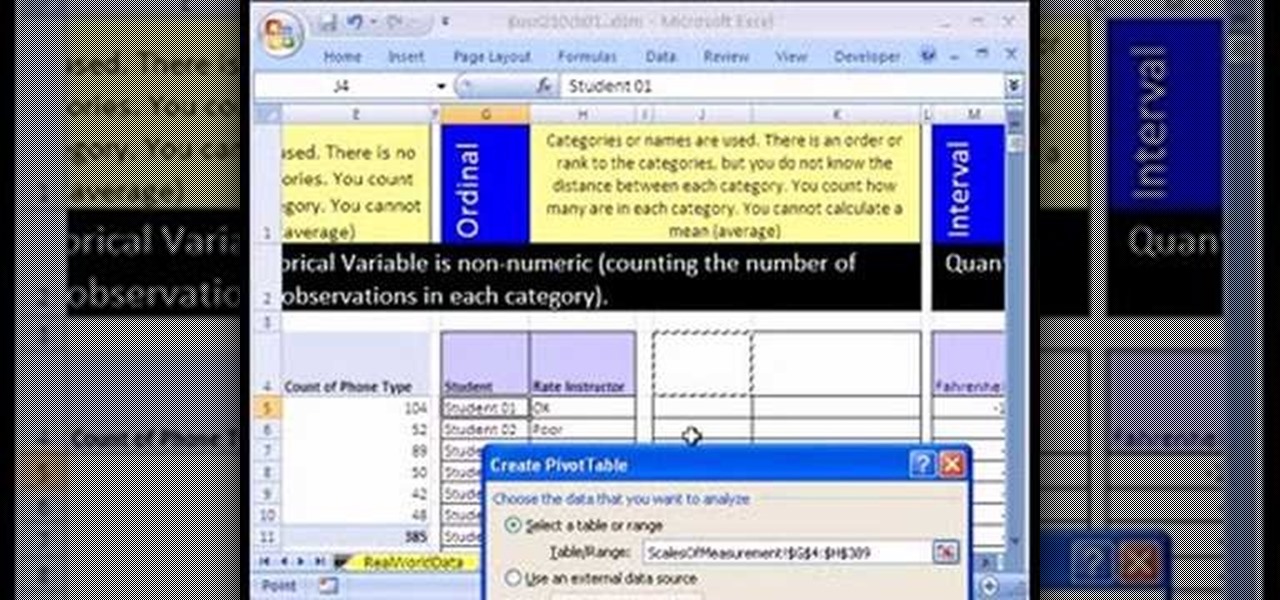
If you use Microsoft Excel on a regular basis, odds are you work with numbers. Put those numbers to work. Statistical analysis allows you to find patterns, trends and probabilities within your data. In this MS Excel tutorial from everyone's favorite Excel guru, YouTube's ExcelsFun, the 10th installment in his "Excel Statistics" series of free video lessons, you'll learn how about data sets and the nominal, ordinal, interval and ration scales/levels of measurement and see two Pivot Tables that...

In this acoustic guitar video lesson, brought to you by RockGuitarPower, host Mike, will teach you how to play "Stairway To Heaven" by Led Zeppelin. As you follow along with him, he teaches you the progression of the chords used in the song, breaking down each part of the song, teaching you the chords and explaining the strum pattern and picking of the guitar riffs. This tutorial covers the intro, solo, and rhythm patterns used in the song, and illustrates the chords used in tab notation.

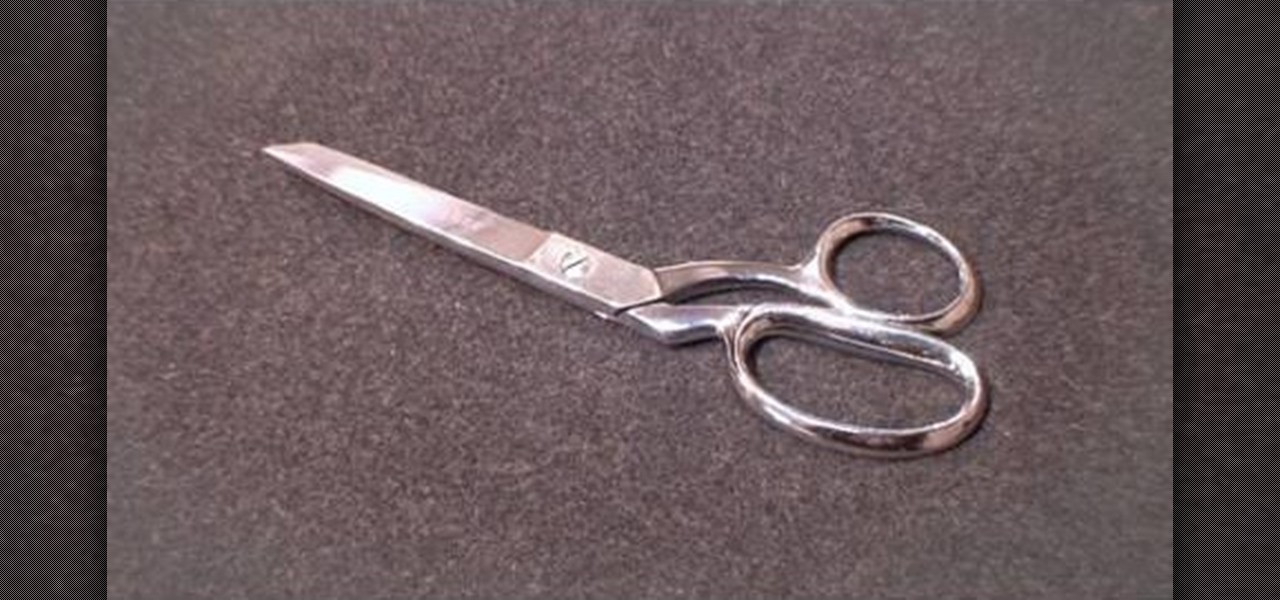
Learn how to use bent handled trimmers: Kenneth D. King of ThreadBanger Quickies and NextNewNetworks explain how to use bent handled trimmers for working with fabric projects. Bent handled trimmers are great for cutting out fabric patterns and designs. The scissor itself slides along the smooth plane of the cutting table and it lifts the fabric just enough to successfully cut the pattern out. Bent handled trimmers make a very accurate cut. Never ever use your fabric scissors for cutting paper.


